Differential response of bird functional traits to post-fire salvage logging in a
1
boreal forest ecosystem
2 3
Short title: Bird functional traits and post-fire salvage logging
4 5
Ermias T. Azeria1, Jacques Ibarzabal2, Christian Hébert1, Jonathan Boucher2, Louis Imbeau3 & 6
Jean-Pierre L. Savard4 7
8 1
Natural Resources Canada, Canadian Forest Service, Laurentian Forestry Centre, 1055 du
9
P.E.P.S., P.O. Box 10380, Stn. Sainte-Foy, Québec, QC, G1V 4C7, Canada
10
2
Université du Québec à Chicoutimi, Département des sciences fondamentales, Pavillon
11
principal, 555, boulevard de l’Université, Chicoutimi (Québec) G7H 2B1, Canada.
12 3
Chaire industrielle CRSNG UQAT-UQAM en aménagement forestier durable, Université du
13
Québec en Abitibi-Témiscamingue, Département des sciences appliquées, Centre d'Amos, 341,
14
Principale Nord, Amos (Québec), J9T 2L8
15 4
Science et Technologie, Environnement Canada, Région de Québec Région, 1141, route de
16
l’Église, C.P. 10100, Québec (Québec) G1V 4H5, Canada.
17 18
*Corresponding address: Ermias Azeria, Natural Resources Canada, Canadian Forest Service,
19
Laurentian Forestry Centre,1055 du P.E.P.S., P.O. Box 10380, Stn. Sainte-Foy, Québec, 20
QC,G1V 4C7, Canada. E-mail: Ermias.Azeria@NRCan-RNCan.gc.ca 21
(Ermias.Azeria@gmail.com) 22
23 24
Abstract
1
The concept of functional trait-environment relationship posits that species in a local 2
community should possess similar traits that match the selective environment. The present 3
study examines species trait-habitat (using Fourth-corner and RLQ analyses) and habitat 4
occupancy patterns (logistic regression models) of bird assemblages in boreal forest stands 5
following disturbances by forest fire and salvage logging. The stands differed in the amount and 6
composition of residual tree retention, salvage- and aquatic-edges, degree of burn severity (all 7
measured at 100 and 500m buffers), as well as landscape-level variables such as distance to 8
previously burned forests. Tests of trait-habitat relationships showed that canopy-nesters and 9
bark- and foliage- insectivores required high levels of residual trees of low burn severity, with 10
the feeding guilds showing affinity for different stand composition. In contrast, ground-nesters 11
and omnivores thrived in salvaged areas and associated edges. In addition, cavity-nesting and 12
ground-foragers were associated with severely burned stands. The species’ habitat occupancy 13
patterns were commensurate with trait requirements, which also appeared to be scale-14
dependent. For example, some fire-associated species had high occupancy probability in 15
severely burned stands at small-scale (100m buffer), which was consistent with their cavity-16
nesting trait. This pattern, however, was not evident at large-scale, where their feeding 17
requirement (bark-insectivores) for low-severity burns dominated. Our study suggests that trait-18
habitat relationships can provide critical information to the complex ways species’ relate to key 19
habitat factors following natural and anthropogenic disturbances. 20
Keywords: Bird communities; boreal forest; disturbance; Fourth-corner analysis; post-fire
21
salvaging; RLQ, trait-habitat links 22
1. Introduction
1
The concept of functional trait-environment relationship posits that environmental filters select 2
species, from a regional pool, to a community possessing similar traits that match the selective 3
environment (Simberloff & Dayan, 1991). Deciphering the link between species’ traits and 4
their environment is thought to provide a mechanistic explanation to species’ occupancy and 5
community patterns across local and landscape variables (e.g., Thuiller et al., 2006; Cleary et 6
al., 2007; Dray & Legendre, 2008). Also, by reducing the responses of multiple species to a few 7
functional traits, empirical trait-environment relationships could provide an integrated and 8
concise framework for linking responses of assemblages, regardless of species identity, to 9
environmental changes (Petchey et al 2007, Dray & Legendre, 2008). Such relationships would 10
be particularly valuable in ecosystems subjected to disturbances, which may disrupt aggregate 11
assemblage patterns (e.g., random species co-occurrence patterns of vertebrates following fire, 12
Sara et al., 2006). Yet, if post-disturbance environmental conditions indeed select traits 13
deterministically, then repeated trait-environment links may emerge across assemblages, thus 14
informing about biotic response to disturbances, which may be less evident when considering 15
only species’ identity. Examination of trait-habitat relationships, indeed, has been stressed as 16
one of key research area in the context of fire management and biodiversity conservation in a 17
recent review (Driscoll et al., 2010). 18
The present study examines trait-habitat relationships and habitat occupancy patterns of bird 19
assemblages in boreal forest stands following forest fire and salvage logging. In boreal forest 20
ecosystems, forest fire is recognized as key disturbance agent that shapes landscape and 21
temporal dynamics of fauna and flora (Saab & Powell, 2005; Lindenmayer et al., 2008). 22
Episodic fires generate structural and compositional heterogeneity, which is characterized by 23
large numbers of dead trees and other rare and/or ephemeral habitat resources that are critical to 1
long-term regional persistence, particularly, of fire-associated species (Hutto, 2006; Saab et al., 2
2007b; Kotliar et al., 2007). However, the same critical habitat features and associated species 3
are also being increasingly threatened by post-fire salvage logging, thereby prompting the 4
urgency in developing ecologically based guidelines for sustainable management of burned 5
forests (Hutto, 2006; Lindenmayer et al., 2008). 6
In this context, birds have been the subjects of many studies to understand biotic response to 7
post-fire ecological conditions, including salvage logging (Kotliar et al., 2002; Morissette et 8
al., 2002; Hutto, 2006), because they are considered as good indicators of ecological “integrity” 9
of forest habitats (e.g., Woodpeckers (Piciformes: Picidae), Mikusiński et al., 2001). Despite 10
the availability of extensive information, our understanding of the life-history traits underlying 11
their response patterns remains far from complete (Kotliar et al., 2002). For example, many 12
fire-associated species (e.g., the Black-backed Woodpecker, Picoides arcticus) are known to 13
have strong affinity for severely burned forest stands (e.g., Nappi & Drapeau, 2009); yet, it is 14
not clear whether their affinity for severe burns is primarily for nesting (cavity-nesting), 15
foraging (bark insectivores), or for both activities (e.g., Koivula & Schmiegelow, 2007). 16
Identifying the specific traits linked to burn-severity and other fire-generated habitat 17
attributes is important to understand the biological consequence of salvage-logging and for 18
setting guidelines to minimize their effects (e.g., snag-retention guidelines; Hutto, 2006). For 19
example, a few large trees may be sufficient for nesting (Spiering & Knight, 2005), but not for 20
foraging (Brawn & Balda, 1988). In addition, habitat selection in birds is a multi-scale process, 21
in which nesting and foraging habitat requirements are not selected at the same spatial scales. 22
Given such differences between trait requirements, management focus on single trait-habitat 23
link (e.g., cavity-nesting alone) could be inadequate (Hutto, 2006). Thus, it is important to 1
consider the habitat link of several traits simultaneously. Recently, inferences about trait-2
habitat links in post-fire environments have been done only “indirectly” or a posteriori (e.g., 3
Kotliar et al., 2002; Morissette et al., 2002). 4
We have two major objectives: 1) to determine trait-habitat relationships and identify the 5
differential response of bird species traits (related to nesting, foraging and residence) to forest 6
landscapes characterized by ecological conditions following post-fire salvage-logging; 2) to 7
model species habitat occupancy probabilities and examine how trait-habitat relationships 8
pertain to species occupancy probabilities. Our study sites cover gradients of burn-severity (low 9
to high severity), age structure (20 to 120 years) and tree composition, amount of residual 10
retention (20 -100%), and landscape context of burns (e.g., distance from closest burned forest). 11
These factors all have known effect on bird communities (e.g., Kotliar et al., 2002; Saab et al 12
2007b). We applied two complementary multivariate statistical methods, the fourth-corner 13
(Legendre et al., 1997; Dray & Legendre, 2008) and RLQ analyses (Dolédec et al., 1996) that 14
allow a direct assessment of the link between species traits and habitat attributes by way of 15
species distribution data. While the Fourth-corner analysis performs a detailed test of the 16
significance of each trait and environment combination, the RLQ analysis provides an 17
ordination depicting the generalized trait-habitat relationships. We expected that abundant 18
nesting substrates and greater numbers of insects associated with high amount of residual trees 19
should favor traits characteristic of fire-associated species (e.g., bark-insectivores, cavity-20
nesters) over other traits, e.g., omnivores or shrub nesters. It is also plausible, however, that 21
their cavity-nesting and foraging traits may respond differently to burn severity and amount of 22
residual trees (see above). For example, while severe burns might increase availability of snags 23
for cavity-nesting or generate conducive conditions for ground-feeding species, bark- and 1
foliage-insectivores may respond negatively to such burns. In addition, trait reponses to habitat 2
attributes could be scale dependent, for example, the link of nesting guilds to burn severity may 3
be more prominent at small than at large scale. Because burned forests are potential source 4
populations for fire-associated species (e.g., Nappi & Drapeau, 2009) and their influence is 5
related to age-since-fire (Smucker et al., 2005), we expected that recent burns in the landscape 6
could promote occupancy of fire-associated species on focal burns. Identifying which 7
ecological variable depicted in trait-habitat relationships would also be selected in species 8
habitat occupancy models have valuable conservation implications, particularly when a species 9
possesses traits that have opposite trait-habitat relationships. 10
2. Methods
11
2.1 Study area description
12
The study was conducted in 55 study sites within four forest burns totaling more than 65100 ha 13
(Fig. 1, burned in 2005). The forest burns were located within the western spruce–moss 14
bioclimatic subdomain of northwestern Quebec, Canada (49°15’-50°40’N and 75° 00’W-15
73°45’W). This subdomain is dominated typically by black spruce Picea mariana, with jack 16
pine Pinus banksiana and balsam fir Abies balsamia. The forest landscapes also contain some 17
deciduous trees such as trembling aspen Populus tremuloides and paper birch Betula 18
papyrifera. Due to relatively short fire cycles (120-180 years), landscapes of this ecoregion are
19
dominated by even-aged forest stands (Bergeron et al., 2004). 20
We selected sampling sites using systematic random sampling to represent a gradient of pre-21
fire composition and age structure (20-120 years), post-fire burn severity (low to high severity) 22
and salvage logging intensities (0-80%) observed within the forest burns (Table 1). The sites 23
also incorporated a range of landscape-level habitat contexts, namely distance from previously 1
burned and unburned (green) forest. These habitat variables were selected as they have been 2
shown to differentially influence the community structure and life-history traits (most 3
significantly the foraging and nesting guilds) of bird assemblages in burned forests (see reviews 4
in Kotliar et al., 2002; Saab et al., 2007b). Immediate post-fire environments are typically 5
characterized by abundance of dead and dying trees and associated insect outbreaks; and bark-6
insectivores and cavity-nesters are known to capitalize on such resource availability. Variation 7
in snag size, burn characteristics (severity and heterogeneity) and salvage-logging intensity can 8
affect the availability of these resources and other habitat conditions, whose influence on bird 9
distribution may differ depending on their traits. For instance, increasing burn severity and 10
salvage logging intensity (often targeting larger trees) may decrease available insect prey for 11
bark- and foliage-insectivores. These conditions, however, can create conducive conditions for 12
species that are adapted to open-canopies, such as ground-insectivores and omnivores. Also, the 13
proximity to unburned forest and/or remnants within burn forests associated with riparian areas 14
(which might limit burn severity) could be important habitats for species not adapted to post-15
fire environments (Kotliar et al. 2002). Similarly, the proximity to previous burns (and their 16
time since fire) might increase the flow or colonization of focal burns by species possessing 17
fire-adapted traits (e.g., bark-insectivores). 18
We thus measured the amount of residual tree basal area (by species and size classes), burn 19
characteristics (mean severity and heterogeneity), and edge-length (aquatic and salvage) at 20
stand-level within 100 m and 500 m circular buffers centered on bird survey centre points 21
(Table 1). We characterized residual tree retention using information about age structure, stand 22
composition, and post-fire forest logging intensity (expressed as a percentage) in ecoforest 23
classification maps and a database inventory (Stock data) of basal area (by species and diameter 1
class) (Ministère des Ressources naturelles de la Faune du Québec, MRNFQ). Because pre-2
salvage basal area varied between stands, we focused on the amount of residual retention rather 3
than intensity of salvage logging which was carried between August 2005 and June 2006. We 4
characterized the basal area of young residual (dbh ≤ 9 cm) and merchantable (dbh > 9 cm) 5
trees, which are the main target of post-fire salvage. The stand-level buffers were all included in 6
studied burns, and consequently, most trees were dead, although a few live trees might be found 7
at the 500 m scale (J. Boucher, personal observation). 8
Following Key and Benson (2006), we quantified burn severity using the Difference (delta) 9
Normalized Burn Ratio (dNBR) index. The dNBR was computed from differences between 10
pre- and post-fire in reflectance of bands 4 and 7 (that respond most to burning) of satellite 11
images taken before salvage logging was carried. We computed dNBR values for each pixel 12
(30 m) within the four burns, these ranged from 93 to 1341; thus covering to the whole range 13
of fire severity (low – high) according to Key and Benson (2006). We extracted dNBR values 14
for each pixel within 100 m and 500 m buffer, and considered the mean and standard deviation 15
at respective scales as a measure of burn severity (Brn.Sev) and heterogeneity (Brn.het), 16
respectively. We measured also landscape-level variables, namely the distance of focal burn 17
from the closest burned forest (Dis.BF) and its age (Age.BF) together with isolation from 18
neighboring unburned, green forest (Dis.GF). All habitat variables were extracted using Arc 19
MAP 9.2 (ESRI, 2006). 20
2.2 Bird Sampling
21
Birds were surveyed in 55 stands using the fixed-radius point count method (Hutto et al., 1986) 22
twice in 2006, and three times in 2007 approximately every week from early June to early July. 23
Birds that were heard or seen within a 100 m radius were recorded. To minimize observation 1
overlap and ensure statistical independence, sites were at least 1 km apart. Surveys were 2
conducted during morning hours when field conditions were conducive, i.e., no rain and light 3
winds. To counteract observer (total of four observers) and time biases, we alternated sampling 4
and surveyors order visiting each site (three observers per site). 5
2.3 Data Analysis
6
2.3.1 Trait-habitat relationship
7
We selected a set of four species traits, namely nesting (site location and type), foraging, and 8
migratory behavior (Table 2), that have been shown as proximate mechanisms to explain 9
response patterns of birds to post-fire habitat legacies and salvage logging (e.g., review in Saab 10
et al 2007b; also see section 2.1). These traits also have applicability in formulating post-fire 11
salvage logging management strategies, e.g., nesting requirements of cavity-nesting species has 12
been recognized as one of key component in formulating snag-retention guidelines (Kotliar et 13
al. 2002; Hutto, 2006). We compiled the information of these traits of bird species from Poole 14
(2008). 15
We examined trait-habitat relationships by means of two complementary multivariate 16
analyses: the Fourth-corner (Legendre et al., 1997; Dray & Legendre, 2008) and RLQ analyses 17
(Dolédec et al. 1996). Both methods are three-table analyses that allow a direct assessment of 18
relationships between habitats (Matrix R: habitat by sites) and species traits (Matrix Q: species 19
by traits) by way of species distribution data (Matrix L: Species by sites). The Fourth-corner 20
primarily focuses on tests of the significance of the links between each trait and environment 21
combination in a correlation-type analysis (Legendre et al., 1997). The RLQ analysis proceeds 22
with eigenvalue decomposition of product matrices, thereby providing a common ordination 23
axes of species traits and environment of sites (onto which species and sites are projected, an 1
option not available in the Fourth-corner analysis) and, thus, focuses more on interpretation of 2
their links. 3
In the Fourth-corner analysis the significance of trait-habitat links is tested by a permutation 4
procedure. When a random distribution is assumed, the recommended method is permutation 5
Model 1, which assigns species randomly among sites (Legendre et al., 1997). However, this 6
permutation may result in sites with no species and cause “false” positives, which are not 7
desirable (Legendre et al., 1997). Here we used a slightly modified permutation or null model, 8
whereby species are assigned randomly, but with the constraints that species frequency and 9
richness of sites are maintained, i.e., the fixed-fixed null model. Thus, species niche breadth 10
and site capacities are maintained in the random matrices. For this study, we generated 1000 11
random matrices by a quasi-swap algorithm (Miklós & Podani, 2004) using the function 12
commsimulator in the vegan package (Oksanen et al., 2009) implemented in R (R-Development 13
Team, 2009). We used a routine custom code in R to upload each of the random matrices to the 14
ade4 package for R (Dray & Dufour, 2007) to compute (and store) trait-habitat statistics for 15
each null matrix (Dray & Legendre, 2008; Dray & Dufour, 2007). Results from fixed-fixed null 16
models will be our preference in this paper. 17
We also tested trait-habitat link using the “two-step approach,” which combines results of 18
two permutation models, viz., Model 2 and Model 4, as proposed by Dray & Legendre (2008). 19
The critical value of the “two-step approach” is taken by adjusting for the simultaneous test, 20
i.e., square root of 0.05 (p = 0.24), which, however, could be regarded as too liberal (for details 21
see Dray & Legendre, 2008). In our study, even considering a more conservative level 22
(p < 0.10) indicated a general support for the results obtained by fixed-fixed null model (results 1
presented in Appendix A in the electronic Supplementary material). 2
We performed RLQ analysis (Dolédec et al., 1996) to ordinate the joint structure of the 3
three tables (R, L and Q). RLQ analysis was performed using the ade4 package for R (Dray & 4
Dufour 2007). We conducted two separate RLQ analyses, using habitat variables at 100 m and 5
500 m scales, by also considering landscape-level variables. 6
2.3.2 Species habitat occupancy models
7
Our study focus was to understand how site-specific habitats relate to species traits and species 8
occupancy patterns rather than survey-specific or year specific relationships. Therefore, we 9
pooled the five survey data for each site to construct a single species by site presence/absence 10
matrix of bird occurrences. This pooled data across multiple surveys (over two years) should 11
increase the number of detection (i.e., minimize false absences) of species in each site (see also 12
Toms et al., 2006). We performed multiple logistic regression analysis (Hosmer & Lemeshow, 13
2000) to model the occurrence of each species (presence /absence) at each study site based on 14
habitat predictor variables (Table 1) and then we examined how trait-habitat relationships 15
pertain to these species occupancy probabilities. In all analyses, we considered only species 16
recorded in at least three sites (5% of stations), thereby including 33 bird species (Table 2) that 17
constituted 98% of the total presence-distribution. For three widespread species (Dark-eyed 18
Junco, White-throated Sparrow and Black-backed Woodpecker) that were recorded 95-98% of 19
the sites, fitting logistic model was not informative. Therefore, instead of omitting them 20
altogether, we modelled variation in their abundance pattern by using the maximum number of 21
individuals recorded in each site among the five surveys as “abundance” index. 22
To eliminate model misspecification due to multicollinearity, correlations between variables 1
were examined. There was a strong correlation between basal area of young and merchantable 2
trees; therefore, we used the merchantable residual for black spruce (BSP.M) and balsam fir 3
(BFI.M), while the young for jack pine (JPI.Y) and deciduous trees (DEC.Y). This action 4
minimized the correlations between composition types. Although merchantable trees 5
contributed a greater proportion to basal area retention, young trees had higher density (%). We 6
then built two separate habitat-models for 100 m and 500 m buffers, by also considering 7
landscape-level variables (e.g., distance to the closest burned forest). For each scale, we 8
estimated useful predictor variables using the Akaike Information Criterion (AIC) for best 9
subset model as our selection procedure. We performed analyses using the bestglm-package
10
for R (McLeod & Xu, 2009), which implements the complete enumeration algorithm to 11
examine all possible regression models (Morgan & Tatar 1972). Such an exhaustive search 12
could be ideal for exploratory purposes, and has been shown to yield useful predictor models 13
comparable to alternative modeling approaches (Murtaugh, 2009). Accuracy of the “best” 14
logistic regression model to predict presence or absence was assessed using the area under 15
Receiver Operating Characteristic (ROC) curve, also known AUC (Pearce & Ferrier, 2000). A 16
reasonably accurate model will have an AUC value of at least 0.7, and models with AUC > 0.8 17
are regarded as good ones (Pearce & Ferrier, 2000). Finally, in order to estimate the importance 18
of detection probability as a source of bias in previous analyses (Mackenzie & Royle, 2005), we 19
performed detection analysis using the package unmarked for R (Fiske et al., 2010). More 20
specifically, we used the colonization-extinction model of MacKenzie et al. (2003) [data pooled 21
per primary sampling year or by considering each of the five secondary survey independently] 22
to obtain cumulative detection probability estimates for each species (formula as provided in 1
MacKenzie & Royle, 2005). 2
3 Results
3
3.1 Species trait-habitat relationship
4
We recorded 1481 individuals of 42 bird species during the five surveys across the 55 study 5
sites. In each site, the total number of species detected during the five surveys was between 6 6
and 17 (mean± sd: 10.5 ± 2.5). There was differential association of traits with the amount and 7
composition of residuals (Table 3, Appendix A in the electronic Supplementary material). For 8
example, bark insectivores were positively associated with large amount of black spruce and 9
jack pine, and foliage insectivores with balsam fir and deciduous residuals (Table 3). Canopy 10
nesters had similar patterns as that of bark-insectivores, and both were negatively affected by 11
salvage edge. In contrast, ground and shrub nesters had the opposite relationship. Also, 12
omnivores (and those feeding on vertebrates) were negatively associated with amount of 13
balsam fir and deciduous tree residual basal area (scale of 500 m). There was also a contrasting 14
preference (scale of 500 m) between neotropical migrants that were positively associated to 15
balsam fir and deciduous residuals, and residents and short-distance migrants that preferred 16
black spruce, jack pine or both. 17
Most traits exhibited significant link with burn severity (particularly at the 100 m scale) 18
(Table 3). Foliage- and bark-insectivores, as well as open-cup nesting on canopies had affinity 19
for low burn severity. In contrast, cavity-, ground- and shrub-nesters, as well as ground- 20
foragers (insectivores or vertebrates) were associated with high burn severity. 21
Aquatic edge was positively associated with ground-nesters and Neotropical migrants, and 22
negatively associated with canopy-nesters, bark-insectivores, and residents. 23
At the landscape scale, cavity-nesters, bark-insectivores and residents preferred adjacent 1
burned forests of recent fire (Age.BF). In contrast, ground and open-cup nesters were positively 2
associated with time-since-fire of the neighboring forest, and in fact, preferred green/unburned 3
forests close to focal-burn. Bark and aerial insectivores had negative and positive correlation 4
with distance to burned forest, respectively (Table 3, Appendix A in the electronic 5
Supplementary material). 6
The results from RLQ analysis summarized the aforementioned trait-habitat relationships 7
(Table 4, Fig. 2). For both examined scales, the first three RLQ axes extracted 87.8 % (100 m 8
scale) and 91.7% (500-m scale) of the covariation between species traits and habitat attributes 9
(Table 4, Fig. 2 a,b). The first RLQ axis correlated positively with amount of black spruce and 10
jack pine, canopy nesters, bark-insectivores and residents, but negatively with salvage edge, 11
shrub nesters, ground nesters, and omnivores. On the second axis, the most prominent trends 12
were positive scores for balsam-fir and deciduous trees (500 m), foliage insectivores, and 13
Neotropical migrants. Burn severity and isolation from green forest, cavity nesters, and 14
vertebrate-feeders were arrayed in the opposite direction along same axis. 15
Some apparent trait-habitat relationships in the RLQ analysis were non-significant 16
according to the Fourth-corner analysis. For example, in the RLQ ordination (100 m scale), 17
both burn heterogeneity (Brn.het) and balsam fir had similar scores, and the trait foliage 18
insectivore appeared to fall on same axis (Fig. 2a). Yet, only balsam fir had a significant link to 19
foliage insectivores according to Fourth-corner (Table 3). Similarly, the apparent relationships 20
of aerial insectivores and omnivores to burn severity in RLQ (500 m scale) were not significant 21
in the Fourth-corner analysis. However, RLQ distinguished which specific habitat (among 22
correlated habitat factors) could be more related to a given trait. For example, Fourth-corner 23
analysis indicated that ground nesters were associated positively with burn severity and aquatic 1
edge (100m scale, Table 3). Although RLQ supported both relationships (axis 1, Fig. 2a), 2
ground nesters were related mainly to aquatic edge-length (axis 2, Fig. 2a). 3
3.2 Species habitat occupancy models
4
We developed reasonably accurate (internal validation) habitat-occupancy models (AUC > 0.7) 5
for 25 (83 %) species (Table 5, Appendix B in the electronic Supplementary material). In 6
addition, ‘abundance’ models for three widespread species (Dark-eyed Junco, White-throated 7
Sparrow and Black-backed Woodpecker) explained 10-38 % of their abundance variation. The 8
habitat-occupancy models were in good concordance with trait-habitat relationships, 9
particularly when different traits of a species had similar associations with a given habitat. For 10
example, low occupancy probability with salvage edge was shown for Black-backed 11
Woodpecker, American Three-toed Woodpecker, Red-breasted Nuthatch, and Brown Creeper 12
(Table 5); these species posses trait-combinations (canopy-nesting, bark insectivores and 13
resident; Table 3 and Fig. 2) that were negatively associated with salvage edge. Similarly, 14
species such as Ruby-crowned Kinglet and Yellow-rumped Warbler were less likely to occupy 15
severely burned stands, as would be expected from their traits (foliage insectivores, open-cup 16
nesters, in canopy). Occupancy models for most ground nesters, such as White-throated 17
Sparrow, Lincoln Sparrow, Northern Waterthrush, and Wilson’s Warbler, indicated positive 18
relationships with aquatic edge, as also shown by the Fourth-corner analysis (500 m scale). 19
Habitat occupancy models also indicated which of the opposing trait-habitat relationships 20
were important for occupancy. High occupancy probabilities of species such as Black-backed 21
Woodpecker, Tree Swallow, and Eastern Bluebird in severe burns (100 m, Table 5) were in 22
concordance to their cavity-nesting trait rather than to being canopy nesters (Table 3). The latter 23
relationship could be due to open-cup nesters, with which they share the canopy nesting trait. 1
Some species having the same trait responded differently to the same variable. Both Lincoln 2
Sparrow and Common Nighthawk are open-cup, ground nesters, but they responded negatively 3
and positively, respectively, to burn severity. Note that the open-cup (type) and ground-nesting 4
(location) traits had contrasting link to burn severity. Some habitat occupancy relationships 5
could not be explained by trait-habitat relationships (e.g., Northern flicker and Red-breasted 6
nuthatch had negative coefficient with balsam fir, BAF.C) or were opposite to that trait-habitat 7
relationship (e.g., White-throated Sparrow with deciduous trees, DEC.Y). 8
Our analysis using the colonization-extinction model [data pooled per primary sampling 9
year or by considering each of the five secondary survey independently] indicated that the 10
cumulative detection probability estimates for most species were fairly good (0.74-1.00, mean 11
0.94). However, the estimated cumulative detection probability was relatively low (0.15-0.64) 12
for six species (Magnolia Warbler, Wilson's Warbler, Least Flycatcher, White-winged 13
Crossbill, Common Yellowthroat and Hairy Woodpecker, Scientific names in Table 2). 14
15
4. Discussion
16
We addressed the differential response of bird functional traits to post-fire habitat conditions 17
and salvage-logging and their bearing to species habitat occupancy probabilities. Regardless of 18
whether or not salvaging was affecting merchantable or young trees, higher amount of residual 19
tree basal area was important for canopy-nesters, and foliage- and bark-insectivores than guilds 20
such as omnivores, ground- and shrub-nesters, that seem to thrive better in salvaged areas and 21
associated edges. Moreover, we found differential response to tree composition between foliage 22
insectivores (e.g. for balsam fir) and bark insectivores (e.g. for black spruce). These findings 23
were consistent with studies showing guild response to levels of salvaging or the amount of 1
residuals (e.g., Morissette et al., 2002) and its composition (Koivula & Schmiegelow, 2007). 2
Degree of burn severity is an important habitat attribute in post-fire disturbance, especially 3
for fire-associated species (Smucker et al., 2005). Our results suggest that bark-insectivores 4
(also foliage insectivores) preferred low- to moderate-severity burns (Kotliar et al., 2002; 5
Smucker et al., 2005), where there is probably greater insect availability than in severe burns 6
(Nappi et al., 2003; Smucker et al. 2005). Thus, we found no support for suggestions that strong 7
affinity of fire-associated species with severe-burns was for foraging (e.g., Koivula & 8
Schmiegelow, 2007). Our finding rather suggests that their affinity for severe-burns could be 9
related to being nesters, perhaps a condition particularly important for secondary cavity-10
nesters. Also, in notable contrast to foraging (see above), the amount of residual basal area was 11
less critical for cavity-nesting (also see, Spiering & Knight, 2005). Our results add support to 12
the finding highlighted in the synthesis by Kotliar et al. (2002) that fire-associated species 13
might have a contrasting preference for foraging and nesting. Species may meet such 14
contrasting resource requirement, for example, by using alternative habitats in the landscape 15
(i.e., habitat complementation, sensu Dunning et al. 1992). 16
Severe burns, however, enhanced the foraging conditions for ground feeders (insectivores or 17
for other prey), perhaps by exposing insects or seeds or by increasing availability of deadwood-18
associated insects (e.g., Northern Flicker, Koivula & Schmiegelow, 2007). Also, ‘vegetation’ 19
remnants along aquatic edges within severe burns appear to be conducive for ground and shrub 20
nesters (Fig. 2a,b). Such remnants could form important habitats also for species that would 21
otherwise avoid severe burns, such as the Lincoln Sparrow and Northern Waterthrush (Table 5). 22
It is noteworthy that nesting guilds’ positive (e.g., ground nesters) and negative (open-cup, 23
canopy nesters) associations with burn severity were particularly evident at a smaller scale 1
(100 m buffer), perhaps closer to the nest-site selection scale by birds, than at the larger scale 2
(500 m buffer). Taken together, our findings suggest that mosaics of severely burned and 3
unburned remnants in focal burned forests could yield habitat attributes attuned to the different 4
requirements of bird traits (Saab et al., 2007a). 5
Moreover, we found that some traits also responded to the landscape context of burned 6
forests. More specifically, cavity-nesting, bark insectivores and residents (typical of fire-7
associated species) occupied focal burns adjacent to burned forests (landscape) of recent rather 8
than old fires. Early post-fire environments are characterized by abundant nesting substrates 9
and greater insect availability (Nappi et al., 2003); this may increase breeding success of fire-10
associated species in focal burns, which in turn, may act as source populations at a regional 11
scale (e.g., Black-backed Woodpecker, Nappi & Drapeau, 2009). Our results support this 12
notion of regional dynamics (for insular systems, see Azeria et al., 2006) by illustrating that 13
early post-fire forests at a landscape scale may provide potential colonizers for focal burns (also 14
in occupancy models), similar to what has been demonstrated also in post-fire colonization 15
pattern of birds in Mediterranean landscapes (Brotons et al., 2005). 16
The birds’ habitat-occupancy probabilities were consistent with known ecology of the 17
species and, more importantly, with the trait-habitat relationships revealed in this study, thus, 18
providing a mechanistic explanation for species habitat occupancy patterns. The interpretation 19
is more straightforward when a significant number of traits for a given species have similar 20
associations with habitat factors. For example, the foraging and nesting traits could have 21
simultaneously determined the lower probability of Black-backed Woodpecker with increased 22
salvage edge, of Yellow-rumped warbler with severe burns or higher occupancy probability of 1
Northern Waterthrush with aquatic edge (see also Table 5). 2
However, there were several exceptions, perhaps more crucial findings, where a species 3
might have traits that exhibit simultaneous and contrasting associations with a given habitat 4
attribute. For example, some cavity nesters (e.g., Tree swallow, Table 5) were more likely to 5
occupy severe burns at least at fine-scale (100 m) in concordance to nest type (cavity-nesting) 6
than to location (canopy) or foraging (some were bark-insectivores) depiction of trait-habitat 7
relationship. This relationship of the cavity-nesters with burn severity, however, was not 8
evident at 500 m scale; which suggests scale-specific influence of traits on species’ habitat-9
occupancy. Also the heterogeneity of species that are categorized into constraining 10
classifications might cause such divergent relationships, e.g., cavity-nesters share the canopy 11
nesting trait with open-cup nesters that had a negative association with burn severity. There 12
were also cases where habitat occupancy patterns could not be explained or were opposite to 13
those depicted by trait-habitat relationships. For example, Northern flickers were less likely to 14
occupy stands containing balsam fir (BAF.C) (also see Koivula & Schmiegelow, 2007); 15
however, this relationship was not evident in its trait-habitat relationship. This lack of 16
concordance may reflect flexibility of trait responses, interdependence of traits, or a mismatch 17
of responses that is imposed by the environmental stochasticity caused by fire and salvaging. In 18
addition, there were some subtle differences in results from Fourth-corner and RLQ analyses, 19
which may reflect more of their complementary in establishing trait-habitat links. For instance, 20
while the Fourth-corner revealed the significance of the trait links to each of the habitats, albeit 21
weak and correlated they are, the RLQ ordination could help to visualize which of the 22
correlated habitats can have the strongest contribution to their cumulative effect on the specific 23
trait response. Regardless of these exceptions, trait-habitat relationships allowed significant and 1
ecological meaningful mechanistic inferences about underlying species responses to habitat 2
conditions. Furthermore, the value of such integrated and concise information regarding 3
relationships between traits of communities and environment can not be underestimated, given 4
that disturbance by fire can disrupt taxonomic-level community patterns; for example, fire 5
disrupts the co-occurrence patterns of species (Sara et al., 2006), a situation that was evident 6
also in our study (unpublished results). Indeed, the concept of functional trait-environment 7
relationship is increasingly being emphasized in understanding varied response of ecological 8
communities in other disturbance agents such as those caused by forest fragmentation and 9
logging (e.g., Hausner et al., 2003; Cleary et al., 2007; Barbaro & van Halder 2009). 10
As most of our plots were within burned and salvaged forests, they were less likely to be 11
obstructed by vegetation, which probably contributed to generally high detection probabilities 12
of most sampled bird species. Thus, we did not consider that overall detection issues are likely 13
to have significant effects for most species on trait-habitat relationships presented, or on habitat 14
occupancy models. The low detection estimation obtained for six species can be, however, due 15
to the species being genuinely rare and/or vagrant rather than the species being elusive. For 16
example, the Magnolia Warbler is primarily associated with mature forests and may have low 17
occupancy within burned forests. The White-winged Crossbill tend to flock, and is usually 18
easily detected when present. Thus, low detection for such species can not be attributed simply 19
due to sampling artifacts. 20
Our findings emphasize that management guidelines such as those directed towards snag-21
retention should be comprehensive and pay due attention to the requirements of multiple traits 22
(Hutto, 2006). For example, cavity-nesting (a frequently targeted trait) was positively linked to 23
severe burns, but it showed no association with the amount of residual trees. Snag retention 1
recommendations based only on such a notion, e.g., leaving aside a few severely burned trees, 2
could be simplistic and dangerous. In fact, our study indicated that cavity nesters, which were 3
also bark-insectivores (5 of 12 cavity-nesting species in our study), would require abundant and 4
less-severely burned trees for foraging. Also, the greater importance of recent burned forests 5
and lesser importance of old burned forests in the landscape for focal burns suggest that 6
delaying salvage logging may be crucial for maintaining productivity pulses in fire-associated 7
bird species (Nappi & Drapeau, 2009), although this would inevitably decrease the economic 8
value of the trees (Sessions et al., 2004). The trait-habitat relationships, thus, could provide an 9
integrated framework to understand the complex responses of biological communities to post-10
fire and salvage conditions and, consequently, could provide critical information in formulating 11
sound management actions to alleviate the impact of salvage logging. 12
13
Acknowledgements
14
We thank Chantiers Chibougamau Ltée and Barrette Chapais Ltée for logistical support and C. 15
Buidin, M. Huot, Y. Rochepault, and A. Sanfaçon, for their help in the field. This study was 16
supported by the Fonds de recherche sur la nature et les technologies (FQRNT), the Ministère 17
des Ressources naturelles et de la Faune du Québec (MRNFQ), Environment Canada, and the
18
programme de recherche en partenariat sur l’aménagement et l’environnement forestiers-II.
19
We are indebted to two anonymous reviewers for their valuable comments. We also thank 20
W.F.J. Parsons for revising the English. 21
References
1
Azeria, E.T., Carlson, A., Pärt T., Wiklund, C.G. 2006. Temporal dynamics and nestedness of 2
an oceanic island bird fauna. Glob. Ecol. Biogeogr. 15, 328–338. 3
Barbaro, L., van Halder, I., 2009. Linking bird, carabid beetle and butterfly life-history traits to 4
habitat fragmentation in mosaic landscapes. Ecography 32, 321-333. 5
Bergeron, Y., Gauthier, S., Flannigan, M., Kafka, V. 2004. Fire regimes at the transition 6
between mixedwood and coniferous boreal forest in northwestern Quebec. Ecology 85, 1916– 7
1932. 8
Brawn, J., Balda, R., 1988. Population biology of cavity nesters in northern Arizona: do nest 9
sites limit breeding densities? The Condor 90, 61–71. 10
Brotons, L., Pons, P., Herrando, S., 2005. Colonization of dynamic Mediterranean landscapes: 11
where do birds come from after fire? J. Biogeogr.32, 789-798. 12
Cleary, D., Boyle, T., Setyawati, T., Anggraeni, C., Loon, E., Menken, S., 2007. Bird species 13
and traits associated with logged and unlogged forest in Borneo. Ecol. Appl. 17, 1184–1197. 14
Fiske, I., Chandler, R., Royle, A., 2010. unmarked: Models for data from Unmarked Animals. 15
R package Version 0.8-8 http://cran.r-project.org/web/packages/unmarked/index.html. 16
Accessed on 2010–12-15 17
Dolédec, S., Chessel, D., ter Braak, C., Champely, S., 1996. Matching species traits to 18
environmental variables: a new three-table ordination method. Envir. Ecol. Stat. 3, 143–166. 19
Dray, S., Dufour, A. 2007. The ade4 package: Implementing the duality diagram for ecologists. 20
J. of Statistical Software 22, 1–20. 21
Dray, S., Legendre, P. 2008. Testing the species traits-environment relationships: the fourth-22
corner problem revisited. Ecology 89, 3400–3412. 23
Driscoll, D., Lindenmayer, D., Bennett, A., Bode, M., Bradstock, R., Cary, G., Clarke, M., 24
Dexter, N., Fensham, R., Friend, G., 2010. Fire management for biodiversity conservation: 25
Key research questions and our capacity to answer them. Biol Conserv. 143,1928–1939. 26
Dunning, J.B., Danielson, B.J., Pulliam, H.R., 1992. Ecological processes that affect 27
populations in complex landscapes. Oikos 65, 169–175. 28
ESRI 2006. ArcMAP 9.2. Environmental Systems Research Institute, Redlands, CA, USA. 29
Hausner, V.H., Yoccoz, N.G., Ims R.A., 2003. Selecting indicator traits for monitoring land use 30
impacts: birds in northern coastal birch forests. Ecol. Appl. 13, 999-1012. 31
Hosmer, D.W. , Lemeshow, S. (2000). Applied logistic regression (2nd ed.) Wiley-Interscience, 1
New York. 2
Hutto, R.L., Pletschet, S., Hendricks, P., 1986. A fixed-radius point count method for 3
nonbreeding and breeding season use. The Auk 103, 593–602. 4
Hutto, R.L., 2006. Toward meaningful snag-management guidelines for postfire salvage 5
logging in North American conifer forests. Conserv. Biol. 20, 984–993. 6
Key, C., Benson, N., 2006. Landscape assessment (LA): Sampling and analysis methods. 7
USDA Forest Service Gen. Tech. Rep. RMRS-GTR-164-CD. 8
Koivula, M.J., Schmiegelow, F.K.A., 2007. Boreal woodpecker assemblages in recently burned 9
forested landscapes in Alberta, Canada: Effects of post-fire harvesting and burn severity. For. 10
Ecol. Mgmt. 242, 606–618. 11
Kotliar, N.B., Hejl, S.J., Hutto, R.L., Saab, V.A., Melcher, C.P., McFadzen, M.E., 2002. Effects 12
of fire and post-fire salvage logging on avian communities in conifer-dominated forests of the 13
western United States. Stud. Avian Biol. 25, 49–64. 14
Kotliar, N.B., Kennedy, P.L., Ferree, K., 2007. Avifaunal responses to fire in southwestern 15
montane forests along a burn severity gradient. Ecol. Appl. 17, 491–507. 16
Legendre, P., Galzin, R., Harmelin-Vivien, M., 1997. Relating behavior to habitat: Solutions to 17
the fourth-corner problem. Ecology 78, 547–562. 18
Lindenmayer D., Burton P.J. & Franklin J.F. (2008). Salvage logging and its ecological 19
consequences. Island Press, Washington, DC.
20
MacKenzie, D. I., J. D. Nichols, J. E. Hines, M. G. Knutson, and A. B. Franklin. 2003. 21
Estimating site occupancy, colonization, and local extinction when a species is detected 22
imperfectly. Ecology 84, 2200–2207. 23
MacKenzie, D., Royle, J.A., 2005. Designing occupancy studies: general advice and allocating 24
survey effort. J. Appl. Ecol. 42, 1105–1114 25
McLeod, A.I., Xu, C. 2009. bestglm: Best Subset GLM. R package Version 0.20 http://cran.r-26
project.org/web/packages/bestglm/index.html. Accessed on 2010–01-13 27
Miklós, I., Podani, J. 2004. Randomization of presence-absence matrices: comments and new 28
algorithms. Ecology 85, 86–92. 29
Morgan, J., Tatar, J. 1972. Calculation of the residual sum of squares for all possible 30
regressions. Technometrics 14, 317–325. 31
Morissette J.L., Cobb T.P., Brigham R.M., James P.C. 2002. The response of boreal forest 1
songbird communities to fire and post-fire harvesting. Can. J. For. Res. 32, 2169–2183. 2
Murtaugh, P.A. 2009. Performance of several variable-selection methods applied to real 3
ecological data. Ecol. Lett. 12, 1061–1068. 4
Mikusiński, G., Gromadzki, M., Chylarecki, P., 2001. Woodpeckers as indicators of forest bird 5
diversity. Conserv. Biol. 15, 208–217. 6
Nappi, A. & Drapeau, P. 2009. Reproductive success of the black-backed woodpecker 7
(Picoides arcticus) in burned boreal forests: Are burns source habitats? Biol. Conserv. 142, 8
1381–1391. 9
Nappi, A., Drapeau, P., Giroux, J.-F., Savard, J.-P.L. 2003. Snag use by foraging Black-backed 10
Woodpeckers (Picoides arcticus) in a recently burned eastern boreal forest. The Auk 120, 11
505–511. 12
Oksanen, J., Kindt, R., Legendre, P., O’Hara, B., Stevens, M., Oksanen, M., 2009. vegan: 13
Community Ecology Package. http://CRAN.R-project.org/package/vegan. (accessed 12 14
December 2009). 15
Pearce, J., Ferrier, S. 2000. Evaluating the predictive performance of habitat models developed 16
using logistic regression. Ecol. Model. 133, 225–245. 17
Petchey O.L., Evans K.L., Fishburn I.S., Gaston K.J., 2007. Low functional diversity and no 18
redundancy in British avian assemblages. J. Anim. Ecol. 76, 977–985 19
Poole, A (2008). The birds of North America online. In: Poole, A. (ed.) Cornell Laboratory of 20
Ornithology, Ithaca, NY. 21
R-Development Team (2009). R: A language and environment for statistical computing. R 22
Foundation for Statistical Computing Vienna. http://CRAN.R-project.org (accessed 12 23
December 2009). 24
Saab, V.A., Powell, H.D.W. 2005. Fire and avian ecology in North America: Process 25
influencing pattern. Stud. Avian Biol. 30, 1–13. 26
Saab, V.A., Russell, R.E., Dudley, J.G., 2007a. Nest densities of cavity-nesting birds in relation 27
to postfire salvage logging and time since wildfire. Condor 109, 97–108. 28
Saab, V.A, Block, W., Russell, R., Lehmkuhl, J., Bate, L. & White, R. (2007b). Birds and 29
burns of the interior West. US Department of Agriculture, Forest Service, General Technical
30
Report PNW-GTR-712, Pacific Northwest Research Station, Portland, Oregon. 31
Sara, M., Bellia, E., Milazzo, A., 2006. Fire disturbance disrupts co-occurrence patterns of 1
terrestrial vertebrates in Mediterranean woodlands. J. Biogeogr. 33, 843-852. 2
Sessions, J., Bettinger, P., Buckman, R., Newton, M., Hamann, J., 2004. Hastening the return of 3
complex forests following fire – the consequences of delay. J. For. 102, 38–45. 4
Simberloff, D., Dayan, T., 1991. The guild concept and the structure of ecological 5
communities. Ann. Rev. Ecol. Syst. 22, 115–143. 6
Smucker, K.M., Hutto, R.L., Steele, B.M., 2005. Changes in bird abundance after wildfire: 7
Importance of fire severity and time since fire. Ecol. Appl. 15, 1535–1549. 8
Spiering, D., Knight, R., 2005. Snag density and use by cavity-nesting birds in managed stands 9
of the Black Hills National Forest. For. Ecol. Mgmt. 214, 40–52. 10
Thuiller, W., Richardson, D., Rouget, M., Proches, S., Wilson, J., 2006. Interactions between 11
environment, species traits, and human uses describe patterns of plant invasions. Ecology 87, 12
1755–1769. 13
Toms, J.D., Schmiegelow, F.K.A., Hannon, S.J., Villard, M.-A. 2006. Are point counts of 14
boreal songbirds reliable proxies for more intensive abundance estimators? Auk 123,438–454. 15
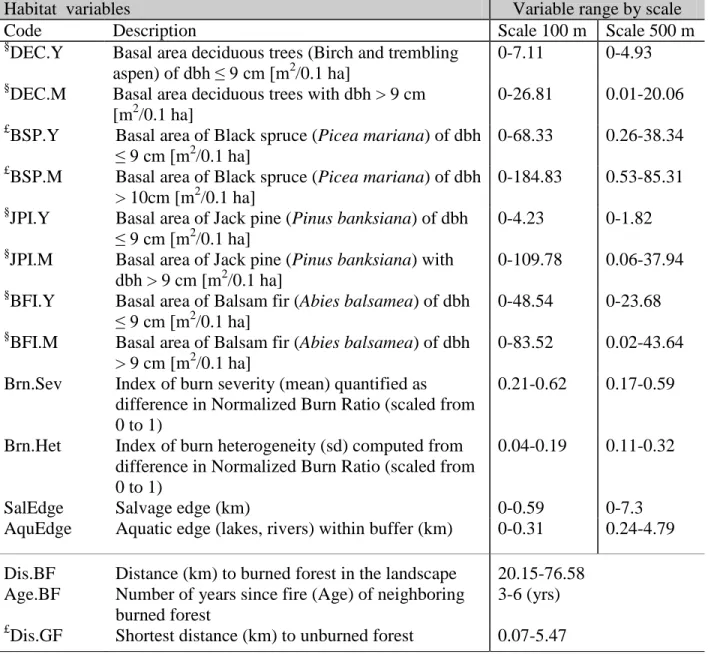
Table 1 Code, description and range of habitat variables measured at two scales (100 m and
500 m buffer) from the centre of bird census station. Variables indicated by £ and § were square-root and double square-root transformed, respectively, in the species trait-habitat and species habitat occupancy analyses. Dbh stands for tree diameter at breast height.
Habitat variables Variable range by scale
Code Description Scale 100 m Scale 500 m
§
DEC.Y Basal area deciduous trees (Birch and trembling aspen) of dbh ≤ 9 cm [m2/0.1 ha]
0-7.11 0-4.93 §
DEC.M Basal area deciduous trees with dbh > 9 cm [m2/0.1 ha]
0-26.81 0.01-20.06 £
BSP.Y Basal area of Black spruce (Picea mariana) of dbh ≤ 9 cm [m2
/0.1 ha]
0-68.33 0.26-38.34 £
BSP.M Basal area of Black spruce (Picea mariana) of dbh > 10cm [m2/0.1 ha]
0-184.83 0.53-85.31 §
JPI.Y Basal area of Jack pine (Pinus banksiana) of dbh ≤ 9 cm [m2
/0.1 ha]
0-4.23 0-1.82 §
JPI.M Basal area of Jack pine (Pinus banksiana) with dbh > 9 cm [m2/0.1 ha]
0-109.78 0.06-37.94 §
BFI.Y Basal area of Balsam fir (Abies balsamea) of dbh ≤ 9 cm [m2
/0.1 ha]
0-48.54 0-23.68 §
BFI.M Basal area of Balsam fir (Abies balsamea) of dbh > 9 cm [m2/0.1 ha]
0-83.52 0.02-43.64 Brn.Sev Index of burn severity (mean) quantified as
difference in Normalized Burn Ratio (scaled from 0 to 1)
0.21-0.62 0.17-0.59
Brn.Het Index of burn heterogeneity (sd) computed from difference in Normalized Burn Ratio (scaled from 0 to 1)
0.04-0.19 0.11-0.32
SalEdge Salvage edge (km) 0-0.59 0-7.3
AquEdge Aquatic edge (lakes, rivers) within buffer (km) 0-0.31 0.24-4.79 Dis.BF Distance (km) to burned forest in the landscape 20.15-76.58
Age.BF Number of years since fire (Age) of neighboring burned forest
3-6 (yrs) £
Table 2 Bird species percentage of occurrence (Frequency in %) and their respective traits used
to examine trait-habitat relationships.
Life history attributes Code Common name Latin name Frequency Forage
Nest Location
Nest
Type Migration DEJU Dark-eyed Junco Junco hyemalis 98.2 OM GN OC SDM WTSP White-throated Sparrow Zonotrichia albicollis 96.4 OM GN OC SDM BBWO Black-backed Woodpecker Picoides arcticus 94.5 BI CN CV RES HETH Hermit Thrush Catharus guttatus 70.9 OM GN OC SDM AMRO American Robin Turdus migratorius 69.1 OM CN OC SDM TRES Tree Swallow Tachycineta bicolor 63.6 AI CN CV SDM WIWR Winter Wren Troglodytes troglodytes 45.5 GI CN CV SDM RCKI Ruby-crowned Kinglet Regulus calendula 43.6 FI CN OC NEO EABL Eastern Bluebird Sialia sialis 41.8 GI CN CV SDM YRWA Yellow-rumped Warbler Dendroica coronata 41.8 FI CN OC SDM LISP Lincoln's Sparrow Melospiza lincolnii 40 OM GN OC NEO CEDW Cedar Waxwing Bombycilla cedrorum 34.5 OM CN OC SDM NOFL Northern Flicker Colaptes auratus 27.3 GI CN CV SDM COYE Common Yellowthroat Geothlypis trichas 25.5 FI GN OC NEO TTWO Three-toed Woodpecker Picoides tridactylus 25.5 BI CN CV RES BRCR Brown Creeper Certhia americana 21.8 BI CN CV SDM MOWA Mourning Warbler Oporornis philadelphia 21.8 FI GN OC NEO WWCR White-winged Crossbill Loxia leucoptera 20 SF CN OC SDM ALFL Alder Flycatcher Empidonax alnorum 16.4 AI SN OC NEO NAWA Nashville Warbler Vermivora ruficapilla 14.5 FI GN OC NEO NOWA Northern Waterthrush Seiurus noveboracensis 14.5 GI GN CV NEO RBNU Red-breasted Nuthatch Sitta canadensis 14.5 BI CN CV RES SWTH Swainson's Thrush Catharus ustulatus 12.7 FI SN OC NEO OSFL Olive-sided Flycatcher Contopus borealis 10.9 AI CN OC NEO NOHO Northern Hawk Owl Surnia ulula 9.1 GV CN CV RES RUBL Rusty Blackbird Euphagus carolinus 9.1 OM SN OC SDM BEKI Belted Kingfisher Megaceryle alcyon 7.3 GV GN CV SDM CONI Common Nighthawk Chordeiles minor 7.3 AI GN OC NEO MAWA Magnolia Warbler Dendroica magnolia 7.3 FI SN OC NEO WIWA Wilson's Warbler Wilsonia pusilla 7.3 FI GN OC NEO COGR Common Grackle Quiscalus quiscula 5.5 OM CN OC SDM HAWO Hairy Woodpecker Picoides villosus 5.5 BI CN CV RES LEFL Least Flycatcher Empidonax minimus 5.5 AI CN OC NEO Codes for bird species traits are as follows. Nest location: CN = Canopy/trees; GN = Ground; SN = Shrubs. Nest type: CV = cavity nester; OC = Open-Cup. Foraging strategy: AI = Aerial Insectivore; BI = Bark insectivore; FI = Foliage Insectivore; GI = Ground insectivore; GV = Vertebrates; SF = Seeds/fruits; OM = Omnivore. Note that the OM feeding guild may feed exclusively on insects during breeding season, and include fruits and seeds during
non-breeding. No analysis was carried for SF, which had only a single species. Migration strategy: RES= permanent resident; SDM= short distance migrant; NEO= Neotropical/long distance migrant.
Table 3 Relationships between traits (columns) and habitats (rows) according to Fourth-corner
analysis. The “+”and “–” signs indicate, respectively, positive and negative trait-habitat links that are significant (P < 0.05) according to fixed-fixed null model tests. Details of statistics provided in Appendix A in the electronic Supplementary material. Codes for habitats and species-traits are shown in Tables 1 and 2, respectively.
5
Habitats
Nesting location and type Foraging guilds Migration status
GN SN CN CV OC GI FI BI AI OM GV RES SDM NEO S ta nd s cal e 1 0 0 m DEC.Y . . . – . . . . DEC.M . . + . . . + + . – . . . . BSP.Y – . + . . . + . . . – . . . BSP.M – . + . . . – . . . . JPI.Y . . + . . . + . . . + . JPI.M – . + . . . . + . . – . . . BFI.Y . . . + . . – . . . . BFI.M . . . + . . – . . . . Brn.Sev + + – + – + – – . . + . . . Brn.Het . . . – . . . . SalEdge + + – . . . . – . . . – . . AquEdge + . – . . . . – . . + – . + S ta nd s cal e 500 m DEC.Y . . . + . . – . . . + DEC.M . . . + + . – . . . . BSP.Y – – + . . . . + . . . . BSP.M – . + . . . . + . . . + . – JPI.Y – . + . . . . JPI.M – – + . . . . + . . . – BFI.Y . . . – . . + . . – . . – + BFI.M . . . + . . – . . – + Brn.Sev . . . + . + – . . . + . . . Brn.Het . . . . SalEdge . + – . . . . – . . . . AquEdge + . – . . . . – . . . – . + L an d scap e Dis.BF . . . – + . . . . . Age.BF + . – – + . . – . . . – . . Dis.GF – . . + . . . + . . .
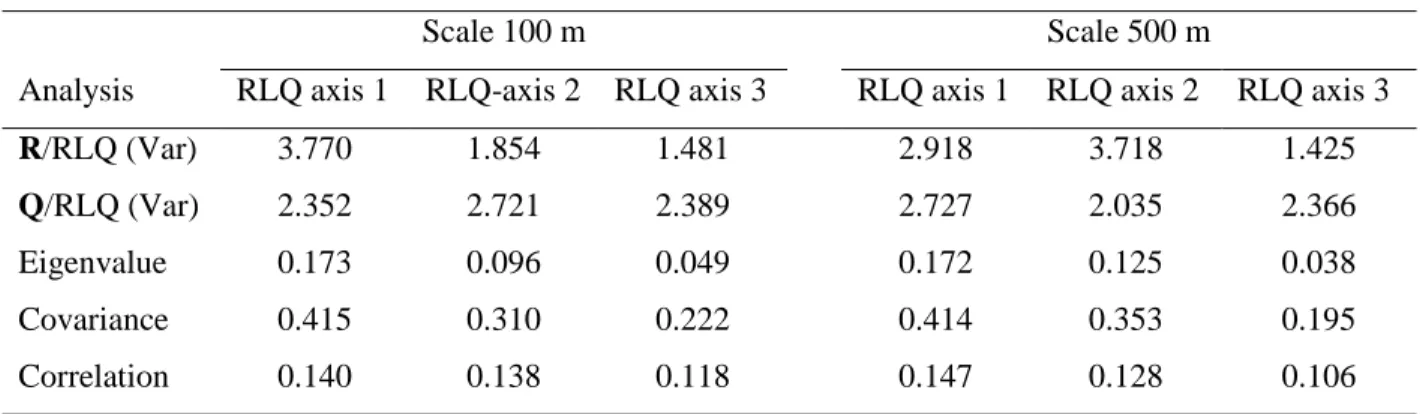
Table 4 Results of RLQ analyses and comparison with the separate ordination analyses (R, L and Q
alone) at two spatial scales.
A) RLQ analysis
Scale 100 m Scale 500 m
Analysis RLQ axis 1 RLQ-axis 2 RLQ axis 3 RLQ axis 1 RLQ axis 2 RLQ axis 3
R/RLQ (Var) 3.770 1.854 1.481 2.918 3.718 1.425
Q/RLQ (Var) 2.352 2.721 2.389 2.727 2.035 2.366
Eigenvalue 0.173 0.096 0.049 0.172 0.125 0.038
Covariance 0.415 0.310 0.222 0.414 0.353 0.195
Correlation 0.140 0.138 0.118 0.147 0.128 0.106
B) RLQ summary (Explained variance in %)
Scale 100 m Scale 500 m
Analysis RLQ axis 1 RLQ axis 2 RLQ axis 3 RLQ axis 1 RLQ axis 2 RLQ axis 3
R/RLQ 74.2 75.0 77.3 64.6 88.2 83.7
L/RLQ 31.7 33.1 31.0 33.4 30.8 27.9
Q/RLQ 52.2 74.2 83.9 60.6 69.7 80.1
Inertia (trace) 47.7 26.5 13.6 47.1 34.2 10.4
Notes: In Panel (A), the R/RLQ (Var) and Q/RLQ (Var) are the variances of habitat variables and species traits, 10
respectively, that were computed for the first three RLQ axes, as well as the covariance and correlation between them resulting from the RLQ analysis. The RLQ summary in Panel (B) shows the percentage each RLQ axis accounts for the variance of the habitat attributes (R/RLQ), species composition (L/RLQ) and species-trait (Q/RLQ) tables when they were analysed separately (not shown). For instance, the first axis in the RLQ analysis at 100 m scale accounted for 74.2% (R/RLQ) of the variance obtained in the first axis by the separate correspondence analysis of the habitat attributes (R-15
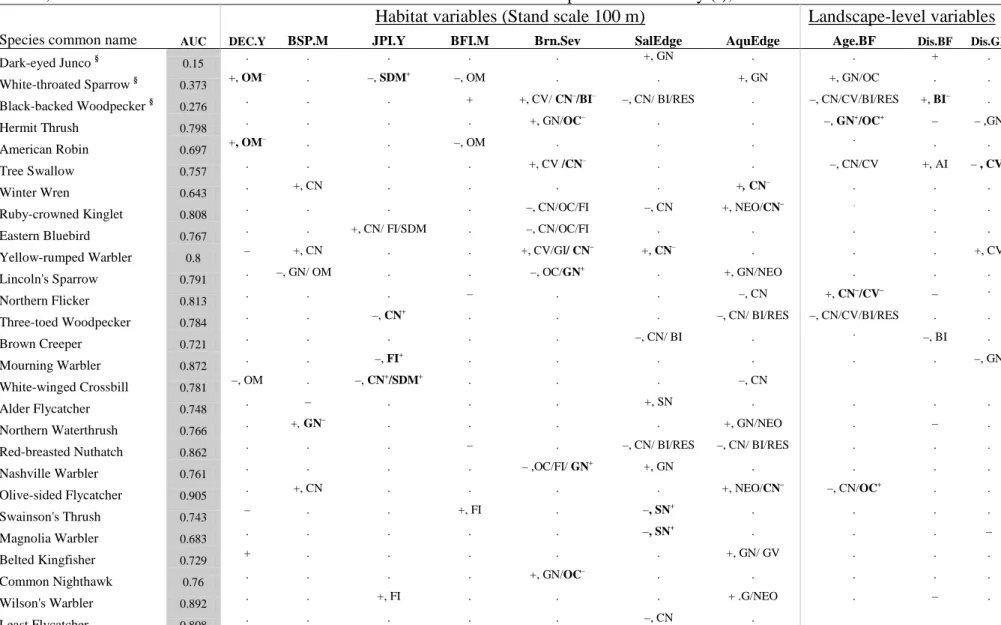
Table 5 The direction (–: negative; +: positive) of habitat variable influence on species occupancy probability (model details in
Appendix B) and the respective species traits linked similarly (unless indicated otherwise) to that variable according to Fourth-corner analysis (Table 3, and Appendix A in the electronic Supplementary material). Code for traits and species (in Notes) are provided in Table 2, and for habitats are as in Table 1. AUC = Area under ROC curve. For species indicated by (§), “abundance” model were fitted. 20
Habitat variables (Stand scale 100 m) Landscape-level variables Species common name AUC DEC.Y BSP.M JPI.Y BFI.M Brn.Sev SalEdge AquEdge Age.BF Dis.BF Dis.GF
Dark-eyed Junco § 0.15 . . . +, GN . . + .
White-throated Sparrow §
0.373 +, OM
– . –, SDM+ –, OM . . +, GN +, GN/OC . .
Black-backed Woodpecker § 0.276 . . . + +, CV/ CN
–/BI– –, CN/ BI/RES . –, CN/CV/BI/RES +, BI– .
Hermit Thrush 0.798 . . . . +, GN/OC
– . . –, GN+/OC+ – – ,GN American Robin 0.697 +, OM – . . –, OM . . . . . . Tree Swallow 0.757 . . . . +, CV /CN – . . –, CN/CV +, AI – , CV+ Winter Wren 0.643 . +, CN . . . . +, CN – . . .
Ruby-crowned Kinglet 0.808 . . . . –, CN/OC/FI –, CN +, NEO/CN
– . . .
Eastern Bluebird 0.767 . . +, CN/ FI/SDM . –, CN/OC/FI . . . . .
Yellow-rumped Warbler 0.8 – +, CN . . +, CV/GI/ CN
– +, CN– . . . +, CV
Lincoln's Sparrow 0.791 . –, GN/ OM . . –, OC/GN
+ . +, GN/NEO . . . Northern Flicker 0.813 . . . – . . –, CN +, CN –/CV– – . Three-toed Woodpecker 0.784 . . –, CN + . . . –, CN/ BI/RES –, CN/CV/BI/RES . . Brown Creeper 0.721 . . . –, CN/ BI . . –, BI . Mourning Warbler 0.872 . . –, FI + . . . . . . –, GN White-winged Crossbill 0.781 –, OM . –, CN +/SDM+ . . . –, CN Alder Flycatcher 0.748 . – . . . +, SN . . . . Northern Waterthrush 0.766 . +, GN – . . . . +, GN/NEO . – .
Red-breasted Nuthatch 0.862 . . . – . –, CN/ BI/RES –, CN/ BI/RES . . .
Nashville Warbler 0.761 . . . . – ,OC/FI/ GN
+ +, GN . . . .
Olive-sided Flycatcher 0.905 . +, CN . . . . +, NEO/CN
– –, CN/OC+ . . Swainson's Thrush 0.743 – . . +, FI . –, SN + . . . . Magnolia Warbler 0.683 . . . –, SN + . . . – Belted Kingfisher 0.729 + . . . +, GN/ GV . . .
Common Nighthawk 0.76 . . . . +, GN/OC
– . . . . .
Wilson's Warbler 0.892 . . +, FI . . . + .G/NEO . – .
Table 5 Continued
Habitat variables (Stand scale 500 m) Landscape-level variables
CODE AUC DECE.Y BSP.M JPI.Y BFI.M SalEdge AquEdge Age.BF Dis.BF Dis.GF
Dark-eyed Junco § 0.231 . . +, GN
– . . +, GN . . .
White-throated Sparrow § 0.379 . . . –, OM/ SDM . +, GN +, GN/OC – .
Black-backed Woodpecker § 0.106 . . . + . . –, CN/CV/BI/RES . .
Hermit Thrush 0.748 . . . –, GN
+/OC+ – .
American Robin 0.746 . . . –, OM/ SDM . . +, OC /CN
– . .
Tree Swallow 0.764 – . . . +, AI .
Ruby-crowned Kinglet 0.757 . . . +, FI/ NEO . . –, CN/ OC
+ . .
Eastern Bluebird 0.74 . . . . +, CN
–
. . . +, CV
Yellow-rumped Warbler 0.615 . +, CN . . . .
Lincoln's Sparrow 0.787 . –, GN/ NEO . . . +, GN/ NEO . . .
Northern Flicker 0.748 . –, CN
+ . . . . . – –, CV+
Three-toed Woodpecker 0.768 . . . –, CN/ BI/ RES –, C/NCV/BI/RES . .
Brown Creeper 0.816 + . . . –, CN/ CV/ BI –, BI .
Mourning Warbler 0.895 +, FI/ NEO . –, GN –, FI
+/ NEO+ . . . . –, GN
Alder Flycatcher 0.749 . –, NEO . . +, SN . . . .
Northern Waterthrush 0.742 . . . –, NEO
+ . +, GN/NEO . – .
Red-breasted Nuthatch 0.758 . . –, CN
+ – –, CN/ BI . . . .
Nashville Warbler 0.691 +, FI/ NEO –, GN/ NEO . . . .
Swainson's Thrush 0.703 . . . +,FI/ NEO . . . . .
Olive-sided Flycatcher 0.908 . +, CN . . . +, NEO/CN
– –, CN/OC+ . .
Northern Hawk Owl 0.814 . . . –, CN/CV/ RES . .
Rusty Blackbird 0.791 –, OM . . . + .
Magnolia Warbler 0.877 . –, NEO . . –, SN
+
–, NEO+ . . .
Belted Kingfisher 0.86 + . . –, SDM . +, GN . . .
Common Nighthawk 0.908 – , NEO
+ . . +, NEO + . . +, AI .
Wilson's Warbler 0.745 . . . . + . . . .
Hairy Woodpecker 0.789 . . –, CN
+ + . . . . .
Least Flycatcher 0.971 +, NEO . . . –, CN . . . .
Common Grackle 0.732 . . . +, CN
– . . .
FIGURE CAPTIONS
Figure 1 Map of study area showing study sites, represented by black triangles, within the
four forest fire-blocks burned in 2005 (Total area 65100 ha).
Figure 2 RLQ scores of habitat variables (arrows) and bird species traits (symbols and
italicized) along the first two RLQ axes. The RLQ analysis considered habitat variables measured at (a) 100 m buffer and (b) 500 m buffer distances from the centre of the bird census point. Codes for habitats are shown in Table 1.