HAL Id: insu-01303758
https://hal-insu.archives-ouvertes.fr/insu-01303758
Submitted on 18 Apr 2016
HAL is a multi-disciplinary open access
archive for the deposit and dissemination of
sci-entific research documents, whether they are
pub-lished or not. The documents may come from
teaching and research institutions in France or
abroad, or from public or private research centers.
L’archive ouverte pluridisciplinaire HAL, est
destinée au dépôt et à la diffusion de documents
scientifiques de niveau recherche, publiés ou non,
émanant des établissements d’enseignement et de
recherche français ou étrangers, des laboratoires
publics ou privés.
from the 1999 Izmit and Düzce Earthquakes, Turkey
Thomas. Rockwell, Scott Lindvall, Tim Dawson, Rob Langridge, William
Lettis, Yann Klinger
To cite this version:
Thomas. Rockwell, Scott Lindvall, Tim Dawson, Rob Langridge, William Lettis, et al.. Lateral
Offsets on Surveyed Cultural Features Resulting from the 1999 Izmit and Düzce Earthquakes, Turkey.
Bulletin of the Seismological Society of America, Seismological Society of America, 2002, 92 (1),
pp.79-94. �10.1785/0120000809�. �insu-01303758�
79
Bulletin of the Seismological Society of America, 92, 1, pp. 79–94, February 2002
Lateral Offsets on Surveyed Cultural Features Resulting from
the 1999 I˙zmit and Du¨zce Earthquakes, Turkey
by Thomas K. Rockwell, Scott Lindvall, Tim Dawson, Rob Langridge,
William Lettis, and Yann Klinger
Abstract
Surveys of offset linear cultural features that cross the surface ruptures
of the 17 August and 12 November 1999 earthquakes on the North Anatolian fault
in Turkey yield slip values as large as or larger than those recorded by near-field
measurements in the same areas immediately after the earthquake. Using long, linear
alignments of trees, fence lines, walls, and canals, we demonstrate as much as a
2-m increase in observed slip over the initial field measurements. On an average, we
observed about 15% of the total lateral slip as off-fault deformation, with values
ranging from 0% to 40% of the total slip. Part of this lateral deformation is
accom-modated by bending or drag in a zone as much as 30 m in width, although usually
the zone varies between 5 and 20 m in width. This supports the idea that substantial
nonbrittle, off-fault deformation is associated with ruptures in areas of alluvial fill.
Alternatively, there may have been substantial afterslip, although none has been
recognized on postearthquake repaired structures. Our observations suggest that
post-earthquake measurements of fault slip, using tape measures on offset geomorphic
features, may underestimate the actual amount of slip in that event, where the
non-linearity of the offset feature does not allow recognition of the warping.
Surveys of multiple tree lines within groves of poplar trees, planted in straight
lines across the fault prior to the earthquake, show surprisingly large lateral
varia-tions. In one grove, slip increases by nearly 1.8 m, or 35% of the maximum measured
value, over a lateral distance of nearly 100 m. This and other observations along the
1999 ruptures suggest that the lateral variability of slip observed from displaced
geomorphic features in many earthquakes of the past may represent a combination
of (1) actual differences in slip at the surface and (2) the difficulty in recognizing
distributed nonbrittle deformation.
Introduction
Determination of surface slip during large earthquakes is important for understanding the physical parameters in-volved in the rupture process and in forecasting the likely size of future earthquakes on faults that have not yet pro-duced large historical earthquakes. The slip distribution along many recent strike-slip surface ruptures has been de-termined by detailed mapping and near-field measurements of slip (tape measure) in the field (Sharp, 1982; Hudnut et
al., 1989; Sharp et al., 1989; Sieh et al., 1993; Zachariasen
and Sieh, 1995; Hector Mine Working Group, 2000). These types of observations have been used to estimate the average and maximum displacement for a given rupture length in future large earthquakes (Wells and Coppersmith, 1994). However, in most cases, slip was measured using offset geo-morphic features, such as small channels and channel mar-gins, channel deposits, including bars and swales, small
ridgelines, tire tracks, edges of small pull-aparts, and other curvilinear features, that do not accurately record deforma-tion outside of a narrow zone along the main rupture. Fur-thermore, distributed slip across a broad zone of fracturing is difficult to measure with small geomorphic features. Thus, in nearly all cases, these displaced features record primarily the very near-field displacement along the primary rupture trace, and there are few data on the breadth of distributed shearing.
Significant variations in lateral slip along fault strike have also been noted on various scales for most strike-slip fault ruptures (e.g., Clark, 1972; Zachariasen and Sieh, 1995; McGill and Rubin, 1999; Langridge et al., 2002). However, what has not been clear is how much of this variability is due to misrecognition of slip from bending or distributed slip and other deformations, rather than actual differences in
6 8 7 11 10 9 4 5 40˚45' KDW 6/13/00 1425 41˚00' 40˚45' 29˚30' 30˚00' 30˚30' 30˚00' 29˚30' 30˚30' 31˚00' 41˚00' 6 Eften Golu Lake Sapanca Bay Izmit K a ra d e r e Kocaeli Duzce Hendek Golcuk Karamursel Hersek 20km 0 Akyazi gap Eften Stepover Sapanca Stepover Golcuk Stepover Karamursel Stepover November 12 Mw 7.1 August 17 Mw 7.4 1957 M 7 Abant EQ M 7.1 1967 Mudurnu Valley EQ 2 3 1 overlapping ruptures 31°00’ N Istanbul Marmura Sea Black Sea Izmit Adapazari
Figure
1.
Map of the 1999 I˙zmit and Du¨zce surface ruptures. Note the locations of our 11 survey sites of offset cultural features and tree groves.surface slip. Some workers have concluded that measure-ments of a factor of 20%–100% in slip variability over dis-tances of tens to hundreds of meters are not uncommon, after studying the lateral variability of slip based on offset geo-morphic features after the Landers earthquake (McGill and Rubin, 1999). This has implications for discriminating be-tween one or multiple discrete events or estimating the size of past earthquakes (Sieh, 1978; Rockwell and Pinault, 1986; Lindvall et al., 1989; McGill and Sieh, 1991; Weldon
et al., 1996; McGill and Rubin, 1999) using displaced
de-posits in trenches or offset geomorphic features.
After the M 7.4 I˙zmit earthquake of 17 August 1999 and the M 7.1 Du¨zce earthquake of 12 November 1999, teams of geologists mapped the surface ruptures and measured hundreds of offset geomorphic and cultural features in order to resolve slip distribution (Figs. 1 and 2) (Akyuz et al., 2000; Barka et al., 2000; Hartleb et al., 2002; Langridge et
al., 2002). Lateral variability was again observed (Fig. 2),
but this time, a number of these observations were based on projecting long, linear cultural features into and across the fault zone. The Turkey earthquakes occurred in an area of very long cultural development, and numerous cultural fea-tures were constructed across the strands of the North An-atolian fault. Better yet, several poplar tree (Kavak) groves, which consist of very long, linear, parallel rows of trees, straddle the fault zone. Thus, there is the potential for as-sessing slip from multiple, closely spaced alignment arrays along the 1999 surface ruptures.
After the November event, we measured slip on 33 fea-tures at 11 sites along these two surface rupfea-tures (Fig. 1) by surveying long alignments of trees, fences, walls, and canals with a total station. We surveyed these offset features in order to (1) evaluate previous field measurements taken after each of the earthquakes, (2) accurately determine slip at a number of points along the ruptures, and (3) test for far-field deformation and slip variability. This article presents and summarizes the results of these surveys and discusses the implications of our observations on previously determined slip values for other earthquakes, where geomorphic features were principally used for determining slip.
Methodology
The majority of the fieldwork for this project was per-formed during the period from 18 to 28 November 1999, soon after the 12 November Du¨zce earthquake. Additional surveying was performed during July 2000 to capture an additional site and to expand the number of trees surveyed at Arifiye (site 9), where maximum slip was measured. We first scouted out potential survey sites and chose 10 areas to make detailed surveys of displaced, originally straight, cul-tural features that cross the fault at a high angle (Table 1). Some of the surveyed sites on the August I˙zmit earthquake rupture directly correspond to features that were measured after that earthquake.
We surveyed three sites along the November Du¨zce rup-ture (sites 1–3) and eight sites along the August I˙zmit ruprup-ture (sites 4–11) for a total of 11 survey sites, some of which included multiple features (Table 1 and Fig. 1). These sur-veys were designed primarily to measure the total defor-mation and to discriminate between near-field slip on the principal fault zone, slip on secondary fault strands, and non-brittle far-field slip. In this study, we define total deformation as the total observed dextral slip based on the reconstruction of originally linear features and include the bending or warp-ing measured up to several tens of meters away from the fault (Fig. 3). Near-field slip is defined as lateral offset mea-sured at the primary surface rupture itself, which usually occurs within a zone a few meters wide. We define far-field slip as the total deformation minus the sum of near-field slip and the slip on discrete secondary fault strands. In some areas, far-field slip was substantial, whereas in others, it was not. In all cases, quantification of the far-field deformation is important, as this may be a major cause for undermeasure-ment of slip in some earthquakes. The long, linear cultural features that we surveyed afforded an excellent assessment of far-field deformation measured over many tens of meters away from the primary rupture.
Lateral Offsets on Surveyed Cultural Features Resulting from the 1999 I˙zmit and Duzce Earthquakes, Turkey 81 0 100 200 300 400 500 600 Sakarya Segment Sapanca Segment Karadere Segment 8 4 7 9 10 6 5 0 100 200 300 400 500 600 De xtr al Slip (cm) Longitude Longitude De xtr al Slip (cm) 29.9 30.0 30.1 30.2 30.3 30.4 30.5 30.6 30.7 30.8 30.9 31.0 31.1 31.1 31.0 31.2 31.3 31.4 31.5 30.9 Lak e Sapanca Aky azi Gap 1 2 3 Aky azi Gap Aky azi Gap Goly aka Step-o v e r Goly aka Step-o v e r Duzce Segment 11
Figure
2.
Slip distribution along a portion of the (a) 17 August earthquake rupture east of I˙zmit Bay and the (b) 12 November Du¨zce rupture (bottom) showing our survey results (diamonds with corresponding site numbers) superposed on the slip distribution curve based on field measurements made by tape measure (from Akyuz et al., 2000; Barka et al., 2000).Table 1
Survey Sites along the I˙zmit and Du¨zce Surface Ruptures
Survey Number Earthquake Rupture Fault Segment Date of Survey
(mm/dd/yy) Surveyed Offset Feature(s) General Location
Latitude (⬚)
Longitude (⬚)
6 17 August Sapanca 11/25/99 Margins of concrete flood control channel Near I˙zmit Bay 40.7208 29.9464
8 17 August Sapanca 11/25/99 Fence with wooden posts Near I˙zmit Bay 40.7208 29.9667
7 17 August Sapanca 11/25/99 Wall at razed apartment complex Near I˙zmit Bay 40.7213 29.9730
11 17 August Sapanca 07/20/00 Trees from a Kavak grove (3 rows) Tepatarla 40.7200 30.0000
10 17 August Sapanca 11/26/99 Kavak stumps (2 rows) Tepatarla 40.7203 30.0617
9a 17 August Sakarya 11/26/99 Trees from large Kavak grove (4 rows) Arifiye 40.7097 30.3619
9b 17 August Sakarya 07/21/00 Trees from large Kavak grove (8 more rows) Arifiye 40.7097 30.3619
4 17 August Sakarya 11/24/99 Kavak trees and stumps (7 rows) Near Sakarya River. 40.7080 30.4034
5 17 August Sakarya 11/24/99 Kavak trees along river (4 rows) Sakarya River 40.7072 30.4077
1 12 November Du¨zce 11/22/99 Walls at ‘Forest Service’ station Near Eften Golu 40.7558 31.0678
3 12 November Du¨zce 11/23/99 Elevated concrete flume Eften Golu 40.7612 31.0875
2 12 November Du¨zce 11/23/99 Fence with concrete posts in orchard Kaynasli 40.7755 31.3185
groves, multiple tree lines were measured to assess slip vari-ability and repeatvari-ability of measurements along the rupture. We surveyed all the tree lines in the grove where maximum slip was measured (site 9, Fig. 1) because slip measurements taken after the I˙zmit earthquake (Barka et al., 2000; Lan-gridge et al., 2002) exhibited substantial variability. In all, three sites include a matrix of trees and stumps that cross the fault where variability can be assessed.
For the survey, we used a lightweight, highly portable
Criterion 300 total station and a WildTC2000 total station, both utilizing a retroflective prism. We tested both horizontal and vertical accuracies for the Criterion 300 and found the horizontal errors to be of the order of 2 cm, whereas vertical accuracy and precision was only aboutⳲ10–15 cm. How-ever, errors appear to be systematic in a positive or negative direction, depending on whether it is shot slightly up or down; therefore, the relative error is less. Both horizontal and vertical accuracies forTC2000 are of the order of a few
w
T = total horizontal deformation S = brittle deformation on the secondary fault
P = brittle deformation on the principal fault zone
W = width of total deformation
Offset Cultural Feature OFD = T - (P + S) P T S W
Average Fault Strike
ws Principal F ault Zone (defined b y mole tr ack) Secondar y Fault
Figure
3.
Schematic figure showing offset long, linear cultural feature and the various definitions of slip, width of deformation, and off-fault deformation (OFD) that are listed in Table 2.millimeters. For assessing horizontal slip, we accept these errors to be within a reasonable margin, as measured strike slip from the earthquakes was over two orders of magnitude greater. Furthermore, uncertainties for our slip estimates due to all error sources range up toⳲ115 cm, although many were less than 20 cm.
The data were input into spreadsheets and plotted using graphing software. To measure slip, we plotted the survey data on a 36-inch-wide color plotter with a scale of 1:100 (Figs. 3–12). Thus, we could accurately measure to better thanⳲ10 cm (1 mm on the 1:100 scale). We reconstructed the originally straight alignment features, assuming that they had similar trends on each side of the fault prior to the earth-quake. We found substantial uncertainties in many cases, which we attempted to estimate (Table 2). Uncertainties are the result of several factors, some of which include (1) vari-ability in the original straightness of the offset feature, (2) earthquake-related fling or toppling of concrete structures that affected our reconstructions, (3) judgment on where the survey rod was placed at the time of the survey, (4) estimate of the fault strike, (5) judgment in discriminating between off-fault warping and original nonlinearity of the feature, and (6) errors inherent in the analysis and how we recon-structed the linear features.
The aligned poplar trees were apparently planted in re-markably straight lines, based on their current linearity away from the fault. Nevertheless, in a few cases, individual trees appear to have been planted as much as 20 cm out of align-ment. For each tree line, we attempted to place an estimate
of potential error on the reconstruction, based on the straight-ness of the trees. Similarly, there is some judgment required in reconstructing each alignment that may result in some uncertainty. We attempted different reconstructions to test potential error and made estimates of these uncertainties. In the cases of concrete structures, some error may have been introduced by rotations of the concrete blocks themselves or fling of the structures within the fault zone, so we attempted to quantify this as well. We combined each of these possible sources of error and assigned an error term to each mea-surement. Uncertainties are as small asⳲ15 cm, where the feature exhibits an exceptional linearity and as much as 115 cm, where the zone of deformation appeared very broad, and our survey may not have completely encompassed the total width of deformation. In the discussion given subsequently, we present the best estimates of our slip measurements and request the reader to refer to Table 2 for estimates on the errors.
Description of Sites and Estimates of Slip
The 11 survey sites were sequentially numbered 1 through 11 in the order in which they were surveyed. To aid in the discussion of each site, we begin with the westernmost site on the 17 August rupture and progress eastward to the 12 November rupture, rather than by site number. Along the 17 August rupture, we surveyed five sites (6, 8, 7, 11, and 10) on the Sapanca segment and three sites (9, 4, and 5) on the Sakarya segment (Fig. 1). Of the eight sites on the Au-gust rupture, six sites (6, 11, 10, 9, 4, and 5) involved surveys of multiple linear features. We did not survey any offsets along either the Golcuk or Karadere segments. Three survey sites (1, 3, and 2) are located on the Du¨zce segment of the 12 November rupture (Fig. 1).Sapanca Segment: 17 August Rupture
Site 6, located near I˙zmit Bay, is the westernmost site surveyed and consisted of an offset flood control channel constructed with rock and concrete (Fig. 4) (figure 14 of U.S. Geological Survey, 2000). We surveyed the top edge of the walls of the channel over an aperture of about 120 m cen-tered on the primary fault zone, which is about 5–6 m wide. Warping of the walls is noted for a distance of 5–15 m out from the main fault, indicating a deformation zone width of about 10–25 m. Brittle slip across the main fault zone for these two walls is nearly identical at about 1.5 m, whereas total slip, including warping, is estimated at 2.1 m for the western wall and 2.05 m for the eastern wall. Thus, this observation demonstrates that our surveying is reproducible. A secondary strand is located about 70 m south of the pri-mary fault and expresses an additional 0.75 m of dextral slip. Thus, the total dextral deformation across this channel is about 2.8 m.
Site 8 consists of an offset barbed-wire fence constructed with wooden fence posts, which exhibits an exceptional li-nearity on both sides of the fault. The base of each fence
83
T
able
2
Estimates of Slip from Surveyed Of fset Cultural Features Length of Survey † T otal Slip ‡ Slip on Principal Strand § Slip on Secondary Strands || Estimated Of f-fault Deformation (OFD) # Site Number Of fset Feature Average Fault Strike*
T otal North South Amount Uncertainty W idth Amount Uncertainty W idth Amount Uncertainty W idth (Lt) (Ln) (La) (T) (Ⳮ )( ⳮ ) (W) (P) (Ⳮ )( ⳮ ) (W) (S) (Ⳮ )( ⳮ )( W a ) Amount % o f T otal 6 (A) W est wall of canal N89.5E 122 46 76 2.85 0.30 0.30 75 1.55 0.30 0.30 6 0.75 0.2 0.2 ⬍ 2 0.55 19 (B) East wall of canal 116 40 76 2.80 0.40 0.40 75 1.50 0.30 0.30 5 0.75 0.3 0.3 ⬍ 2 0.55 20 8 W ooden fence posts E – W 5 7 3 4 2 3 3.76 0.20 0.20 11 – 13 3.05 0.20 0.20 ⬍ 4 0 0 0 0 0.65 18 7 Concrete wall N70E 76 54 22 2.75 0.20 0.20 6 – 18 2.00 0.20 0.10 ⬍ 2 0 0 0 0 0.75 27 11 T ree row 1 N88E 63 37 26 2.25 0.20 0.20 4 1.85 0.20 0.20 4 0 0 0 0 0.40 18 T ree row 2 7 7 4 3 3 4 1.80 0.30 0.20 4 1.80 0.30 0.20 4 0 0 0 0 0.00 0 T ree row 3 6 7 3 6 3 1 1.90 0.30 0.30 3 1.90 0.30 0.30 3 0 0 0 0 0.00 0 10 (A) W estern row of stumps N88E 43 14 29 3.85 0.15 1.15 10 – 28 2.30 0.15 0.15 5 0 0 0 0 1.55 40 (B) Eastern row of stumps 39 15 24 3.65 0.25 0.85 3 – 22 2.80 0.10 0.10 3 0 0 0 0 0.85 23 9 T ree row 1 N89E 94 12 82 3.80 1.00 0.80 ⬎ 6? 3.35 1.00 0.80 0 0 0 0 0.45 12 T ree row 4 116 41 75 4.50 0.20 0.20 ⬃ 4 4.50 0.20 0.20 2 – 3 0 0 0 0 0.00 0 T ree row 5 138 50 88 3.40 0.30 0.40 ⬃ 5 3.40 0.30 0.40 3 0 0 0 0 0.00 0 T ree row 6 141 59 82 4.40 0.30 0.60 4 – 15 3.60 0.30 0.60 1.5 – 2 0 0 0 0 0.80 18 T ree row 7 6 6 3 1 3 5 4.40 0.20 0.20 1.5 – 8 3.80 0.20 0.20 1 – 2 0 0 0 0 0.60 14 T ree row 8 144 74 70 4.60 0.40 0.20 2.5 – 3 3.60 0.40 0.20 2.5 0 0 0 0 1.00 22 T ree row 9 129 54 75 4.20 0.20 0.40 4 – 10 3.70 0.20 0.40 4 0 0 0 0 0.50 12 T ree row 10 112 62 50 4.70 0.30 0.50 7 – 10 3.95 0.20 0.20 3 0 0 0 0 0.75 16 T ree row 11 81 37 43 5.15 0.25 0.25 10 – 17 4.30 0.25 0.25 2 0 0 0 0 0.85 17 T ree row 12 66 32 34 5.20 0.20 0.30 12 – 14 5.20 0.20 0.30 8 0 0 0 0 0.00 0 4 (A) W esternmost row of stumps N88E 38 1 3 7 3.3 Ⳮ 0.2 Ⳮ 0.20 4 – 7Ⳮ 3.30 0.20 0.20 4 0 0 0 0 ? ? (B) Row of stumps 38 5 3 3 3.2 Ⳮ 0.2 Ⳮ 0.20 8 – 10 Ⳮ 3.10 0.10 0.10 8 0 0 0 0 ? ? (C) Row of stumps 37 8 2 9 3.80 0.20 0.70 7 – 11 3.70 0.20 0.20 7 0 0 0 0 0.10 3 (D) Row of stumps 37 11 26 3.70 0.20 0.20 8 – 14 3.30 0.20 0.20 ⬍ 12 0 0 0 0 0.40 11 (E) Row of trees 32 13 19 4.40 0.25 0.25 12 4.40 0.20 0.20 8 0 0 0 0 0.00 0 (F) Row of trees 36 20 16 4.45 0.35 0.25 13 4.25 0.20 0.20 7 0 0 0 0 0.20 4 (G) Easternmost row of trees 36 23 13 4.55 0.20 0.20 13 4.10 0.20 0.20 7 0 0 0 0 0.45 10 5 (A) W estern row of trees N84.5E 48 26 22 4.30 0.20 0.20 10 3.90 0.10 0.10 ⬍ 4 0 0 0 0 0.40 9 (B) Row of trees 57 23 34 4.20 0.20 0.60 5 – 13 3.90 0.20 0.20 4 0 0 0 0 0.30 7 (C) Row of trees 56 18 38 4.40 0.40 0.30 15 3.20 0.20 0.20 5 0 0 0 0 1.20 27 (D) Easternmost row of trees 69 14 55 5.10 0.20 0.40 23 3.80 0.30 0.30 4 0 0 0 0 1.30 25 1 Concrete wall N67.5E 113 24 89 3.80 0.40 0.40 46 2.80 0.35 0.35 4.5 0.6 0.15 0.15 ⬍ 1 0.40 11 3 Concrete fl ume N80.5E 66 52 14 3.80 0.50 0.50 36 2.45 0.20 0.20 5 – 6 0 0 0 na 1.35 36 2 Concrete fence posts N80E 36 16.5 19.5 3.45 0.20 0.20 20 2.00 0.20 0.20 6.5 0.2 0.1 0.1 ⬍ 1 1.25 36 A verage ⳱ 15 *A verage strike of the fault zone in the vicinity of the survey . †T otal length of surveyed portion of cultural feature (Lt). This length is divided into the portion of survey north of the fault (Ln) and portion of surve y south of the fault (La). ‡T otal slip (T) was measured from 100 scale plots of survey data. §Slip on principal strand (P) was measured as amount of deformation within the principal fault zone, de fi ned as the moletrack or zone of appreciable ground deformation. ||Slip on secondary strand (S) represents displacement on discrete faults outside the principal fault zone. #Estimated Of f-fault Deformation (OFD) represents nonbrittle deformation in the form of warping, rotation, or fi nely distributed slip, OFD ⳱ T ⳮ (P Ⳮ S); ? ⳱ unknown value due to insuf fi cient length of feature beyond fault.
Mole Track Secondary Fault ~2.1 m ~0.75 m
N
Concrete Flood Site 6 Survey 0 10m Control Canal a) b)Figure
4.
(a) Survey of a flood control canal con-structed with concrete and stone at site 6. (b) Photo-graph of west wall of canal. Note the linear nature of the inside edge of the wall that we surveyed and the warping and displacement at the main fault.Mole Track Fence Line 0 5 m N Site 8 Survey T = 3.7 m
Figure
5.
Survey of a fence line (barbed wire on wooden posts) at site 8. The fence alignment is par-allel on each side of the fault, and the zone of defor-mation appears quite narrow, less than 3 m.post was surveyed to establish the location of this strain marker (Fig. 5). We estimate the total lateral slip at site 8 to be 3.7 m, of which about 0.65 m is warping.
Site 7 consists of an offset concrete wall along the west perimeter of a newly constructed complex of apartment buildings that were razed following the August earthquake due to extensive collapse and structural damage (figure 15 of U.S. Geological Survey, 2000). Because the fault trace was buried beneath the building rubble east of the wall, we could only survey the location of the fault zone west of the fault (Fig. 6). Based on reconstruction of the wall at site 7, we estimate 2.75 m of lateral slip, of which 0.75 m is off-fault deformation.
Sites 8 and 7 are both single linear offset features near I˙zmit Bay (Fig. 1). In both cases, these linear features are
parallel on each side of the fault, and the zone of deformation is narrow, less than 5 m. Error in both cases is low; we estimate that a deflection or overreconstruction of more than about 20 cm would be observable because of the linearity of these features, so we use this as an estimate of the error. These observations, combined with those from site 6, show that where the fault approaches I˙zmit Bay, slip appears to vary by nearly 1 m at the surface over a lateral distance of 2–3 km.
Site 11 is a small grove of three tree lines near Kosekoy (Figs. 1 and 7). We surveyed the three lines of trees and resolved slips of 1.9, 1.8, and 2.25 m for the three tree align-ments, all of which agree within the 20–30 cm of error. They are also very similar to measurements recorded in the area immediately after the earthquake (Barka et al., 2000).
Site 10, also along the Sapanca segment, consists of two parallel lines of tree stumps near Tepatarla (Figs. 1 and 8). Stumps have the advantage over living trees because the center of the stump can be sighted with the pole directly, there are no visibility problems as in a grove of trees, and there is less variability in growth direction at ground level. We surveyed all the stumps present, but the rows of stumps only extend 10 m north of the fault and 20 m south of it. As we have observed other zones of deformation that were at least this wide, slip estimates for this site may represent min-imum values. This suggestion is supported by the observa-tion that the stump lines are not exactly parallel on each side of the fault and that at least one additional minor fault may be represented by a step in the stump line about 15–20 m south of the main fault. We fixed the trend of the tree line north of the fault to establish slip and assume that most or
Lateral Offsets on Surveyed Cultural Features Resulting from the 1999 I˙zmit and Duzce Earthquakes, Turkey 85 Fault rubble and debris obscure fault zone N 0 5 m
T=~2.75 m
Site 7 Survey
Wall
Figure
6.
Survey of a wall at site 7. The wall is all that remains of a destroyed and torn-down apart-ment building complex offset by the earthquake. The eastern portion of the fault was obscured by debris from the building rubble at the time of the survey.fault 2.25 m 1.9 m 1.8 m 0 10m N Site 11 Survey
Figure
7.
Survey of three tree lines near Kosekoy, with slip ranging between 1.8 and 2.25 m, similar to tape measurements taken soon after the earthquake. Slip also occurred on nearby secondary faults that were not crossed by the tree lines.all of the warping occurs to the south of the fault. The other possibility, that of fixing the trend south of the fault, requires that the trees to the north are reverse-dragged into the fault. We consider this less likely. Thus, we consider the similar estimates of 3.65–3.85 m (from both rows of stumps) across the entire zone to best represent slip at this site. This value is similar to the maximum surveyed value near I˙zmit Bay and suggests that slip at depth may be 3.5–4 m for the Sa-panca segment of the August rupture.
Sakarya Segment: 17 August Rupture
Sites 9, 4, and 5 are located along the Arifiye segment that sustained the highest measured slip during the August earthquake (Figs. 1 and 2) (U.S. Geological Survey, 2000; Langridge et al., 2002). We confirmed those results with our surveys but generally determined slip values that were larger than those measured during the weeks that followed this event. At each of these three sites, we surveyed multiple lines of trees across the fault zone.
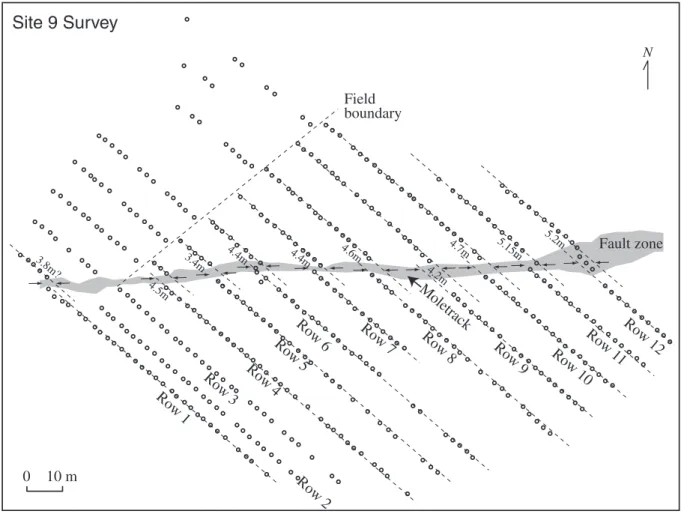
At site 9, we surveyed 12 lines of trees at the orchard near Arifiye, where the maximum slip value of 5.1 m (Akyuz
et al., 2000; Barka et al., 2000) was measured after the
earth-quake (Figs. 1 and 9). For the western portion of the orchard, the entire zone of deformation appears to be within a width of 2–4 m, and the trees are parallel on each side of the fault (Fig. 9). Toward the east, the fault zone broadens to about 10 m, with nearly all the deformation within this zone. Al-though the lengths of our surveys extend up to 100 m on each side of the fault, the actual distance perpendicular to fault is only as much as 60 m because the tree lines are oriented at about 40⬚ to the fault. Furthermore, a field bound-ary obliquely intersects the fault and disrupts the tree align-ments, resulting in significantly shortened tree rows for some alignments (Fig. 9).
We reconstructed the surveys to resolve slip measure-ments that ranged between 3.4 and 5.2 m. The errors are relatively larger in some cases because some tree lines were not planted perfectly straight, and all the rows are at a mod-erate angle to the fault.
The slip appears to increase across the grove from west to east, with the maximum slip measurements along the east-ernmost trees at about 5.2 m. By assuming originally straight tree rows, we resolved 5.15 m of slip for row 11 and 5.2 m
N
5 m 0 Stump lines Mole Track Site 10 Survey Possible secondary fault3.85 m
3.65 m
Figure
8.
Survey of two parallel stump lines at site 10. Slip is estimated at about 3.65 and 3.85 m for the west and east lines, respectively. However, the stumps south of the fault are not exactly parallel to those north of it, suggesting that the zone of warping equals or exceeds the length of the stump line. Thus, these slip estimates are probably minimum values.of slip for row 12, confirming the field measurements taken by tape measure after the earthquake on these same trees. In both cases, error is estimated at about 25 cm based on minor irregularities in tree planting and in our inability to resolve primary configuration versus deformation.
In any case, slip clearly varies across this grove by up to 1.8 m over a lateral distance of about 100 m between rows 5 and 12 (Figs. 9 and 10). Moreover, the 3.4-m measurement of row 5 is about 1 m less than for adjacent rows 4 and 6 that are only 10–15 m apart. In the field, we could not find other fault strands that may have accommodated this defor-mation nor were any reported from the surface rupture map-ping immediately after the earthquake (Barka et al., 2000). However, because our survey measurements were made months after the earthquake and after several significant rainfalls, we cannot preclude minor secondary strands. This could partially explain the variability of measured slip in the grove.
Site 4, located west of the Sakarya River (Fig. 1), con-sists of a group of four stump lines and three tree lines (Fig. 11). In the weeks following the earthquake, 3.47Ⳳ 0.3 m of slip was measured on one of the tree lines, and about 3.3 m of slip was measured on a wall east of the grove (Lan-gridge et al., 2002). This wall, as shown in Figure 11, had been rebuilt prior to our November survey, and there was no indication of rebreakage after its reconstruction, indicat-ing that there was no afterslip since reconstruction of the wall. The fault crosses obliquely through the grove of trees
and stumps, so the zone of deformation is only completely crossed by the eastern five tree lines. In fact, the western two stump rows only have one stump north of the fault, resulting in minimum slip estimates only. Also, the individual lines of trees and stumps only measure 40 m in length, but they are generally parallel away from the fault zone. To maximize the usefulness of the stump lines that do not extend very far north of the fault, we analyzed the stump and tree spacing across the deformation zone to estimate slip for each align-ment. Assuming relatively straight tree lines prior to the earthquake, we estimate slip increases from about 3.3 (min-imum) to 4.55 m across a lateral distance of 40 m (Figs. 11 and 12). Of note is the observation that slip appears to in-crease gradually and systematically across the grove to the east, as shown in Figure 12.
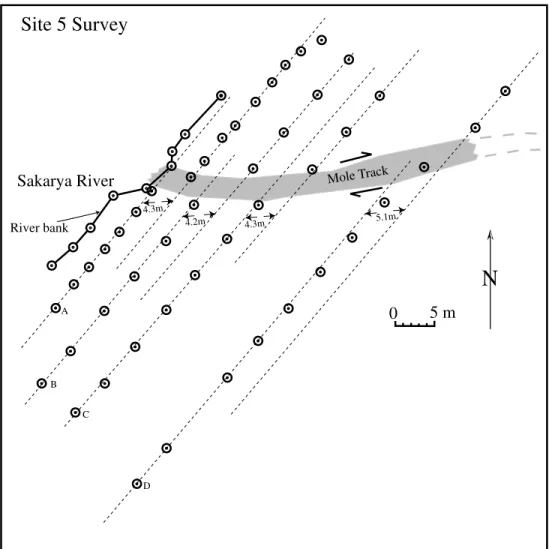
Site 5 is located along the Sakarya River, east of site 4, where we surveyed four tree lines on the terrace adjacent to the stream bank (Fig. 13). We also surveyed the stream bank, but collapse (lateral spreading) of the channel bank led to very large uncertainties in the actual slip, so we did not use the stream bank offset for a slip estimate. Liquefaction was extensive at this site, and its effects on the tree alignments are unknown. Again, the fault crosses obliquely through the grove of trees, so we may miss some slip if we did not capture the entire width of deformation. In all cases, the trees are parallel on each side of the fault zone, which supports the contention that we did capture most or all of the slip. Also, in this case, slip increases toward the east, away from the river, and where the survey line extends the shortest dis-tance beyond the fault. Projecting the tree lines across the fault and reconstructing them yields values of about 4.2–4.3 m for the western three lines and 5.1 m for the eastern tree line. The western tree lines appear to completely cross the fault zone. The eastern tree line has a broad zone of warping, and only the northern two trees have the same trend as the trees toward the south end of the line. The 5.1 m is over 0.5 m greater than the other three tree lines (Fig. 14) and either represents a significant increase in slip over a very short lateral distance or an irregular and unparallel planting of the trees in row D on the south side of the fault. This apparent lateral variation may also reflect the possible effects of liq-uefaction and lateral spreading, although we did not observe a deflection in the tree alignments over the distances sur-veyed.
Du¨zce Segment: 12 November Rupture
Sites 1–3 are along the 12 November Du¨zce surface rupture, with two surveys located near Eften Golu and one at Kaynasli (Fig. 1). The Eften Golu sites involved mea-surement of offset concrete walls and a chain-link fence at site 1 and an offset elevated concrete flume at site 3. Within an orchard in the town of Kaynasli, we surveyed an offset barbed-wire fence mounted on concrete posts at site 2.
Because no single cultural feature spanned the entire width of the fault zone at site 1, we surveyed two walls and
Lateral Offsets on Surveyed Cultural Features Resulting from the 1999 I˙zmit and Duzce Earthquakes, Turkey 87
N
0 10 m
Row 6 Row 7 Row 12
Field boundary Fault zone Moletrack Row 1 Row 2 Row 3 Row 4
Row 5 Row 8 Row 9
5.15m 4.5 m 3.4m 4.4m 4.4m 4.6m 4.2m 4.7m 5.2m 3.8m? Row 1 1 Row 10
Site 9 Survey
Figure
9.
Survey of site 9, where maximum slip was reported in tree rows 11 and 12, after the August earthquake. Note that slip is generally in the range of 4.5–5 m, increasing eastward, but that tree row 5 has a substantially lower value of slip (3.4 m). Tree row 1 also appears to have a lower slip value but has large associated uncertainties.3 4 5 120 20 40 60 80 100 140 Dextral Slip (m)
Distance along Fault Strike (m)
Site
6 7 1 1 1 9 8 5 1 4 6 E WFigure
10.
Variability of slip through grove at site 9, showing mean values and uncertainties.a chain-link fence in an attempt to measure the total defor-mation at this site (Fig. 15). A low (⬍1 m high) concrete wall (with an upper chain-link portion) extends north and south beyond the main fault zone by about 18 m and 13 m, respectively, but does not cross the secondary fault located about 32 m south of the main zone. This wall was
con-structed across a large pre-existing scarp (⬃5 m high) that may have had significant fluvial modification. A taller rock wall (⬃2 m high) with a concrete cap and a separate chain-link fence were surveyed to capture slip on the secondary strand and to measure any nonbrittle warping that may have occurred south of the main strand (Fig. 15).
On the south, or mountain, side of the main fault, the short wall is outside of the zone of faulting, and we assume this to represent the original orientation for this feature. For several meters adjacent to the fault on the south side, the wall appears to bow out to the west (downslope), which may represent several tens of centimeters of downslope move-ment related to tensional cracking in the slope or fling of the concrete during the earthquake. We use the linear wall seg-ment south of this disturbed zone for our reconstruction. On the north, or valley, side of the main fault, the wall bends and expresses a zone of warping for about 10 m north of the main trace. Only the northernmost section appears to be un-deformed and have the same trend as the wall south of the fault (Fig. 15). If correct, then by projecting the same trend of the wall across the fault and zone of warping, we estimate
N
Row A Row B Row C RowD Row E Row F Row G Rebuilt Wall 0 5 m 3.7m 3.8m 3.2+m 3.3+m 4.4m 4.45m 4.55m Site 4 Surveyfault zone
Figure
11.
Survey plot from site 4 showing four stump lines (rows A–D) and three tree lines (rows E–G) that are offset across the fault. Slip after the earthquake was reported from the fence line along the east side, which has now been rebuilt. Note that the western stump lines only have one stump north of the fault, so these are interpreted as minimum values because these rows may not capture the entire zone of deformation.about 3.2Ⳳ 0.4 m of right-lateral slip, of which about 40 cm is by warping.
A secondary fault strand is evident about 30 m south of the main zone. The tall wall is linear and parallel, both to north and to south of this secondary fault, and there is no apparent warping beyond the very narrow secondary fault zone. We estimate an additional 0.6Ⳳ 0.05 m of dextral slip across this southern strand, yielding a total slip of about 3.8Ⳳ 0.4 m.
At site 3, a concrete flume crosses a 5-m-wide zone of faulting and extends 10 m to the south of the fault and about 50 m to the north of it (Fig. 16). It appears that this site experienced significant off-fault deformation, so we aligned the straight section of the flume south of the fault with the parallel section of five survey points north of the fault to
measure slip. Immediately adjacent to the fault, the flume is apparently reverse-dragged into the fault, due to rigid rota-tion of the concrete flume in the zone of deformarota-tion. Ig-noring the rotations within the fault and using the projected alignments shown in Figure 16, we determined 3.8 Ⳳ 0.5 m of total right-lateral slip for this site.
Site 2 at Kaynasli is a line of concrete fence posts that cross a 5-m-wide zone of faulting that includes a 2-m-wide mole track and a secondary splay (Fig. 17). The trend of the fence posts to the north and south of the fault is discordant, although there was no clear reason why this should be the case other than broad, distributed shear. To the north of the fault, the posts are found in alluvium and have a more north-easterly trend than to the south of the fault (presumably shal-lower bedrock), suggesting that the end of the survey 10 m
Lateral Offsets on Surveyed Cultural Features Resulting from the 1999 I˙zmit and Duzce Earthquakes, Turkey 89 3 4 5 4 8 12 16 20 24 28 32 36 40 Dextral Slip (m)
Distance along Fault Strike (m) Site 4
0
W E
Figure
12.
Variability of slip through the Kavak grove at site 4, showing mean values and uncertain-ties. Note the apparent systematic increase in slip from west to east.north of the northernmost fracture is not completely outside the zone of warping. This is supported by observations of additional fractures, 25–30 m, to the northwest (Fig. 17). If correct, then the total dextral shear is substantially more than that indicated by the brittle displacement at the fault. To estimate slip, we use the near-field slip on the principal strand of 2.0 m as a minimum value. For a maximum value, and one that we suspect reflects the actual slip, we project the fence line into and across the fault, using the strike of the fence south of the fault and the northernmost fence post as a tie, assuming the fence was straight prior to the earth-quake (Fig. 17). This yields a higher total estimate of slip of 3.45 m for site 3, which is consistent with the maximum postearthquakes measurements in the Kaynasli region (Ak-yuz et al., 2000).
Comparison with Field Measurements Taken after the Earthquakes
We compared our estimates of slip based on surveyed alignments with the field estimates taken after each of the two surface ruptures. For the Sakarya segment, we made the field slip estimates reported by Barka et al. (2000) for some of the same sites we surveyed, so we attempted to relocate the same features that we described during August. How-ever, from our surveying of parallel lines of trees and the significant variability of slip that we observe over short lat-eral distances, we cannot be certain that in some cases we actually observed the same tree line, even though we made many of the initial measurements. For the Du¨zce rupture, we compare our results with those of Akyuz et al. (2000) and Hartleb et al. (2002) and are certain that the features are the same for at least sites 1 and 3 (Hartleb, 2000, personal comm.).
For the Sapanca segment, slip was reported as being lower than slip either to the east (Arifiye) or to the west (Golcuk area) (Barka et al., 2000). We reconfirm these ob-servations; however, we report higher slip values based on the surveys at sites 8, 11, and 10 than were recorded after
the earthquake. Slip along this segment appears to range from about 1 to 3 m from the field mapping, whereas the survey measurements ranged between 1.8 and 3.85 m (Fig. 2). We take the mean slip value at each of the five survey sites to calculate an average slip of about 3 m for the Sapanca segment we surveyed during November. The fence line at site 8 and the stumps at site 10 offset yield significantly greater amounts of offset than reported in postearthquake investigations (Barka et al., 2000; Langridge et al., 2002). We attribute these differences primarily to either misrecog-nition of slip after the earthquake or lateral differences in slip along the rupture rather than to afterslip, as we saw no evidence of recracking of repaired roads or other linear fea-tures that would suggest continued slip.
For the Sakarya segment east of Lake Sapanca, we also reconfirm the observations of high slip. At site 9, which we measured after the earthquake as 5.1 m on the same line of trees (Barka et al., 2000; U.S. Geological Survey, 2000; Langridge et al., 2002), our survey results indicate a slightly higher slip of 5.15–5.2 m. Considering the errors in both cases, these estimates are indistinguishable. Along the Sa-karya River at site 5, however, we had measured the trees close to the river as being offset a little over 3 m, whereas our survey results indicate higher values of 4–5 m. The three western tree lines all show slip in the range of 4.2–4.4 m, whereas the easternmost tree line reconstructs to 5.1 m of dextral offset. Slip at this site is substantially more than that reported after the earthquake, with an average value of 4.5 m. This is 1.2 m higher than the value of 3–3.3 m reported in August and better matches the deep slip observed by geo-physical methods. This illuminates the need to collect abun-dant, closely spaced observations rather than few, widely spaced slip measurements. It also illustrates the errors that are inherent from making near-field measurements without a sufficient reference frame.
For the Du¨zce rupture, our three surveyed offsets are also generally higher than those reported from the field ob-servations. For instance at site 3, we estimate a value that is over 2 m higher on what we are certain is the same feature that was measured by the Du¨zce mapping team (Akyuz et
al., 2000). At site 2, we determined about 0.5 m more slip
than was measured by the mapping teams. Our measurement at site 1, in contrast, falls within the range estimated by Har-tleb et al. (2002). Along the I˙zmit–Sapanca and Sakarya segments, one can invoke afterslip as a partial explanation for the differences. However, as we made our measurements during the same time period as Akyuz et al. (2000) and Har-tleb et al. (2002) for the November rupture, these differences appear to reflect primarily the difference between near-field estimates of slip and those based on survey of long, linear features. Some of the differences can be attributed to our observation on significant lateral variability of slip and the likelihood that the highest slip along any section of fault was actually measured. In many cases, it is possible that the larg-est displacement feature is not measured after an earthquake if measurements are spaced fairly broadly. Nevertheless, in
Mole Track
Sakarya River
4.3m A B C D 4.2m 4.3m 5.1m River bankSite 5 Survey
5 m
0
N
Figure
13.
Survey plot of site 5 showing the alignments of four tree rows across the fault. Note that the eastern line of trees, which has the greatest amount of apparent slip, has the least coverage north of the fault.3 4 5 10 15 20 25 30 35 5 Dextral Slip (m)
Distance along Fault Strike (m)
Site 5
0 A B C D W EFigure
14.
Variability of slip through the Kavak grove at site 5, showing mean values and uncertain-ties.that most of the measurements are known to have been taken on the same feature, we attribute much of the difference to the contribution of off-fault deformation. We include near-fault warping along with our estimates of brittle slip when the surveyed markers have significant spacing between them, which may partially explain why even our estimates of near-field slip are generally larger than those reported from field estimates alone. The possibility of afterslip re-mains a partial possibility for explaining our differences in slip, especially near I˙zmit.
These observations are important for interpreting geo-morphically derived displacements along active faults (Lind-vall et al., 1989; McGill and Rubin, 1999). We observed an average of about 15% of the strain accommodated by non-brittle shear, with individual observations ranging from 0% to 40%. The actual average may even be higher in that we may have included some near-fault bending in our estimates of brittle slip (Table 2). Part of this lateral deformation is accommodated by bending or drag in a zone as much as 30
Lateral Offsets on Surveyed Cultural Features Resulting from the 1999 I˙zmit and Duzce Earthquakes, Turkey 91 D U N
Site 1 Survey
0 5 m 0 10 20 mDetail of main fault offset at Site 1
Area of detail chainlink fence rock wall concrete wall with chainlink secondary fault (60 cm) main fault (3.2 m) secondar y faults and tensional cr acking in slope concrete wall with chainlink Main F ault Zone 3.2 m 2.8 m
Figure
15.
Survey plot from site 1 showing a wall offset by the main faults and another wall and chain-link fence offset by a secondary fault. Note that no single cultural feature spanned the entire width of deformation at this site.m in width, although usually the zone varies between 5 and 20 m in width. This supports the idea that substantial non-brittle, off-fault deformation is associated with ruptures in areas of alluvial fill and argues strongly for the concept of construction set backs from active faults. In areas of sub-stantial off-fault deformation, our observations suggest that postearthquake field measurements of slip based on offset geomorphic features alone may underestimate the actual amount of slip in that event. Furthermore, measurements based on brittle offset of deposits exposed in trenches may also represent a minimum of the total slip, thereby leading to underestimates of slip rate, displacement per event, or inferred earthquake magnitude.
Lateral Variability and Its Implications
Multiple alignments were surveyed at six of our sites, and in most cases, the estimates of slip vary significantly, even for tree lines and walls that are only a few meters apart (Figs. 2, 10, 12, and 14). We are surprised by this result because in many of these alignments the strain does not ap-pear to be simply accommodated by bending or other
non-brittle deformational styles. It does not appear to extend to nearby alignments of trees or walls, and there seems to be a systematic increase in one direction rather than random var-iations.
The maximum slip of about 5.1 m was measured in September, east of Sapanca at our site 9 by the mapping team (Barka et al., 2000; U.S. Geological Survey, 2000; Langridge et al., 2002). We reconfirm this result and mea-sured about 5.15 and 5.2 m of slip on the same alignments of trees. However, within this grove of trees, surveyed slip measurements vary by up to 1.8 m over a 100 m horizontal distance and up to nearly 1 m over distances of only 10–15 m. As we have long survey transects that appear to encom-pass the entire width of the deformation zone, there appears to be real lateral variability over a relatively short section of the fault. This is consistent with observations made soon after the earthquake, as well as from two other of our surveys at sites 4 and 5. The alternative explanation is that slip is stepping from the main strand to another unmapped and un-recognized secondary strand. The problem with this inter-pretation is that the primary 1999 rupture strand continues for a much greater length than the distance over which the
Site 3 Survey
D
U
N
3.8m Mole Track 0 5 m Concrete FlumeThis section is parallel to the flume south of the fault
Flume warped into fault
Rotated section of flume
Centerline of
Figure
16.
Survey plot from site 3 showing a dis-placed concrete flume. Note the apparent fling of the flume section within the main fault zone and the ap-parent warping of the flume farther north of the fault.Mole Track Secondary fault
Fence Posts
3.45m
Posts warped into fault zone Secondary fault zone about 25 m
northwest of limit of survey
N
0 5 m
Site 2 Survey
Figure
17.
Survey plot from site 2 showing a dis-placed fence line. Note that the northern alignment of the fence, which is in alluvium, is not parallel to the fence south of the fault where bedrock is presumed to be shallower.change in slip occurs, and another postulated strand with a slip of 1 m should have been easily recognized.
In each of the cases of observed variability in slip, there is as much as 20%–25% difference between the lowest and highest values. This is far outside of our estimates of error and are difficult to explain by other mechanisms. These ob-servations of variability have significant implications for models of real earth deformation, in that these strains are occurring over short lateral distances. Further, they mean that offsets derived from trenches may not accurately reflect slip for a section of fault, even if far-field deformation is not an issue. These values are similar to those described for vari-ability in offset geomorphic features mapped after the Land-ers and Hector Mine earthquakes (Hector Mine Working Group, 2000).
The aforementioned observations suggest that the 1999 Turkey ruptures may be the best case yet for defendable lateral variability of slip over short distances. In most of the previous studies, offsets were measured on either
geomor-phic features, for which the pre-earthquake configuration cannot be determined without substantial error, or cultural features that are too short to record distributed, off-fault strain. In Turkey, long rows of poplar trees planted in fairly straight (Ⳳ15–20 cm) lines may make for a remarkable anal-ysis of strain variability.
Discussion and Conclusions
Our long baseline surveys of cultural features, offset in the I˙zmit and Du¨zce earthquakes of August and November 1999, show that many, closely spaced measurements are re-quired in order to adequately resolve slip for a section of fault. Widely spaced measurements may miss areas of higher slip that may be more representative of slip at depth. Fur-thermore, we observed evidence of significant off-fault de-formation of an average of about 15% of the total, with as much as 40% for some features. In most cases, the higher values of warping are due to rotation of rigid structures, such as concrete canals and walls, but even some tree lines ex-perienced broad zones of deformation with large compo-nents of nonbrittle shear. Much of this off-fault deformation was apparently not recognized by the field mapping teams, as a long baseline reference frame is required. Thus, mea-surement of only the near-field slip using tape measures po-tentially underestimates the actual slip for the earthquake and slip distribution for the overall surface rupture. Field measurements of even long features may underestimate slip
Lateral Offsets on Surveyed Cultural Features Resulting from the 1999 I˙zmit and Duzce Earthquakes, Turkey 93
because it is very difficult to resolve far-field bending in the field. This is evident from the Du¨zce rupture, where long, linear features were measured by both the methods, and the surveyed results yielded consistently higher values. Mea-surement of very near-field geomorphic features is expected to be even more problematic, especially in alluvium, and should be considered minimum values.
We found that errors in slip estimation for surveyed features may be significant, even for long, linear structures that look very good in the field. In our best-case examples, we estimate uncertainties on the order of 15–20 cm. For a couple measurements, uncertainties are about 1 m. In some cases, our slip estimates and associated errors did not overlap with those made in the field after the earthquakes, which were based on near-field measurement techniques (tape mea-sure). We suggest from these observations that field esti-mates of slip may commonly underestimate errors associated with slip measurements and that actual errors for relatively long baseline features may be very large because it is very difficult to see broad warping in the field. We experienced this phenomenon in several cases in that many of the features we surveyed appeared dead parallel in the field yet were found to record some rotational strain. We recommend that surveying of long baseline cultural features be considered a routine task performed along with field mapping after every surface-rupturing earthquake. We also suggest that align-ment arrays and other surveying monualign-ments be established immediately after a surface rupture to assess the presence of afterslip, as we cannot preclude this as a partial explanation for the observed differences in this study.
Acknowledgments
We first and foremost thank the wonderful people of Turkey for wel-coming us with open arms after such a terrible disaster. Many landowners granted access for the surveying work, and many local Turks provided useful discussions on individual features and their original configurations. We thank Pacific Gas & Electric Company for funding most of this project, and especially Bill Page for his direction during the early phases of the field investigation, but we accept full responsibility for any misinterpreta-tions that may evolve out of this work. The Southern California Earthquake Center provided support for R. L. to fly over and join the surveying team. Finally, we thank Aykut Barka for his unwavering support and assistance in Turkey in all phases of our work, including providing students to help with translations. Without Aykut and his Turkish colleagues, work in Tur-key would have been much more difficult and not nearly as much fun. This research was supported by the Southern California Earthquake Center. SCEC is funded by NSF Cooperative agreement EAR-8920136 and USGS Cooperative agreements 14-08-0001-A0899 and 1434-HQ-97AG01718. The SCEC Contribution Number for this article is 615.
References
Akyuz, H. S., A. Barka, E. Altunel, R. Hartleb, and G. Sunal (2000). Field observations and slip distribution of the November 12, 1999 Du¨zce earthquake (M 7.1), in Istanbul Technical University Special
Publi-cation on the August 17 and November 12 Earthquakes, A. Barka
(Editor), (in press).
Barka, A., S. Akyuz, E. Altunel, G. Sunal, Z. Cakir, A. Dikbas, B. Yerli,
T. Rockwell, J. Dolan, R. Hartleb, T. Dawson, T. Fumal, R. Lan-gridge, H. Stenner, S. Christofferson, A. Tucker, R. Armijo, B. Meyer, J. B. Chabalier, W. Lettis, W. Page, and J. Bachhurber (2000). The August 17, 1999 I˙zmit earthquake, M⳱7.4, eastern Marmara region, Turkey: study of surface rupture and slip distribution, in The 1999
I˙zmit and Du¨zce Earthquakes: Preliminary Results, A. Barka, O.
Ko-zaci, and S. Akyuz (Editors), Istanbul Technical University, Istanbul, 15–30.
Clark, M. M. (1972). Surface rupture along the Coyote Creek fault in The
Borrego Mountain Earthquake of April 9, 1968, U.S. Geol. Surv. Pro-fess. Pap. 787, 55–86.
Hartleb, R. D., J. F. Dolan, S. Akyuz, T. E. Dawson, A. Z. Tucker, B. Yerli, T. K. Rockwell, E. Toraman, Z. Cakir, A. Dikbas, and E. Altunel (2002). Surface rupture and slip distribution along the Karadere seg-ment of the 17 August 1999 I˙zmit, Turkey, earthquake, Bull. Seism.
Soc. Am. (Special Issue on the 1999 I˙zmit and Du¨zce, Turkey,
Earth-quakes, N. Toksoz [Editor]).
Hudnut, K., L. Seeber, T. K. Rockwell, J. Goodmacher, R. Klinger, S. Lindvall, and R. McElwain (1989). Surface ruptures on cross-faults in the 24 November, 1987 Superstition Hills, California, earthquake sequence, Bull. Seism. Soc. Am. 79, no. 2, 282–296.
Langridge, R. M., H. D. Stenner, T. E. Fumal, S. A. Christofferson, T. K. Rockwell, R. D. Hartleb, and A. A. Barka (2002). Geometry and slip distribution of the surface rupture on the Sakarya fault segment during the August 17, 1999 I˙zmit earthquake, Bull. Seism. Soc. Am. Lindvall, S. C., T. K. Rockwell, and K. W. Hudnut (1989). Evidence for
prehistoric earthquakes on the Superstition Hills fault from offset geo-morphic features, Seism. Soc. Am. Bull. 79, no. 2, 342–361. McGill, S. F., and C. M. Rubin (1999). Surficial slip distribution on the
central Emerson fault during the June 28, 1992, Landers earthquake, California, J. Geophys. Res. 104, 4811–4833.
McGill, S. F., and K. E. Sieh (1991). Surficial offsets on the central and eastern Garlock fault associated with prehistoric earthquakes, J.
Geo-phys. Res. 96, 21,597–21,621.
Rockwell, T. K., and C. T. Pinault (1986). Holocene slip events on the southern Elsinore fault, Coyote Mountains, southern California, in
Guidebook and Volume on Neotectonics and Faulting in Southern California, P. Ehlig (Editor), Cordilleran Section, Geol. Soc. Am.
193–196.
Scientists from the U.S. Geological Survey, Southern California Earthquake Center, and California Division of Mines and Geology (Hector Mine Working Group) (2000). Preliminary report on the 16 October 1999 M 7.1 Hector Mine, California, earthquake, Seism. Res. Lett. 71, no. 1, 11–23.
Sharp, R. V. (1982). Comparison of 1979 surface faulting with earlier dis-placements in the Imperial Valley, in The Imperial Valley, California,
Earthquake of October 15, 1979, U.S. Geol. Surv. Profess. Pap. 1254,
213–222.
Sharp, R. V., K. E. Budding, J. Boatwright, M. J. Ader, M. G. Bonilla, M. M. Clark, T. E. Fumal, K. K. Harms, J. J. Lienkaemper, D. M. Morton, J. O. O’Neill, C. L. Ostergren, D. J. Ponti, M. J. Rymer, J. L. Saxton, and J. D. Sims (1989). Surface faulting along the Superstition Hills fault zone and nearby faults associated with the earthquakes of 24 November 1987, Bull. Seism. Soc. Am. 9, no. 2, 252–281. Sieh, K. (1978). Slip along the San Andreas fault associated with the great
1857 earthquake, Bull. Seism. Soc. Am. 68, 1421–1448.
Sieh, K., et al. (1993). Near-field investigations of the Landers earthquake sequence, April to July, 1992, Science 260, 171–176.
U.S Geological Survey (2000). Implications for earthquake risk reduction in the United States from the Kocaeli, Turkey, earthquake of August 17, 1999, U.S. Geol. Surv. Circular 1193, 64.
Weldon, R. J., T. K. Rockwell, and J. McCalpin (1996). Strike-slip fault paleoseismic environments, in Paleoseismology, Geophysics Series, J. McCalpin (Editor), Vol. 62, Academic, New York.
Wells, D. L., and K. L. Coppersmith (1994). New empirical relationships among magnitude, rupture length, rupture width, rupture area, and surface displacement, Bull. Seism. Soc. Am. 84, 974–1002.
Zachariasen, J., and K. Sieh (1995). The transfer of slip between two en echelon strike-slip faults: a case study from the 1992 Landers earth-quake, southern California, J. Geophys. Res. 100, 15,281–15,301.
Earth Consultants International, Inc. 2522 N. Santiago Blvd.
Suite B, Orange, California 92867 (T.K.R., T.D.)
William Lettis & Associates, Inc. 25050 Avenue Kearny
Suite 108
Valencia, California 91355 (S.L.)
U.S. Geological Survey 345 Middlefield Road MS977
Menlo Park, California 94025 (R.L.)
Institute of Geological and Nuclear Sciences P.O. Box 30-368
Lower Hut, New Zealand (R.L.)
William Lettis & Associates, Inc. 1777 Botelho Drive, Suite 262 Walnut Creek, California 94596
(W.L.)
California Institute of Technology Pasadena, California 91125
(Y.K.)