HAL Id: hal-00331124
https://hal.archives-ouvertes.fr/hal-00331124
Submitted on 4 Jul 2006HAL is a multi-disciplinary open access
archive for the deposit and dissemination of sci-entific research documents, whether they are pub-lished or not. The documents may come from teaching and research institutions in France or abroad, or from public or private research centers.
L’archive ouverte pluridisciplinaire HAL, est destinée au dépôt et à la diffusion de documents scientifiques de niveau recherche, publiés ou non, émanant des établissements d’enseignement et de recherche français ou étrangers, des laboratoires publics ou privés.
Assessment of the impact of TS assimilation from
ARGO floats in the Mediterranean Sea
A. Griffa, Anne Molcard, F. Raicich, V. Rupolo
To cite this version:
A. Griffa, Anne Molcard, F. Raicich, V. Rupolo. Assessment of the impact of TS assimilation from ARGO floats in the Mediterranean Sea. Ocean Science Discussions, European Geosciences Union, 2006, 3 (4), pp.671-700. �hal-00331124�
OSD
3, 671–700, 2006 Assessment of the impact of TS assimilation from ARGO floats A. Griffa et al.Title Page Abstract Introduction Conclusions References Tables Figures J I J I Back Close
Full Screen / Esc
Printer-friendly Version Interactive Discussion
Ocean Sci. Discuss., 3, 671–700, 2006 www.ocean-sci-discuss.net/3/671/2006/ © Author(s) 2006. This work is licensed under a Creative Commons License.
Ocean Science Discussions
Papers published in Ocean Science Discussions are under open-access review for the journal Ocean Science
Assessment of the impact of TS
assimilation from ARGO floats in the
Mediterranean Sea
A. Griffa1,5, A. Molcard2, F. Raicich3, and V. Rupolo4
1
CNR, ISMAR/La Spezia, Italy
2
LSEET, Univ. Toulon, France
3
CNR, ISMAR/Trieste, Italy
4
ENEA, Casaccia, Roma, Italy
5
RSMAS, University of Miami, FL, USA
Received: 2 May 2006 – Accepted: 1 June 2006 – Published: 4 July 2006 Correspondence to: A. Griffa ([email protected])
OSD
3, 671–700, 2006 Assessment of the impact of TS assimilation from ARGO floats A. Griffa et al.Title Page Abstract Introduction Conclusions References Tables Figures J I J I Back Close
Full Screen / Esc
Printer-friendly Version Interactive Discussion
Abstract
In this paper, the impact of assimilating Temperature (T) and Salinity (S) profiles from Argo floats in the Mediterranean Sea (MEDARGO) is quantitatively investigated us-ing the Observus-ing System Simulation Experiments (OSSE) approach. The impact of varying the number of floats and their launch positions is considered, using numerical
5
simulations with a MOM model and a reduced-order multivariate Optimal Interpolation scheme (SOFA) for assimilation. Realistic launch positions used during the first MF-STEP phase are considered, as well as “ideal” positions that can be envisioned for the future, along the VOS tracks. The most effective float trajectories are identified, show-ing that frontal regions play a major role, and that it is crucial to maintain a sufficient
10
coverage of them. In addition to this, also a qualitative comparison is performed be-tween the results obtained from MEDARGO floats in ideal conditions and results from “ideal” profiles taken along the VOS (Volunteer Observing Ships) tracks, as for the XBT (Expandable Baththermograph) data.
1 Introduction
15
The main objective of the MFSTEP Project is the development of an operational fore-casting system for the Mediterranean Sea, based upon a Near Real Time (NRT) ob-serving system and a numerical model forecasting system. The data provided by the observing system are assimilated in the numerical models, allowing for the forecasting capabilities. In this framework, understanding the impact of different measuring
plat-20
forms in terms of sampling schemes and assimilation methods is of crucial importance. The Observing System Simulation Experiments (OSSE) (Arnold and Day, 1986; Kin-dle, 1986) play an important role in assessing and comparing the usefulness of the various platforms, sampling strategies and data combinations which can be adopted in the observing system.
25
OSD
3, 671–700, 2006 Assessment of the impact of TS assimilation from ARGO floats A. Griffa et al.Title Page Abstract Introduction Conclusions References Tables Figures J I J I Back Close
Full Screen / Esc
Printer-friendly Version Interactive Discussion
and salinity S profiles provided by autonomous profiling floats have been tested and are presently operationally implemented. The floats, referred to as MEDARGO, are part of the global ocean Argo project (Poulain, 2005;http://www.argo.ucsd.edu) which plays a major role in the global ocean observing system. Argo aims to provide a world-wide continuous monitoring of the temperature, salinity, and velocity of the upper ocean,
5
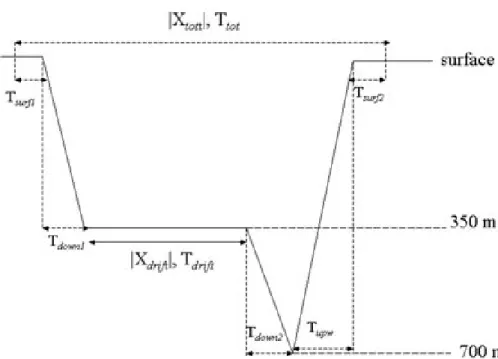
with all data being relayed and made publicly available within hours after collection. Argo floats are programmed to freely drift at a given nominal depth for a time interval of the order of days, then resurfacing to comunicate via satellite information on TS profiles and on positions. In particolar, for MEDARGO floats the repetitive cycle is performed over a period of approximately 5 days (Fig. 1): the floats descend to the
10
prescribed neutral depth of 350 m, drift at that level and then dive down to about 700 m before ascending to the surface while collecting TS data. During their short period at the surface, the profilers are located by, and the data are telemetered to, the satellite Argos system. The nominal depth of 350 m is chosen to maximize information on the very important LIW (Levantine Intermediate Water) water mass, whose core is
15
approximately located at that depth.
TS profile information from Argo floats are presently assimilated in a number of oper-ational systems (http://www.argo.ucsd.edu/FrUse by Operational.html). In the Mediter-ranean Sea they provide, together with the XBT (Expandable Bathythermograph) data collected along the Volunteer Observing Ship (VOS) tracks (Manzella et al., 2003),
20
the backbone of the data assimilation and forecast system at basin scale (Demirov et al., 2003). Since the Mediterranean Sea has a particularly strong salinity contribution to density, the combined observation of temperature and salinity profiles is expected to be of particular relevance.
The objective of the present work is to quantitatively investigate the impact of
as-25
similating TS from MEDARGO floats in the Mediterranean Sea, and to identify which launch positions appear particularly effective. As such, the work is intended to con-tribute to future planning of sampling strategies for the Mediterranean Sea. The OSSE approach is followed, where the “true” ocean state is assumed known and represented
OSD
3, 671–700, 2006 Assessment of the impact of TS assimilation from ARGO floats A. Griffa et al.Title Page Abstract Introduction Conclusions References Tables Figures J I J I Back Close
Full Screen / Esc
Printer-friendly Version Interactive Discussion
by a reference simulation from which synthetic data are extracted. The advantage of this approach is that it allows a quantitative assessment of the data assimilation since the truth is known. The disadvantage is that synthetic data are used which are com-pletely compatible with the models so that the results might be optimistic with respect to assimilation of real in-situ data. Despite this limitation, OSSEs provide a very useful
5
tool and they have been widely used to assess the quality of observing systems in the atmosphere (e.g. Arnold and Dey, 1986; Rohaly and Krishnamurti, 1993) and in the ocean (Kindle, 1986; Bennett, 1990; Barth and Wunsch, 1990; Hernandez et al., 1994; Hackert et al., 1998; Raicich and Rampazzo, 2003; She et al., 2006).
The present application builds on a previous work performed in the Mediterranean
10
Sea in the framework of the MFSPP (Mediterranean Forecasting System Pilot Project) project (Raicich and Rampazzo, 2003) focused on assessing the impact of assimilating XBT data. The same methodology as in Raicich and Rampazzo, (2003) is used. The Mediterranean GCM (General Circulation Model) used as a basis for the simulations is MOM at 1/8◦, i.e. the model operationally used in MFSPP and in the first year of
15
MFSTEP. the assimilation system is the same as presently used in MFSTEP, based on the reduced-order multivariate Optimal Interpolation scheme SOFA (System for Ocean Forecasting and Analysis), documented in De Mey (1994, 1997), De Mey and Benki-ran, 2002).
In order to focus on the impact of TS profiles from MEDARGO floats, their
assim-20
ilation is considered in isolation, i.e. without the contribution of other data platforms present in the Mediterranean Sea. The impact of varying the number of floats and their launch positions in considered, using a bivariate data assimilation for TS. Real-istic launch positions used during the first MFSTEP phase are considered, as well as “ideal” positions that can be envisioned for the future, along the VOS tracks. The most
25
effective float trajectories are identified, and related to the dynamical characteristics of the flow. In addition to this, also a qualitative comparison is performed between the results obtained from MEDARGO floats in ideal conditions and results from “ideal” profiles taken along the VOS tracks, as for the XBT data.
OSD
3, 671–700, 2006 Assessment of the impact of TS assimilation from ARGO floats A. Griffa et al.Title Page Abstract Introduction Conclusions References Tables Figures J I J I Back Close
Full Screen / Esc
Printer-friendly Version Interactive Discussion
The paper is organized as follows. The general methodology used in this work is described in Sect. 2, while in Sect. 3 the specific characteristics of the experiments are provided. The experiment results are reported in Sect. 4, and a brief summary and conclusions are given in Sect. 5.
2 Methodology
5
The OSSE methodology used here is based on the identical twin experiment approach, which uses synthetic numerically simulated data instead of real in-situ ones for the assimilation task. The Mediterranean GCM used for the simulations is a version of the Geophysical Fluid Dynamics Laboratory MOM-1 (Pacanowski et al., 1990), having 1/8◦ horizontal resolution and 31 vertical levels. Model details and setup can be found in
10
Korres et al. (2000) and Demirov et al. (2003). The model is forced by ECMWF 6-hourly operational analyses of 10 m-wind and 2 m-air temperature, used also in the surface heat flux calculation. Surface salinity is relaxed to the MED6 climatology (Brasseur et al, 1996; Fichaut et al., 1998).
Three main simulations are performed for each set of experiments: the Control run,
15
which represents the “true ocean” state, and from which the synthetic data are ex-tracted; the Assimilation run, which is initialized from different initial conditions from the Control run, to represent our incomplete knowledge of the true state of the ocean, and in which the data from the Control are assimilated; the Free run, which is initialized as the Assimilation run but without data assimilation. The latter provides a reference
sim-20
ulation, where the “wrong” initial conditions evolve according to forcing and dynamics. All runs are driven by the same external forcing.
Synthetic floats are launched in the Control and advected by the numerical velocity field, using cycle parameters in the same range as for real in-situ MEDARGO floats. The Lagrangian integration is performed using the off-line Ariane algorithm (Blanke et
25
al., 1999) modified in order to simulate the MEDARGO cycle. A typical MEDARGO cycle is shown in Fig. 1. Floats drift at the prescribed depth of 350 m for a time period
OSD
3, 671–700, 2006 Assessment of the impact of TS assimilation from ARGO floats A. Griffa et al.Title Page Abstract Introduction Conclusions References Tables Figures J I J I Back Close
Full Screen / Esc
Printer-friendly Version Interactive Discussion
Tdrift ∼5.3 days. They then dive down to 700 m with a vertical downward velocity of 5 cm/s, and ascend to the surface with an upward velocity of 10 cm/s, while collecting T/S data. They then spend 6 h drifting at the surface, before descending to 350 m and repeating the cycle.
Salinity and temperature profiles are provided at each cycle at the location of the
5
floats, and these profiles extracted from the Control run are considered as our real data and assimilated in the Assimilation run.
Data assimilation is performed by means of the System for Ocean Forecasting and Analysis (SOFA) which is described in details by De Mey (1994, 1997) and De Mey and Benkiran (2002). SOFA is a reduced-order multivariate optimal interpolation scheme.
10
The order reduction is achieved by projecting the state vector onto vertical EOFs, that represent the eigenvectors of the error covariance matrix for the forecast. The scheme is multivariate in terms of both data input and corrections on the model output.
The OSSEs are based on a sequence of 5-day assimilation cycles. Temperature and salinity assimilation is performed using vertical bivariate EOFs, computed from a
15
1993–1999 GCM run according to Sparnocchia et al. (2003). The data error covari-ance radius is 10–6 km and the e-folding time is 10–6 days, implying that the data are uncorrelated with each other. The forecast error covariance radius is 45 km and e-folding time is 105 days, which results in giving all the data within the assimilation window practically the same weight.
20
The success of the assimilation is quantified in terms of the convergence of the As-similation run towards the Control. In other words, a successful data asAs-similation is expected to correct the “wrong” initial conditions, driving the ocean state toward the “truth”. The convergence of the Assimilation run towards the Control run is assessed by means of standard deviations of differences (of the concerned variables) between
25
the two runs (Miyakoda et al., 1969). Standard deviations, which are computed using the anomalies relative to the spatial means, are adopted instead of root-mean-squared differences, computed with the full fields, since they are more sensitive to data assimi-lation (Raicich and Rampazzo, 2003). In order to uniform the performance errors when
OSD
3, 671–700, 2006 Assessment of the impact of TS assimilation from ARGO floats A. Griffa et al.Title Page Abstract Introduction Conclusions References Tables Figures J I J I Back Close
Full Screen / Esc
Printer-friendly Version Interactive Discussion
comparing different simulations, the standard deviations of the Control minus Assimila-tion is normalized by the corresponding s.d. for the Free run, used for reference since it shows the ability of the model to converge toward the Control due to the atmospheric forcing only.
Standard deviations are computed for the Western Mediterranean (Alboran Sea,
Al-5
gerian Current region, Gulf of Lions, Tyrrhenian Sea and northern Sicily Channel) and Eastern Mediterranean (southern Sicily Channel, Adriatic Sea, Ionian Sea, Aegean Sea and Levantine Basin), and in three layers, defined as follows: L1, which includes 10 model levels from 5 to 240 m depth roughly corresponds to the surface waters; L2, including 4 levels from 280 to 400 m approximately corresponds to the Levantine
Inter-10
mediate Water (LIW) layer; L3, including 17 levels from 440 m to the sea bottom. The numerical experiments use a basin-wide approach since the data assimilation setup is not optimized regionally, therefore, the sampling strategy assessment is mainly per-formed using results obtained for each Mediterranean sub-basin, namely Western and Eastern.
15
3 OSSE experiments
The OSSE configuration has been first tested in a number of preliminary experiments. Three main experiments have then been performed and they are reported here.
In the first two experiments, 47 SUMMER and 47 WINTER, an “idealized” situation with respect to the actual launchings during MFSTEP is considered. A total of 47 floats
20
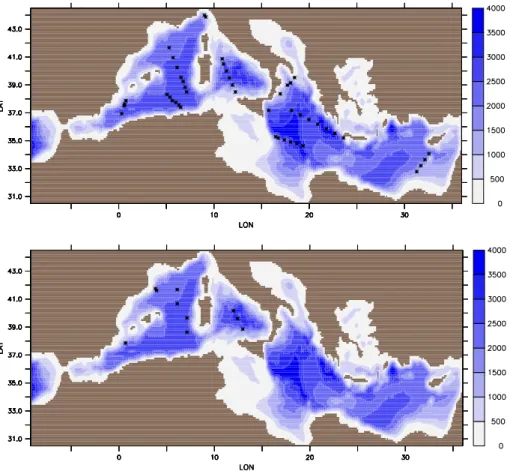
are launched, which is approximately double than the total number of MEDARGO floats launched during MFSTEP (about 23). It can therefore be considered as a realistic upper limit for a future sampling strategy in the Mediterranean Sea. The floats are launched along VOS tracks, considering a summer and a winter situation respectively. The launching sites (Fig. 2a) are evenly spaced along the VOS tracks where the depth
25
is greater than 700 m. VOS tracks are envisioned to be used in the future for operational MEDARGO launchings, and the OSSE results will help determining which tracks are
OSD
3, 671–700, 2006 Assessment of the impact of TS assimilation from ARGO floats A. Griffa et al.Title Page Abstract Introduction Conclusions References Tables Figures J I J I Back Close
Full Screen / Esc
Printer-friendly Version Interactive Discussion
the most “useful”, i.e. which ones lead to more consistent assimilation correction. In the third experiment, 10 SUMMER, 10 floats are launched, considering the same launching sites (Fig. 2b) as for the in-situ MFSTEP MEDARGO floats deployed between June and October 2004. Notice that these initial test launches, performed mostly from research vessels, are all situated in the Western Mediterranean Sea, so that the
cover-5
age there is approximately half than for the 47 SUMMER experiment (while of course there is no coverage in the Eastern basin). This experiment will provide insights on the assimilation impact of the initial MFSTEP sampling at least in the Western Mediter-ranean.
The two seasonal configurations SUMMER and WINTER are defined according to
10
the initial state of the ocean, and each experiment lasts for 60 days, corresponding to 12 assimilation cycles. The summer OSSE Controls are initialized on 1 September 1999, while the winter OSSE controls are initialized on 1 February 2000. Free and As-similation runs are initialized on 1 September 1998 for the summer and on 1 February 1999 for winter. All the initialization fields are taken from an interannual simulation with
15
data assimilation forced by ECMWF 6-hourly analyses.
The results of the idealized experiments with 47 floats are compared with results of “idealized VOS” experiments, obtained assimilating profiles along the VOS tracks with a total coverage approximately double with respect to the actual MFSTEP XBT coverage (Raicich, 2006). The comparison provide comparative information on different data
20
platforms.
4 Results
4.1 Idealized sampling experiments
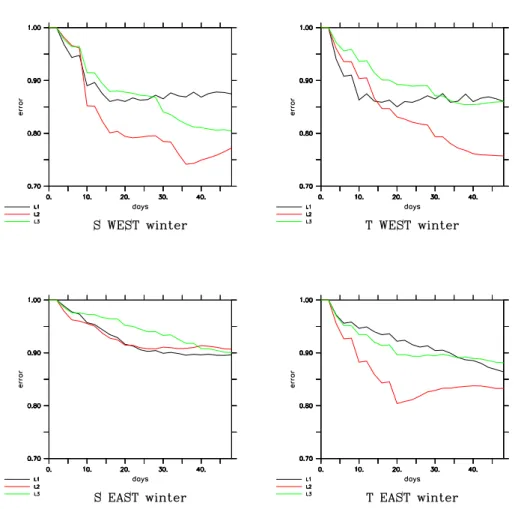
Results obtained for the 47 WINTER and 47 SUMMER experiments are summarized in terms of relative errors versus time in Figs. 3 and 4, respectively. The relative error
25
OSD
3, 671–700, 2006 Assessment of the impact of TS assimilation from ARGO floats A. Griffa et al.Title Page Abstract Introduction Conclusions References Tables Figures J I J I Back Close
Full Screen / Esc
Printer-friendly Version Interactive Discussion
error (Free-Control), and it quantifies the improvement over the Free run due to the data assimilation.
Figs. 3 and 4 show the errors for T and S for both the Western and Eastern basins and for the three layers L1, L2 and L3. As it can be seen, the assimilation is successful in all cases, providing a decrease in the assimilation error, especially marked during the
5
first two assimilation cycles. Final assimilation errors reach minimum values of 75%, indicating an error reduction of 20–30%.
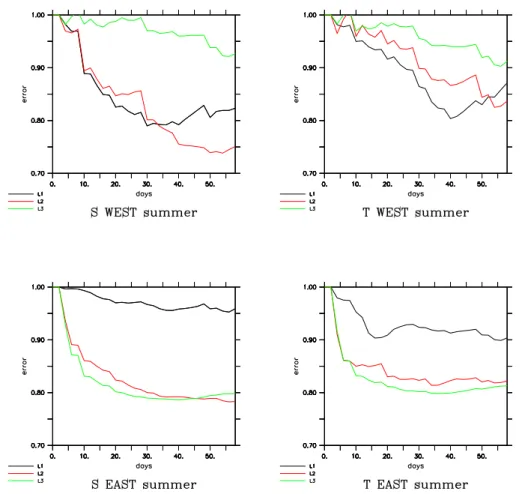
During winter, the best results are obtained for the intermediate layer L2, and also in summer the L2 correction is always significant. This is probably due to the fact that the temperature and salinity gradients connected with the Levantine Intermediate
10
Water (LIW) fronts are well marked in all seasons. We will come back on this point in the following, when analyzing specific examples of T and S fields. L1 corrections are not always as effective as for L2, possibly because of the higher temporal and spatial variability of the surface fronts.
An important question to be addressed is which trajectories contribute the most to
15
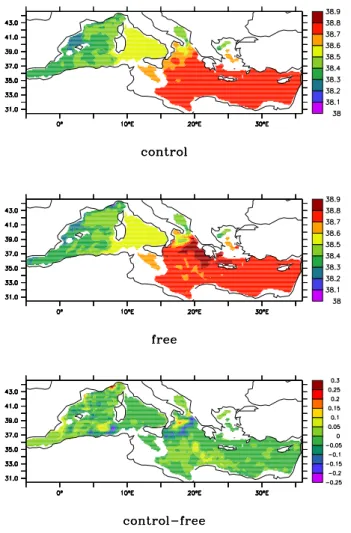
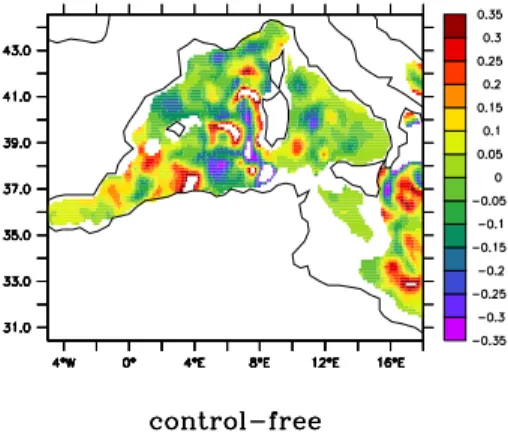
the error reduction. In order to illustrate this point, we consider a specific case of salinity S assimilation for 47 WINTER, than can be considered as “typical”. Maps of S for the the Control and the Free runs are shown in Figs. 5a, b at 400 m (i.e. at the basis of the second level L2) and at t=35 days, i.e. after that the errors (Fig. 4) have reached an approximately steady level. The difference between the two fields (illustrated by the
20
misfit in Fig. 5c) is due to the persistent effect of the different initial conditions of the two runs, and it is especially evident in correspondence to the main fronts between water masses. A front between the LIW and the less salty water of Adriatic origin is clearly visible South of the Otranto Strait in the Ionian Sea. In the Free run the penetration of Adriatic water is more enhanced than in the Control. An other strong front is present
25
West of the Sardinia Channel, dividing the western water from the more saline Eastern water influenced by the LIW advection. The different mesoscale structure of the front in the Control and in the Free runs determines a strong misfit in this area. Finally, a third area of strong misfit can be noticed close to the Northwestern coast. This is probably
OSD
3, 671–700, 2006 Assessment of the impact of TS assimilation from ARGO floats A. Griffa et al.Title Page Abstract Introduction Conclusions References Tables Figures J I J I Back Close
Full Screen / Esc
Printer-friendly Version Interactive Discussion
due to an upwelling event which is not correctly represented by the Free run.
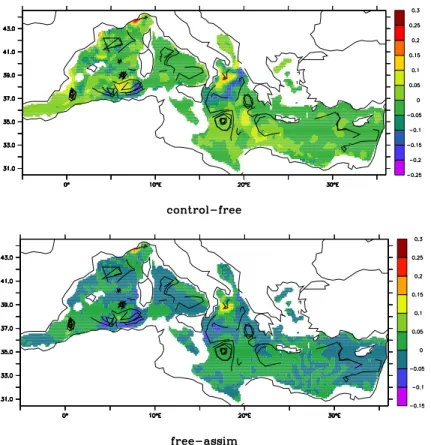
The float trajectories are shown in Fig. 6a superimposed on the (Control-Free) misfit. As it can be seen the two main fronts in the Ionian Sea and in the Sardinia Channel are well sampled, and also the misfit area in the North West is sampled by one trajectory. We expect that these trajectories, sampling the areas of maximum misfit, will be the
5
ones that will contribute the most to the assimilation.
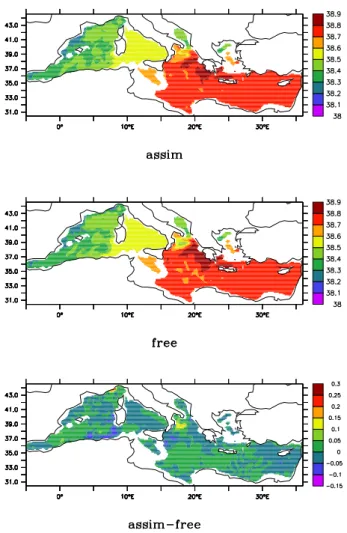
In order to confirm this hypothesis, we compare the S distribution for the Assimila-tion and Free runs at the same depth and time as for the Control (Figs. 7a, b). The differences between Assimilation and Free (Fig. 7c) are expected to be indicative of the effect of the assimilation, correcting the “wrong” initial conditions. The maximum
10
misfit values for (Assimilation-Free) (Fig. 7c) occur indeed in the same areas as for (Control-Free) (Fig. 5c) and they have the same sign, indicating that the assimilation is correcting the initial conditions and causing a convergence toward the Control.
Superposition of the trajectories to the misfit (Assilimation-Free) (Fig. 6b) clearly shows that the main assimilation impact is due to the trajectories in the front regions,
15
as hypothesized above, while trajectories in the other regions contribute only marginally to the error reduction.
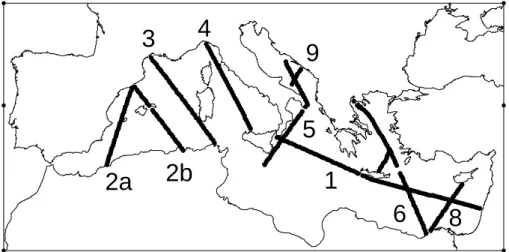
The VOS tracks from which front trajectories have been launched are mainly two (Fig. 2): the track in the Ionian Sea (track 5, see Fig. 10) and the track in the Algerian basin (track 2, see Fig. 10). In the specific example of Figs. 5–7, also the first trajectory
20
of the track in the Liguro/Tyrrhenian Sea (track 4) contributes significantly, but this is more episodic and related to an upwelling event rather than to a permanent water mass front.
Results for temperature maps (not shown) are qualitatively similar. This is not sur-prising, given that the main fronts of T and S approximately coincide at intermediate
25
depth, given that the LIW is characterized by salty and warm water. Also for the sum-mer experiment, 47 SUMMER, at intermediate depth the situation is qualitatively simi-lar, since the fronts are persistent in both seasons.
OSD
3, 671–700, 2006 Assessment of the impact of TS assimilation from ARGO floats A. Griffa et al.Title Page Abstract Introduction Conclusions References Tables Figures J I J I Back Close
Full Screen / Esc
Printer-friendly Version Interactive Discussion
Western basin, where the main gradients of T and S occur West of the Sardinia Chan-nel. As for L2, a well defined front exists between the fresher and cooler water of Atlantic origin and the saltier and warmer Mediterranean water. This leads to a con-sistent correction of T and S in L1 during both winter (Fig. 3) and summer (Fig. 4). In the Eastern basin, instead, the persistent gradient with the Adriatic water which
char-5
acterizes L2 is not present in L1. The main gradients and the more marked differences between Control and Free occur in the Levantine basin and, especially for T in summer, close to the coast. These fronts are not as persistent and well defined as in L2, and they are not consistently sampled from trajectories from a given track. Also, the fronts are not necessarily occurring simultaneously in both T and S. As a consequence, the
10
assimilation in L1 does not appear as effective as in L2, especially in summer.
The VOS tracks that correspond to the most effective trajectories are track 2 in the Western basin, as for L2, and track 1 in the Eastern basin.
4.2 Real sampling experiment
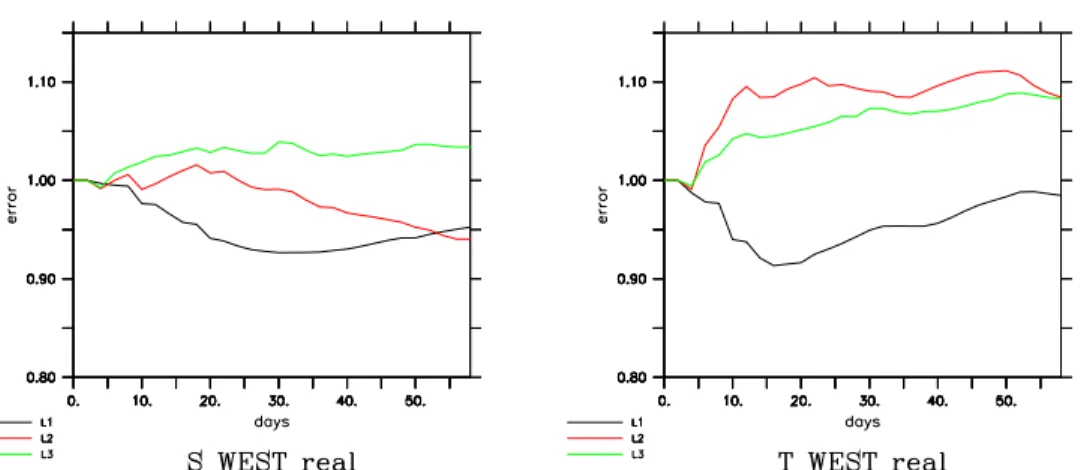
The results of 10 SUMMER are summarized in Fig. 8 in terms of relative errors for T
15
and S versus time. Only the Western basin statistics are reported given that all the floats have been launched there (Fig. 2b).
The results show that the assimilation correction is not as effective with this reduced sampling. The S errors maintain greater than 90%, while the T errors show a temporary increase, especially at intermediate level L2. In order to understand the reasons for this
20
increase, we compare the maps of the misfits (Control-Free) and (Assimilation-Free) (Figs. 9a, b), computed for T at 400 m. The scales are chosen to be the same for both misfits, to facilitate the comparison, and white regions in Fig. 9a indicate areas off scale, i.e. with greater values. The trajectories are superimposed on the (Assimilation-Free) map (Fig. 9b). Notice the presence of a negative eddy anomaly South-West of
25
Sardinia in (Control-Free) (Fig. 9a) , which corresponds to a positive eddy anomaly in (Assimilation-Free) (Fig. 9b). This indicates that the assimilation tends to correct in the opposite direction with respect to the Control, therefore increasing the error instead of
OSD
3, 671–700, 2006 Assessment of the impact of TS assimilation from ARGO floats A. Griffa et al.Title Page Abstract Introduction Conclusions References Tables Figures J I J I Back Close
Full Screen / Esc
Printer-friendly Version Interactive Discussion
reducing it. This “wrong” positive anomaly in (Assimilation-Free) is likely to be due to the propagation of an initially correct anomaly due to the trajectory launched West of the tip of Sardinia (Fig. 2b). This trajectory in fact samples regions of positive anomaly in (Control-Free), situated just North Est of the negative eddie. The propagation of the correction, combined with the fact that the negative eddy is not sampled by any
5
trajectory, causes the “wrong” correction of the assimilation. This does not happen in the surface layer L1 (not shown), probably because the advection is different in L1.
In conclusion, the results of experiment 10 SUMMER indicates that the assimilation is not as effective for reduced sampling, especially in the frontal zones, and it can lead to spurious corrections and possible temporary error increases.
10
4.3 Comparison with idealized VOS experiments
It has been shown in Sect. 4.1 that with the idealized sampling, corresponding to ap-proximately twice the real deployment strategy during MFSTEP, the TS assimilation from the MEDARGO floats can significantly improve the forecast. In order to complete the assessment, these results are compared with assimilation from profiles along the
15
VOS tracks, as for the XBTs data (Manzella et al., 2003). The assimilation of VOS data differ from that of MEDARGO data by some elements, namely: a) the assimilation cycle is 7-day long instead of 5; b) corrections on T and S are computed every two cycles instead of every cycle; c) past and future data within a 14-day window are assimilated (smoother mode) instead of past data only (filter mode). More details can be found in
20
Raicich (2006).
For the sake of comparison, both Temperature and Salinity are assimilated, as if expandable CTDs (XCTDs) were available instead than XBT. For consistency, the “idealized VOS” sampling is chosen to correspond to approximately the double of the present MFSTEP sampling. This is achieved maintaining the same spatial design as
25
in MFSTEP, based upon the tracks in Fig. 10 sampled every 12 nautical miles with a maximum depth profile of 770 m, while the time coverage is assumed regular and more frequent than in reality. All tracks are covered once a week except tracks 2a and
OSD
3, 671–700, 2006 Assessment of the impact of TS assimilation from ARGO floats A. Griffa et al.Title Page Abstract Introduction Conclusions References Tables Figures J I J I Back Close
Full Screen / Esc
Printer-friendly Version Interactive Discussion
7a, covered only in the odd weeks, and 2b and 7b, covered only in the even weeks. The resulting total number of profiles available per week is approximately 100 in the Western basin and 200 in the Eastern basin, and it is approximately twice the num-ber of observations performed in the Mediterranean Sea in summer 2004 and 2005 (Raicich, 2006). By comparison, the idealized MEDARGO experiments are
character-5
ized by a significantly smaller number of profiles (approximately 65 per week over the whole Mediterranean Sea), but these profiles are obtained along trajectories, i.e. ap-proximately following the flow, rather than along fixed tracks.
Figure 11 depicts the relative error computed with the two assimilation strategies, for the summer period in the three layers. Analogous results are obtained for the winter
10
(not shown). For simplicity, we focus on the Salinity error in the Eastern basin (left panels) and on the Temperature error in the Western basin (right panels), since T and S appear to be the respectively the most relevant active tracers in the Western and Eastern basin (Raicich, 2006). At first glance, the relative error plots show for all experiments, in all layers, an improvement of the forecast, and the error reduction with
15
floats and XCTDs are consistent.
In the Eastern basin (left panels), the improvement of the assimilation with MEDARGO floats is better in the middle and lower layers with respect to the surface, as already notice Sect. 4.1, due to high gradients present at surface in regions where no data are present (Eagean Sea). For the XCTDs on the VOS tracks, data are collected
20
also in the Eagean Sea (track 6 in Fig. 10), and the error is indeed lower in L1.
In the Western basin (right panels), the main difference between the error evolutions is the ability of the MEDARGO floats to continuously correct the forecast when time is increasing, as if they were able to target and follow the frontal regions.
In conclusion, MEDARGO floats seem as efficient as XCTDs on VOS tracks if a
25
sufficient number is considered. VOS XCTD experiments are characterized by a lo-cally higher horizontal resolution (12 nautical miles), which though is limited to along-track regions. It appears that spatially sparser profiles from floats can be as efficient, probably because they approximately follow flow features. Also, it should be noticed
OSD
3, 671–700, 2006 Assessment of the impact of TS assimilation from ARGO floats A. Griffa et al.Title Page Abstract Introduction Conclusions References Tables Figures J I J I Back Close
Full Screen / Esc
Printer-friendly Version Interactive Discussion
that, even though in these idealized VOS experiments Salinity has been assimilated, expandable CTDs are not yet available, and only Temperature is a real observable variable. This could represent a further argument for MEDARGO floats observations advantage, which are currently able to give both T and S profiles.
5 Summary and conclusions
5
OSSE experiments have been performed to investigate the impact of assimilating TS profiles from MEDARGO floats with different sampling strategies. Two sets of experi-ments consider the case of 47 floats over the whole Mediterranean Sea, approximately the double as in the present MFSTEP plan, launched along VOS tracks in the winter and summer season respectively. A third experiment consider the actual launching
10
sites used during the MFSTEP 2004 summer releases, accounting for a total of 10 floats in the Western Mediterranean Sea.
Results for the experiments with 47 floats show that the TS assimilation is effective, with error reductions up to 20–30%. The most effective trajectories are the ones sam-pling frontal regions dividing different water masses, since even small differences in the
15
mesoscale structure of the fronts can account for a significant portion of the error. For the intermediate layer L2, the most prominent and permanent fronts are observed in the Ionian Sea close to the Otranto Strait (dividing the LIW from the Adriatic water) and West of the Sardinia Channel, (dividing the modified LIW from the water of Atlantic ori-gin). Trajectories sampling these regions are launched along the Ionian track, track 5,
20
and along the Algerian basin track, track 2, respectively . For the surface layer L1, a front similar to the one in L2 is observed West of the Sardinia Channel, while the Ionian Sea front is absent. Less permanent and less defined fronts are observed in the Lev-antin basin and near the coast, leading to a smaller error reduction in L1 with respect to L2, especially in summer. The trajectories sampling the Levantine basin fronts are
25
originated along the Levantine track, track 1.
OSD
3, 671–700, 2006 Assessment of the impact of TS assimilation from ARGO floats A. Griffa et al.Title Page Abstract Introduction Conclusions References Tables Figures J I J I Back Close
Full Screen / Esc
Printer-friendly Version Interactive Discussion
sites show a reduced impact of the assimilation. In some cases, the error can actually increase, at least temporarily, due to events where local corrections propagate dynam-ically, affecting regions that are not sufficiently sampled. If these regions are highly inhomogeneous with eddy anomalies of different signs, the correction propagation can result in corrections of the wrong sign and therefore in an error increase.
5
The OSSE results for float assimilation are in good agreement with results obtained for TS assimilation from XCTDS’s along VOS tracks (Raicich, 2006). When considering an approximately double sampling with respect to the actual XBT MFSTEP plan, a VOS track assimilation is found to be effective with error reduction of 20–30% and the most effective tracks are found to be track 2 and track 5 especially for L2, as for the
10
MEDARGO experiments with 47 floats. Notice that the VOS XCTD experiments have a significantly higher horizontal resolution along tracks, resulting in a higher number of total profiles assimilated per week. This suggests that profiles from floats, even though sparser, can be particularly effective, probably because they approximately follow flow features
15
In summary, the OSSE results show that frontal regions play a major role, as it can be expected, and that it is crucial to maintain a sufficient coverage of them. A higher sampling than in the present MFSTEP is desirable, but if the number of floats cannot be increased, it might be better at least to concentrate them in the frontal areas.
These results should be considered as useful suggestions, even though of course
20
they are only indicative of the whole prediction problem. The OSSE experiments pre-sented here, in fact, focus on errors related to incomplete knowledge of the initial state of the ocean, and are targeted to forecasting mesoscale anomaly structures. Possible biases in the solutions, model errors, incomplete knowledge of parameterizations and forcings are not considered here, and they might play an important role in practical
25
applications.
We conclude with a discussion on the potential and future perspectives of assimi-lating data from MEDARGO floats. We recall that, even though the present paper is focused on TS profile data, Argo floats provide also information on positions, which are
OSD
3, 671–700, 2006 Assessment of the impact of TS assimilation from ARGO floats A. Griffa et al.Title Page Abstract Introduction Conclusions References Tables Figures J I J I Back Close
Full Screen / Esc
Printer-friendly Version Interactive Discussion
linked to drift and therefore to velocity. While TS information are presently routinely assimilated in operational systems, position assimilation is still under experimentation and testing. A method for position assimilation have been recently developed (Molcard et al., 2005, Taillandier et al., 2006a) and implemented in a realistic Mediterranean Sea model (Taillandier et al., 2006b, Taillandier and Griffa, 2006). Even though the setting is
5
different from the one considered here, a qualitative comparison can be drawn between twin experiment results for TS and position assimilation with similar data coverage. Re-sults appear compatible, with similar values for the global error, even though at a more detailed level, the assimilation of positions seems to be more effective than the TS as-similation, especially for low (realistic) coverage. The correction in fact appears more
10
consistent, and even though error oscillations due to correction propagation are occa-sionally present, they appear significantly reduced with respect to TS assimilation. This might be due to the fact that position assimilation leads to velocity correction, which is conceptually related (though geostrophy) to TS gradients. So, a conceptually higher order correction is introduced. Also, and more specifically, the method developed in
15
Molcard et al. (2005) and Taillandier et al., (2006a, b) implies corrections of the velocity field balanced by corrections of the mass field, i.e. of TS. This correction is expected to provide more dynamically balanced results than the correction of TS only.
Regarding regions of most effective sampling, both types of assimilations indicate that the most effective floats are in regions of maximum variability, since the correction
20
there is expected to be the highest. Unfortunately, not always regions of high velocity variability correspond to strong gradients in TS, or viceversa. It would appear then that there could be a conflict in setting up a best sampling criterium, since it could depend on the specific variable which is considered. On the other hand, it should be considered that the error measurement we have used is restricted, since it is integrated and only
25
reflects the size of the correction of a specific variable. It is likely that correcting the TS distribution in regions where it does not greatly contribute to the TS metric, might contribute to the correction of the other state variables like velocity and viceversa.
OSD
3, 671–700, 2006 Assessment of the impact of TS assimilation from ARGO floats A. Griffa et al.Title Page Abstract Introduction Conclusions References Tables Figures J I J I Back Close
Full Screen / Esc
Printer-friendly Version Interactive Discussion
of TS and position information should be done simultaneously using a multivariate approach in order to effectively extract all the possible dynamical information. This is expected to be especially helpful in the case of small scale structures (whose curvature is only partially resolved by the position information) with a well defined water mass signature, or in case of energetic boundary current with a reduced TS signal. Strong
5
frontal areas are expected to contribute to both TS and velocity corrections, therefore providing especially effective launching sites.
Acknowledgements. This work was supported by the European Commission (V Framework
Program-Energy, Environment, and Sustainable Development) as part of the MFSTEP Project (contract number EVK3-CT-2002-00075).
10
References
Arnold, C. P., Jr. and Dey, C. H.: Observing-system simulation experiments: Past, present and future, Bull. Amer. Meteor. Soc., 67, 687–695, 1986.
Barth, N. and Wunsch, C.: Oceanographic experiment design by simulated annealing, J. Phys.
15
Oceanogr., 20, 1249–1263, 1990.
Bennett, A. F.: Inverse methods for assessing ship-of-opportunity networks and estimating circulation and winds from tropical expendable bathythermograph data, J. Geophys. Res., 95, 16 111–16 148, 1990.
Blanke, B., Arhan, M., Madec, G., and Roche, S.: Warm water paths in the Equatorial Atlantic
20
as diagnosed with a General Circulation Model, J. Phys. Oceanogr. 29, 2753–2768, 1999. Brasseur, P., Beckers, J. M., Brankart, J. M., and Schoenauen, R.: Seasonal temperature and
salinity fields in the Mediterranean Sea: Climatological analyses of an historical data set, Deep-Sea Res., 43, 159–192, 1996.
De Mey, P.: Optimal interpolation in a model of the Azores current in 1986–88, in: Data
assim-25
ilation: Tools for modelling the ocean in a global perspective, NATO/ASI Series, I/19, edited by: Brasseur, P. P. and Nihoul, J. C. J., Springer-Verlag, 253, 1994.
De Mey, P.: Data assimilation at the oceanic mesoscale: A Review, J. Met. Soc. Japan, 75,
OSD
3, 671–700, 2006 Assessment of the impact of TS assimilation from ARGO floats A. Griffa et al.Title Page Abstract Introduction Conclusions References Tables Figures J I J I Back Close
Full Screen / Esc
Printer-friendly Version Interactive Discussion
Special issue on “Data assimilation in meteorology and oceanography: Theory and practice”, 415–427, 1997.
De Mey, P. and Benkiran, M.: A multivariate reduced-order optimal interpolation method and its application to the Mediterranean basin-scale circulation, in: Ocean Forecasting Conceptual Basis and Applications, edited by: Pinardi, N. and Woods, J., Springer-Verlag, 281–306,
5
2002.
Demirov, E., Pinardi, N., Fratianni, C., Tonani, M., Giacomelli, L., and De Mey, P.: Assimilation scheme of Mediterranean Forecasting System: Operational implementation, Ann. Geophys., 21, 189–204, 2003.
Fichaut, M., Balopoulos, E., Dooley, H., Garca-Fernandez, M.-J., Iona, A., Jourdan, D.,
10
Baudet, L., and Maillard, C.: A common protocol to assemble a coherent database from dis-tributed heterogeneous data sets: The MEDATLAS database experience, in: Marine science and technology programme: Experiences in project data management, edited by: Bohle-Carbonell, M., European Commission, Luxembourg, 349, 1998.
Hackert, E. C., Miller R. N., and Busalacchi, A. J.: An optimized design for a moored instrument
15
array in the tropical Atlantic Ocean, J. Geophys. Res., 103, 7491–7509, 1998.
Hernandez, F., Le Traon, P.-Y., and Barth, N. H.: Optimizing a drifter cast strategy with a genetic algorithm, J. Atmos. Ocean. Tech., 12, 330–345, 1994.
Kindle, J. C.: Sampling strategies and model assimilation of altimetric data for ocean monitoring and prediction, J. Geophys. Res., 91, 2418–2432, 1986.
20
Korres, G., Pinardi, N., and Lascaratos, A.: The ocean response to low-frequency interannual atmospheric variability in the Mediterranean Sea. Part I: sensitivity experiments and energy analysis, J. Climate, 13, 705–731, 2000.
Manzella, G. M. R., Scoccimarro, E., Pinardi, N., and Tonani, M.: Improved near-real time management procedures for the Mediterranean ocean Forecasting System? Voluntary
Ob-25
serving Ship program, Ann. Geophys., 21, 49–62, 2003.
Miyakoda, K., Smagorinsky, J., Strickler, R. F., and Hembree, G. D.: Experimental extended predictions with a nine-level hemispheric model, Mon. Wea. Rev., 97, 1–76, 1969.
Molcard, A., Griffa, A., and ¨Ozg¨okmen, T.: Lagrangian data assimilation in multilayer primitive equation models, J. Atmos. Ocean. Tech., 22, 70–83, 2005.
30
Pacanowski, R. C., Dixon, K., and Rosati, A.: The GFDL Modular Ocean Model users guide, version 1.0, Geophys. Fluid Dynam. Laboratory Ocean Tech. Rep. 2, 18, 1990.
OSD
3, 671–700, 2006 Assessment of the impact of TS assimilation from ARGO floats A. Griffa et al.Title Page Abstract Introduction Conclusions References Tables Figures J I J I Back Close
Full Screen / Esc
Printer-friendly Version Interactive Discussion
Raicich, F. and Rampazzo, A.: Observing System Simulation Experiments for the assessment of temperature sampling strategies in the Mediterranean Sea, Ann Geophys., 21, 151–165, 2003.
Raicich, F.: The assessment of temperature and salinity sampling strategies in the Mediter-ranean Sea: Idealized and real cases, Oc. Sci. Discuss. 3, 127–163, 2006.
5
Rohaly, G. D., and Krishnamurti, I. N.: An observing system simulation experiment for the Laser Atmospheric Wind Sounder (LAWS), J. App. Meteorol., 32, 1453–1471, 1993.
She, J., Høyer, J. L., and Larsen, J.: Assessment of sea surface temperature observational networks in the Baltic Sea and North Sea, J. Mar. Syst., Special Issue “Marine Environmental Monitoring and Prediction”, in press, 2006.
10
Sparnocchia, S., Pinardi, N., and Demirov, E.: Multivariate Empirical Orthogonal Function anal-ysis of the upper thermocline structure of the Mediterranean Sea from observations and model simulations, Ann. Geophys., 21, 167–187, 2003.
Taillandier, V., Griffa, A., and Molcard, A.: A variational approach for the reconstruction of regional scale Eulerian velocity fields from Lagrangian data, Ocean Modelling, 13(1), 1–24,
15
2006.
Taillandier, V., Griffa, A., Poulain, P., and B´eranger, K.: Assimilation of ‘Argo’ float positions in a Mediterranean circulation model, Geophys. Res. Lett., 33, L11604, doi:10.1029/2005GL025552, 2006.
Taillandier, V. and Griffa, A.: Implementation of position assimilation for Argo floats in a realistic
20
Mediterranean Sea OPA model and twin experiment testing, Oc. Sci. Discuss., 3, 255–289, 2006.
OSD
3, 671–700, 2006 Assessment of the impact of TS assimilation from ARGO floats A. Griffa et al.Title Page Abstract Introduction Conclusions References Tables Figures J I J I Back Close
Full Screen / Esc
Printer-friendly Version Interactive Discussion Fig. 1. Schematic of the MEDARGO float cycle.
OSD
3, 671–700, 2006 Assessment of the impact of TS assimilation from ARGO floats A. Griffa et al.Title Page Abstract Introduction Conclusions References Tables Figures J I J I Back Close
Full Screen / Esc
Printer-friendly Version Interactive Discussion Fig. 2. Launching sites for numerical MEDARGO floats in experiments: 47 WINTER,
47 SUMMER in upper panel; 10 SUMMER in lower panel. Blue shades indicate bottom depth in meters.
OSD
3, 671–700, 2006 Assessment of the impact of TS assimilation from ARGO floats A. Griffa et al.Title Page Abstract Introduction Conclusions References Tables Figures J I J I Back Close
Full Screen / Esc
Printer-friendly Version Interactive Discussion Fig. 3. Relative error versus time in days for experiment 47 WINTER. Upper panels are
rel-ative to the Western basin and lower panels to the Eastern basin; right panels are relrel-ative to temperature T errors and left panels to salinity S errors. The three lines in each panel indicate the layers: L1 in black, L2 in red and L3 in green.
OSD
3, 671–700, 2006 Assessment of the impact of TS assimilation from ARGO floats A. Griffa et al.Title Page Abstract Introduction Conclusions References Tables Figures J I J I Back Close
Full Screen / Esc
Printer-friendly Version Interactive Discussion Fig. 4. Relative error versus time in days for experiment 47 SUMMER. Upper panels are
relative to the Western basin and lower panels to the Eastern basin; right panels are relative to temperature T errors and left panels to salinity S errors. The three lines in each panel indicate the layers: L1 in black, L2 in red and L3 in green.
OSD
3, 671–700, 2006 Assessment of the impact of TS assimilation from ARGO floats A. Griffa et al.Title Page Abstract Introduction Conclusions References Tables Figures J I J I Back Close
Full Screen / Esc
Printer-friendly Version Interactive Discussion Fig. 5. Salinity maps for experiment 47 WINTER at 400 m and at time t=35 d. Upper panel
corresponds to the Control run, middle panel to the Free and lower panel to the misfit (Control-Free).
OSD
3, 671–700, 2006 Assessment of the impact of TS assimilation from ARGO floats A. Griffa et al.Title Page Abstract Introduction Conclusions References Tables Figures J I J I Back Close
Full Screen / Esc
Printer-friendly Version Interactive Discussion Fig. 6. Trajectories (computed over the whole integration period) superimposed to salinity misfit
maps for experiment 47 WINTER at 400 m and at time t=35 d. Upper panel corresponds to the misfit (Control-Free) and lower panel to (Assimilation-Free).
OSD
3, 671–700, 2006 Assessment of the impact of TS assimilation from ARGO floats A. Griffa et al.Title Page Abstract Introduction Conclusions References Tables Figures J I J I Back Close
Full Screen / Esc
Printer-friendly Version Interactive Discussion Fig. 7. Salinity maps for experiment 47 WINTER at 400 m and at time t=35 d. Upper panel
corresponds to the Assimilation run, middle panel to the Free and lower panel to the misfit (Assimilation-Free).
OSD
3, 671–700, 2006 Assessment of the impact of TS assimilation from ARGO floats A. Griffa et al.Title Page Abstract Introduction Conclusions References Tables Figures J I J I Back Close
Full Screen / Esc
Printer-friendly Version Interactive Discussion Fig. 8. Relative error versus time in days for experiment 10 SUMMER. The panels are relative
to the Western basin. Right panel is relative to temperature T errors and left panel to salinity S errors. The three lines in each panel indicate the layers: L1 in black, L2 in red and L3 in green.
OSD
3, 671–700, 2006 Assessment of the impact of TS assimilation from ARGO floats A. Griffa et al.Title Page Abstract Introduction Conclusions References Tables Figures J I J I Back Close
Full Screen / Esc
Printer-friendly Version Interactive Discussion Fig. 9. Misfit temperature T maps for experiment 10 SUMMER at 400 m and at time t=35 d.
Upper panel corresponds to the misfit (Control-Free) and lower panel to (Assimilation-Free) Tra-jectories (computed over the whole integration period) are superimposed on the (Assimilation-Free) misfit.
OSD
3, 671–700, 2006 Assessment of the impact of TS assimilation from ARGO floats A. Griffa et al.Title Page Abstract Introduction Conclusions References Tables Figures J I J I Back Close
Full Screen / Esc
Printer-friendly Version Interactive Discussion
2a
2b
3
4
9
5
1
6
8
Fig. 10. Vos track coverage.
OSD
3, 671–700, 2006 Assessment of the impact of TS assimilation from ARGO floats A. Griffa et al.Title Page Abstract Introduction Conclusions References Tables Figures J I J I Back Close
Full Screen / Esc
Printer-friendly Version Interactive Discussion Fig. 11. Relative error versus time in days for the idealized sampling experiments: Comparison
between MEDARGO float assimilation (cyan, from 47 SUMMER) and XCTD assimilation along VOS tracks (blue) for the three layers L1, L2 and L3 (upper, middle and lower panel respec-tively). Left panels are relative to S errors in the Eastern basin: right panels are relative to T errors in the Western basin.