HAL Id: tel-02888341
https://tel.archives-ouvertes.fr/tel-02888341v2
Submitted on 11 Sep 2020Rational design of plastic packaging for alcoholic
beverages
Yan Zhu
To cite this version:
Yan Zhu. Rational design of plastic packaging for alcoholic beverages. Chemical and Process Engi-neering. Université Paris Saclay (COmUE), 2019. English. �NNT : 2019SACLA020�. �tel-02888341v2�
Rational design of plastic
packaging for alcoholic beverages
Thèse de doctorat de l'Université Paris-Saclay
préparée à AgroParisTech, Institut des sciences et industries du
vivant et de l’environnement
École doctorale n°581 agriculture, alimentation, biologie,
environnement et santé (ABIES)
Spécialité de doctorat : Génie des ProcédésThèse présentée et soutenue à Massy, le 17 Juillet 2019, par
Yan ZHU
Composition du Jury :
Martine ESTEBAN-DECLOUX
Professeur, AgroParisTech – UMR 1145 Président
Eric FAVRE
Professeur, UMR 7274, ENSIC, Université de Lorraine Rapporteur
Thomas KARBOWIAK
Professeur, AgroSup Dijon,UMR PAM,Université de Bourgogne Rapporteur
Catherine JOLY
Maître de Conférences, EMA 3733 Université Lyon 1 Examinateur
Bruno GUILLEMAT
Ingénieur de recherche, Pernod Ricard Examinateur
Olivier VITRAC
Chargé de recherches, INRA – UMR 1145 Directeur de thèse
NNT
: 2019S
AC
LA
Rational design of plastic packaging
for alcoholic beverages
Yan Zhu, Ingénieur ENSIC
Acknowledgments
Firstly, I would like to thank sincerely to my academic supervisor Dr. Olivier Vitrac for his continuous and practical support during my Ph.D. study and related industrial projects, and for his guidance along my entire time of research and writing thesis manuscript. I also would like to express my gratitude to my industrial supervisor of the group Pernod Ricard, Mr. Bruno Guillemat for his patience, motivation, and continuous support and suggestion along with my Ph.D. study and internal industrial projects. Besides, I thank gratefully to Dr. Violette Ducruet as my former academic supervisor before her retirement, for her encouragement, guidance, and immense knowledge to help me in the first year and a half of my Ph.D. study.
Besides my supervisors, I would like to thank the rest members of my thesis committee. I thank Dr. Frank Welle (Fraunhofer IVV, Freising, Germany) and his group for the warm welcome at IVV in July 2017, and also for the fruitful exchange of ideas and data on the diffu-sion of homologous solute series in various polymers above or near 𝑇𝑇𝑔𝑔. I also thank Dr. Nicolas
Delpouve (UMR 6634 GPM, University of Rouen Normandy, France), for his insightful and useful suggestions and encouragement. Both of their meaningful questions helped me to widen and deepen my research from various perspectives.
My sincere thanks also go to Dr. Phuong-Mai Nguyen, Dr. Maxime Touffet, Ph.D. stu-dent Benjamin Le Delliou, master stustu-dent Denia Osmani for their experimental guidance, sup-port, and encouragement, especially at Synchrotron Soleil. I want to express also my friendship to Ph.D. student Hajar Faraj for her technique information and encouragement.
I thank all my rest fellows in the group of Interactions Matériaux et Milieux au Contact (I2MC, UMR GENIAL 1145) for their technical and laboratory support and guidance. My la-boratory work would not have been done well without the technical support of Mr. Cedric Plessis and Mr. Flavien Lecourtier.
Foreword
“The mere formulation of a problem is far more often essential than its solution,
which may be merely a matter of mathematical or experimental skill. To raise new questions, new possibilities, to regard old problems from a new angle requires creative imagination and marks real advances in science.”
—Albert Einstein I was a graduated master on chemical engineering and ambitious to have a rational plastic packaging design for various products in the fields of food, pharmaceuticals and cos-metics based on my educational background, initially. As broadening my knowledge and wid-ening my horizons in multidisciplinary progressively, I realized scientific knowledge could not have solved rational design without a clarification and integration of the problems. A rational design of plastic packaging should insist mainly three predominant issues: the environmental impact (plastic wastes, marine litters, global warming, etc.), the social impact (food consump-tion and food wastes, human health, circular economic, etc.) and industrial effects (benefits and responsibilities, etc.). After integration of the constraints, I found the complicated prob-lems for rational design might not be solved by studying merely the mass transfer and ther-modynamics. Therefore, I would like to imagine and build a general engineering approach: [E]valuation, [D]ecision, and [S]olving, so-called [E][D][S] approach. According to the linked [D]ecisions as the integration of constraints, a simple model with ideal hypothesis will be es-tablished, simulated, and optimized to have a fast prototype design. [E]valuation could be con-sidered as the further and more profound investigation of the transport and thermodynamic mechanisms on derived problems, such as safety, shelf-life, and packaging weight. [S]olving the problems should encompass the calculation, optimization, and reverse engineering upon on the [E]valuation and the [D]ecision.
This thesis is in cooperation with the group of Pernod Ricard, and the objective is to build a rational design of plastic packaging for alcoholic beverages, which could validate and improve my general [E][D][S] approach for safe-by-design. I may not be an expert in one of the domains, such as food, polymer, computer science, and the environment. However, I think it’s of importance to focus on how to design rationally within a complex problem system in an interdisciplinary filed considering the organization of knowledge, engineering and engineer-ing management. I hope this thesis could deliver some ideas, acquired knowledge, and meth-odologies to further related research topics and projects.
Table of Contents
CHAPTER I. INTRODUCTION ... 2
I.1.CONTEXT ... 2
I.2.RATIONAL DESIGN ... 4
I.3.ORGANIZATION OF THE MANUSCRIPT ... 5
CHAPTER II. LITERATURE REVIEW ... 8
II.1.BEYOND ENGINEERING: COMPUTER-AIDED DECISION MAKING ... 10
II.1.1. Problems which can be solved today with a computer ... 11
II.1.2. Decision-based on utility theory ... 12
II.1.3. Problem-solving methods in engineering ... 12
II.1.4. Multicriteria optimization ... 17
II.1.5. Ecodesign concepts and tools ... 22
II.2.EVALUATION OF THE MIGRATION FROM PACKAGING MATERIALS ... 29
II.2.1. Preamble and scope ... 29
II.2.2. Principles of tiered migration modeling for risk assessment ... 30
II.2.3. Common assumptions used in migration modeling ... 32
II.2.4. Diffusion properties in polymers ... 60
II.2.5. Sorption properties and partition coefficients ... 70
II.2.6. Probabilistic modeling of the migration ... 79
II.2.7. Generalized migration modeling and holistic approaches ... 91
II.3.EVALUATION OF THE ENVIRONMENT IMPACTS OF FOOD PACKAGING ... 95
II.3.1. A short history ... 95
II.3.2. Sustainability and the difficult transition to sustainable food supply chain ... 96
II.3.3. From legal frameworks to packaging wastes ... 97
II.3.4. Life cycle assessment (LCA) ... 98
II.3.5. Applications of LCA to beverage packaging ... 102
II.4.ADDITIONAL INDICES TO CONSIDER IN FOOD PACKAGING DESIGN ... 107
II.4.1. Food shelf-life ... 107
II.4.2. Mechanical resistance of PET bottles ... 112
II.4.3. Sustainable and green chemistry ... 113
II.5.CONCLUSIONS OF THE LITERATURE REVIEW ... 116
III.3.SPECIFIC OBJECTIVES AND APPROACHES ... 129
CHAPTER IV. MATERIALS AND METHODS ... 134
IV.1.MATERIALS ... 134
IV.1.1. Studied PET materials ... 134
IV.1.2. Studied solutes ... 137
IV.1.3. Reference data and properties ... 137
IV.2.EXPERIMENTAL METHODS ... 144
IV.2.1. Mutual permeation of water and ethanol in real bottles ... 144
IV.2.2. Gravimetric measurements of water and ethanol sorption and diffusion (F1-F5, M) ... 146
IV.3.COMPUTATIONAL METHODS ... 149
IV.3.1. Mass transfer modeling of water and ethanol at tiers 1 and 2 ... 149
IV.3.2. Mechanical constraints: risk of overpressure and collapse in the headspace... 151
IV.3.3. Packaging design and optimization: case-study ... 155
CHAPTER V. RESULTS AND DISCUSSION ... 158
V.1.SCOPE OF TIERED MODELING ... 158
V.2.OPTIMIZATION OF THE DESIGN OF PET BOTTLES AT TIERS 1-2... 159
V.2.1. Overview of the [E][D][S] implementation and choices ... 159
V.2.2. Dual bottle geometry models ... 161
V.2.3. Driving forces controlling primary shelf-life of liquors... 164
V.2.4. Comparison of simulated and measured water-ethanol mass transfer across bottles 𝑀𝑀 .. 168
V.2.5. Optimal design of packaging systems for liquors: bottles X as a case study ... 174
V.2.6. Main directions and limits of the optimization of PET bottles with fixed shelf-life ... 177
V.3.TERNARY ISOTHERMS OF WATER AND ETHANOL IN PET AT TIERS 2,3 ... 178
V.3.1. Why is it difficult to estimate �𝐶𝐶𝑖𝑖,𝑒𝑒𝑒𝑒𝑇𝑇,𝑇𝑇𝑔𝑔� 𝑖𝑖=𝑤𝑤,𝑒𝑒 in PET at glassy state? ... 180
V.3.2. Interpretation of swelling in ternary isotherms of PET ... 187
V.3.3. Ternary Flory-Huggins model with temperature and composition effects ... 188
V.3.4. Parameterization of binary parameters:𝜒𝜒𝑤𝑤+𝑃𝑃𝑇𝑇 and 𝜒𝜒𝑒𝑒+𝑃𝑃𝑇𝑇 ... 191
V.3.5. Experimental validation of ternary isotherms ... 196
V.3.6. Ternary FH3 isotherms from 20°C to 50°C ... 198
V.4.A BLOB-FREE-VOLUME MODEL OF SOLUTE DIFFUSION COEFFICIENTS IN POLYMERS AT TIERS 3-4 . 200 V.4.1. Ambition and assumptions ... 200
V.4.2. Derivation of the blob free-volume theory ... 202
V.4.3. Experimental validation for linear probes ... 212
V.4.4.𝑃𝑃(𝑇𝑇,𝑇𝑇𝑔𝑔) and reliable estimates of 𝐾𝐾𝛼𝛼 and 𝐾𝐾𝛽𝛽 ... 225
V.4.5. Prediction of diffusion coefficients ... 231
V.4.6. Main findings ... 240
V.5.2. The rule of the maximum driving force ... 245
V.5.3. Estimation of the uncertainty in diffusivities ... 251
V.5.4. Probabilistic estimation of shelf-life ... 253
CHAPTER VI. CONCLUSIONS AND PERSPECTIVES ... 258
VI.1.CONCLUSIONS ... 258
VI.2.PERSPECTIVES ... 261
CHAPTER VII. RESUME DU TRAVAIL DE THESE EN FRANÇAIS ... 266
VII.1.CONTEXTE DU PROJET DE THESE ... 266
VII.2.PRINCIPAUX RESULTATS ... 271
VII.2.1. Exemple d’optimisation non supervisée aux paliers 1 et 2 ... 271
VII.2.2. Cosorption non linéaire dans le polyéthylène téréphtalate (PET) ... 273
VII.2.3. Prédiction des coefficients de diffusion à partir d’une généralisation de la théorie des volumes libres ... 275
VII.3.DISCUSSION, CONCLUSIONS ET PERSPECTIVES ... 278
List of Publications
Articles
Zhu, Y., Guillemat, B., and Vitrac, O. (2019). Rational Design of Packaging: Toward Safer and Ecodesigned Food Packaging Systems. Frontiers in Chemistry Vol. 7. Article 349.
https://doi.org/10.3389/fchem.2019.00349.
Zhu, Y., Welle, F., Vitrac, O. (2019). A blob model to parameterize polymer free-volumes and solute diffusion. submitted for Soft Matter.
Book chapter
Zhu, Y., Nguyen, P.M., Vitrac, O. 2019. Risk assessment of migration from packaging materials into food. In “Reference Module in Food Science”. Volume In Press. Elsevier. Amsterdam.
List of Figures
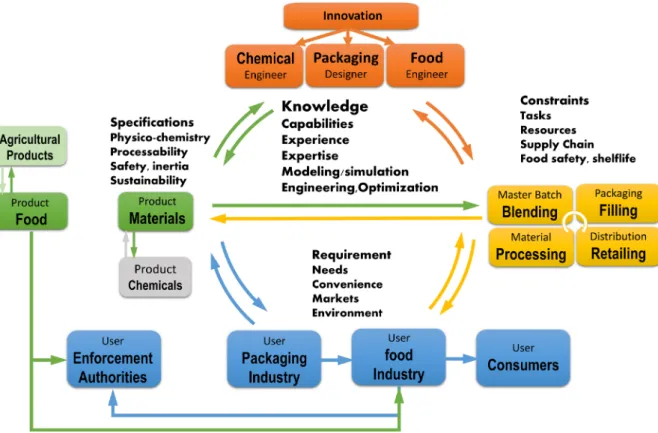
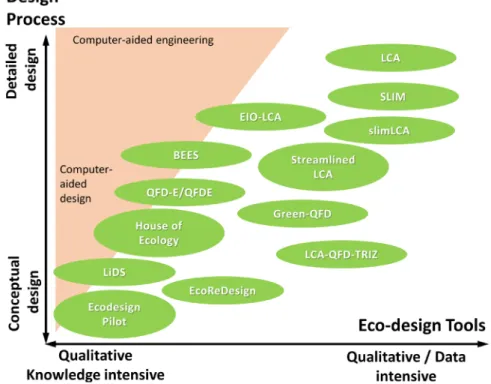
Figure II-1. Interplaying factors in engineering design: example of food-packaging design (modified from Figure 3.2 of Alexiou et al., 2010). ... 9 Figure II-2. (a-b,d) Illustrations of nonconvex goals; (c) convexification by adding boundaries 𝑥𝑥𝑥𝑥 ≤ 𝑥𝑥 ≤ 𝑥𝑥𝑥𝑥; (d) nonconvex problem combining a convex problem with Gaussian white noise (𝑖𝑖𝑖𝑖𝑖𝑖𝑥𝑥𝑖𝑖 ∗ and 𝑠𝑠𝑠𝑠𝑠𝑠𝑥𝑥𝑖𝑖 ∗ are the bounds of the domain where the minimum can occur); (e) composition of two convex goals. The green triangle represents the initial guess and the red square the final solution of a randomized steepest descent algorithm. The intermediate positions are depicted with connected orange circles. In non-convex problems, the final solution may dependent on the initial guess (see (a) and (b)). ... 18 Figure II-3. Geometric interpretation of multidimensional optimization problem: (a) convex function; (b) nonconvex function; (c) the epigraph of a convex function is convex set; (d) polygonal convex set; (e-f) nonconvex sets; (g) convex hull of discrete points; (h) conic hull of (g); (i) convex hull of (e); (j) conic hull of (e); (k) intersection between a linear goal and a conic hull; (i) nonlinear feasible region associated to a convex goal; (j) idem under integer constraints. ... 21 Figure II-4. How environmental impact is created along the decision chain supporting product development (after Lewis et al., 2001). ... 23 Figure II-5. Aspects to consider in ecodesign of food packaging: (a) hierarchy of packaging waste management, (b) An example of a design guideline for source reduction of horizontal pouches used in the Korean food industry. “Acceptable” and “Optimum” refer to the dimensional allowable ranges (mm) in the design process (after Han, 2014). ... 25 Figure II-6. Overview of the bestiary of eco-design and design process tools from Ramani et al. (2010). ... 26 Figure II-7. Principle of the tiered approach to demonstrate compliance for food contact materials. Compliance is demonstrated as soon as the estimated concentration is greater than the threshold of concern. Tier 1 is usually associated with total migration (see Eq. (II.4)). ... 31 Figure II-8. One-dimensional description of solute diffusion (e.g., additive, monomer) from the packaging wall (position:
0
≤
x l
p≤
1
, individual solutes identified as ×) to the contacting phase (individual solutes identified as ■) via the food boundary layer (individual solutes identified as ●): (a) random distribution of solutes and corresponding concentration profile atFo =
0.1
and (b) after contact times up toFo =
2
. The percentages in the top part represent the residual amount in each compartment. ... 35 Figure II-9. Dimensionless desorption kinetics *( )
F( )
eq F
C Fo
v Fo
C
=
for various values ofL
P F/ ,/ F P
K
andBi
with 0 / /1/
1/
eq P F P F F PC
C
L
K
=
+
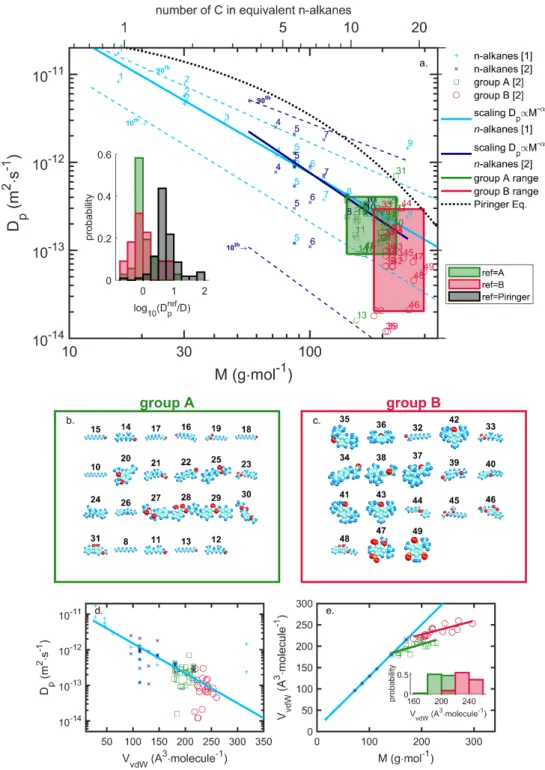
. Approximations [1] and [2] are given by Eqs. (II.17) and (II.18), respectively. ... 42 Figure II-10. Indexing rule of a material including m layers (total thickness lP) in contactThe result A+B+C corresponds to the mathematical addition of the contributions of the three sources. ... 49 Figure II-13. Illustration of the conservative scenario of Table II-10 based on the overestimation of the contribution of each source. The reference corresponds to the initial case-study configuration also depicted in Figure II-12... 50 Figure II-14. Principles of the simplification of a
m
-layer problem (herem =
3
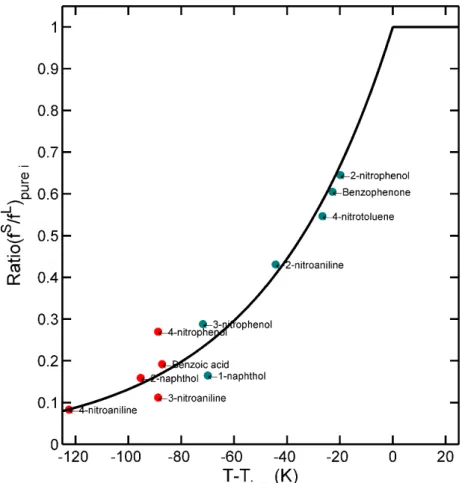
) into a problem with a lower number of layers and, therefore, easier parameterization. The represented distributions in the packaging correspond to initial conditions at various tiers. 51 Figure II-15. Illustration of the redistribution of the migrants from UV-cured printing ink and their subsequent migration in food for long shelf life products. The depicted cases cover hot-filled or aseptically filled products (e.g., soups, pasteurized juices, sterilized dairy products), and dry or ready-to-eat products stored in cardboard boxes. ... 52 Figure II-16. Illustration of the composition rules (a) for distances and (b) for the migration from a monolayer material, and of their invariance with the order of the steps (see Eqs. (II.28) and (II.35)). ... 54 Figure II-17. Scaling of diffusion coefficients between rigid and connected blocks with molar mass and van der Waals volume in a thermoplastic polymer (groups A and B refer to substances defined in Figure II-18). ... 64 Figure II-18. Scaling of diffusion coefficients of 49 substances (n-alkanes, two groups of molecules A and B with similar 𝑫𝑫𝑫𝑫 values) in LDPE at 23°C with molar mass, M, and the van der Waals volume... 66 Figure II-19. Diffusivities of various substances at 25°C in glassy and rubber polymers: (a) raw values, (b) normalized data to remove polymer effects (standardized to 𝑻𝑻𝑻𝑻 value of 0°C corresponding to atactic polypropylene PP). Filled symbols correspond to n-alkanes (scaling laws 𝑫𝑫𝑫𝑫 ∝ 𝑴𝑴 − 𝜶𝜶 as dashed lines) and empty symbols to various solutes including gases and plastic additives (scaling laws 𝑫𝑫𝑫𝑫 ∝ 𝑴𝑴 − 𝜶𝜶 as continuous lines). Data from Schwope et al. (1990). ...68 Figure II-20. Arrhenius plot of diffusivities of n-alkanes in polyethylene terephthalate. Data from Ewender and Welle (2014, 2016, 2018a). ... 69 Figure II-21. Ratio of fugacities between pure solid and amorphous states for 11 model migrants (data fromFornasiero et al., 2002) and its continuous approximation proposed in Figure S1 of the Supporting Information of Nguyen et al. (2017). ... 72 Figure II-22. Variation of the binary Flory-Huggins coefficient in water-ethanol mixtures. Data from Gillet et al. (2010). “abv” values represent the equivalent alcohol strength (alcohol-by-volume at 20°C and atmospheric pressure). Simulant C: 10% ethanol for alcoholic foodstuffs; simulant D1: 50% ethanol for high alcoholic and milk. ... 76 Figure II-23. Illustration of safety margins (SM), overestimation factors (Q) and uncertainty according to the method of calculation: real, likely and very conservative. ... 81 Figure II-24. Probabilistic modeling of the contamination from a monolayer material via Eqs. (II.13) and (II.63): (a) point distribution forFo =
0.5
; (b) corresponding 10th and 90thpercentile curves. The likeliest migration curve corresponding to the maximum probability (mode) of the Fo distribution appears in bold. ...89 Figure II-25. (a) Effect of
Bi
on the dimensionless migration kinetics. (b) Effect forBi → ∞
(the percentiles are represented as equivalent kinetics; distributions of v* forFo
=0.5, 1,2, 3 and 4. ... 90 Figure II-26. Evolution of the scope of migration modeling during the last decades ... 91Figure II-27. Sustainability defined at the joint intersection of society, economy and environment spheres: (a) original concept from concept of Remmen et al. (2007); (b) interpretation for food packaging. ... 96 Figure II-28. Interpretation of the ISO standards applicable for food production and food packaging management. ...98 Figure II-29. Life cycle thinking applied to PET bottles for beverages adapted from Remmen et al. (2007) and by integrating the study of Almeida et al. (2010). ... 99 Figure II-30. Principles of multiobjective optimization with extensive indices (after Nielsen and Bastianoni, 2007). ... 102 Figure II-31. Review of LCA studies of plastics bottles per country, issuing organization and year. ... 105 Figure II-32. Overview of conditions affecting the shelf-life of packaged food products: (a) main industrial steps (after Figure 1.1 of Rahman, 2007); (b) mass transfer and reactions (after Figure 2.2 of Singh et al., 2017). ... 108 Figure II-33. Principle of shelf-life calculations for a dry food product (initial water activity 0.15) stored in a humid atmosphere (75% RH) within a packaging slowing down water permeation: (a) water sorption isotherm and variation of glass transition temperature (𝑇𝑇𝑇𝑇) with water content; (b) variation of texture induced by water uptake. Shelf-life is determined by the tolerance on the shift of 𝑇𝑇𝑇𝑇 before (primary life) or after opening (secondary shelf-life). ... 110 Figure II-34. Simulated CO2 depletion in a PET bottle containing a carbonated beverage
(Carrieri et al., 2012): (a) simulated 2D wall profile along its axis of revolution; (b) details of the mesh (Lagrange quadratic); (c) diffusion coefficients of CO2 in PET (𝐷𝐷𝑠𝑠 for preforms W1
and W2), in the headspace (𝐷𝐷ℎ) and in water (𝐷𝐷𝐷𝐷); (d) 2D CO2 concentration profiles in bottles
(W1) quiver plot showing molar flux superimposed to concentration profiles; (e) evolution of
C02 concentration in the bottle in variable temperature conditions. ... 112
Figure II-35. Relationship between bottle geometry, wall thickness distribution and mechanical resistance of PET bottles: (a) typical preform and temperature distribution during blowing; (b) relationship between yield strength and crystallinity; (c) vertical distribution of PET material after blowing for two preforms (40 and 37 g); distribution of buckling stress (compression tests a-c); (e) distribution of stresses in a petaloid shape bottle for carbonated bottles; (f) details of the distribution of stresses at the petaloid bottom (red = maximum stress at the center) ... 113 Figure II-36. (a) green chemistry pocket guide of the American Chemical Society; (b) schematic definition of sustainable and green chemistry ... 114 Figure II-37. The role of chemical thermodynamics in the objective evaluation of the performance of engineered systems (after Figure 1.5 of Valsaraj and Melvin, 2018). ... 117 Figure III-1. Initial designs (𝐷𝐷1..𝐷𝐷4) considered in the global optimization problem. The height 𝑏𝑏 of 𝐷𝐷1 and 𝐷𝐷2 is fixed to 15 cm. The black circle on top represents the opening (cap not shown). ... 124 Figure III-2. Principle of the iterative resolution of the ecodesign problems using the [E][D][S] framework ... 125 Figure III-3. Typical sphericity values for convex regular polyhedrons. ... 126
Figure IV-1. Bottle geometry: (a) radius profile (the arrows indicate the top and bottom
position of the sleeve and the vertical line indicate the level of liquid for pure water); (b) 3D-representation assuming a revolution geometry; (c) thickness profile (the shadow indicates the variation range of measurements among 10 bottles); (d) filled and sealed bottle; (e) bottle equipped with a shrink sleeve label. ... 136
Figure IV-2.Example of initial bottle design to be optimized ... 136 Figure IV-3. List of studied solutes ... 143 Figure IV-4. Example of calculations to estimate the risk of exceeding the lower
flammability limit (LFL) in large scale experiments. ... 144
Figure IV-5. Principle of the cosorption microbalance (denoted B in Table IV-8): (a)
overview of the gas circuit involving two saturators; (b) the entire microbalance and the anti-vibration platform are placed in the oven. SOS: sensor of sound speed. ... 147
Figure V-1. Overview of four tiers considered for packaging optimization with the proposed [E][D][S] framework... 158 Figure V-2. Dual representation of the geometry of bottle Figure IV-1 in 3D and curvilinear coordinates. The equivalent geometry of the bottles as seven independent sections in contact with the same liquid is shown in d as histograms. ... 162 Figure V-3. Comparison between (a) an unwrapped hollow 3D geometry and (b) its approximation with uniform thickness. The arrow represents the normal mass flux crossing each geometry. The values of indicated thicknesses are indicative; in real bottles, the thinnest regions exhibit the largest surface area of transfer (see distribution in Figure V-2d) ... 163 Figure V-4. Binary properties of water-ethanol mixtures: (a) activities, (b) partial pressures, (c) total pressure in vacuum, (d) liquid density. The symbols depict the tested beverages and storage conditions. Horizontal lines in (a) show the variation of RH when the air temperature is increased from 20°C up to 70°C. ... 166 Figure V-5. Calculated iso-headspace pressures (
P
head ) and iso-headspace volume (V
head) at equilibrium in the bottle depicted in Figure IV-1 according to the headspace volume (V
head0 ) and temperature (T
0 ) at filling time. The results are presented for two storage temperature50°C (a,b,c) and 35°C (d,e,f) three abv values (0,15, 0.4, 0.7). ... 167 Figure V-6. Comparison of experimental (exp) and simulated (sim) mass loss and abv variations. The dashed lines plot the thresholds used to calculate shelf-life (see text). Empty symbols (triangles) represent the theoretical variation of abv when concentration effects due to water permeation are corrected. ... 170 Figure V-7. Reconstruction of mass losses by sorption and permeation for (a,b) water and (c,d) ethanol. ... 171 Figure V-8. Modifications of mass transfer when a sleeve is added to the bottles containing the beverage B3 and B4 after several months of storage: mass loss during condition S3 (dash lines, one line per considered bottle) and S4 (continuous lines, one line per considered bottle). ... 173 Figure V-9. Space of geometries explored and optimized for a 160 mL bottle (capacity 150 mL) containing a vodka-type beverage: (a) shapes corresponding to a 30×30 combination of
W
and D, (b) 5×5 combination, (c) weights of bottles optimized to fulfill a shelf-life of 180 days at 25°C. ... 175 Figure V-10. (a) iso-weight and (b) iso-thickness contours of optimized bottles (minimum shelf-life of 180 days) shown in Figure V-9. The filled symbols locate the sampled Pareto front. A selection of designs sampled along the Pareto front (from left to right) is presented in (c). ... 176Figure V-11. Schematic representation (a) of the state of the polymer and (b) the corresponding mechanism of diffusion during a sorption experiment. 𝐷𝐷𝐷𝐷𝑏𝑏 stands for the Deborah number. (modified fromVrentas et al., 1975). ... 179 Figure V-12. Interpretation of water sorption kinetics in 280 µm thick PET of Dubelley et al. (2017a): (a) 1/𝛽𝛽-isocontours in days (continuous lines; 𝛽𝛽>0: positive effect of relaxation on uptake, i.e. swelling; β<0: negative effect of relaxation on uptake, i.e. densification); (b) corresponding iso-Deborah numbers (continuous lines; same sign as β). Dashed lines represent iso-𝑠𝑠𝐷𝐷 in kPa of the corresponding water vapor. ... 183 Figure V-13. Cycle of sorption-desorption of water in 12 µm think PET films (reference F1) involving 16 steps from 50% to 99% RH (steps 1-6) and from 99% down to 0% RH (steps 7-16) at 50°C. Continuous lines are fitted models from Eq. (V.4). Corresponding values of 1/𝛽𝛽 and 𝜙𝜙 are plotted in the lower and upper insets. 𝑀𝑀𝑀𝑀𝑀𝑀𝑀𝑀 = sample dry mass. ... 185 Figure V-14. Cycle of sorption-desorption of water in 12 µm think PET films (reference F1) involving seven steps from 45% to 95% RH (steps 1-4) and from 95% down to 45% RH (steps 5-7) at 50°C. Continuous lines are fitted models from Eq. (V.4). Corresponding values of 1/𝛽𝛽 and 𝜙𝜙 are plotted in the lower and upper insets. 𝑀𝑀𝑀𝑀𝑀𝑀𝑀𝑀 = sample dry mass... 186 Figure V-15. Water sorption/desorption kinetics of the PET walls (thickness 629±33 µm) at 50°C for four stepwise variations of relative humidity (RH steps are indicated in legend): (a) mass uptake relative to dry mass 𝑀𝑀𝑀𝑀𝑀𝑀𝑀𝑀 ; (b) mass uptake normalized by its final value. Continuous lines are fitted models from Eq. (V.4). ... 187 Figure V-16. Fitted binary Flory-Huggins isotherms for (a) water, (b) ethanol and (c) methanol at temperatures ranging from 20°C to 100°C. ... 192 Figure V-17. Effect of temperature on 𝜒𝜒𝑖𝑖 + 𝑃𝑃𝑇𝑇 values. Data sources are shown in Figure V-16. The models for subcooled PET are shown in continuous lines (smoothed cubic spline). The model for densified PET materials are shown as dashed lines (smoothed quintic spline). ... 193 Figure V-18. Long-term sorption behavior of 12 µm thick PET films after exposure (a) to 97.5% RH and (b) 99% ethanol. Two repetitions are shown in (a) (denoted r1 and r2); five
repetitions are combined in (b). The inset is showing the same kinetics during the first month. The continuous lines describe a sorption model similar to Eq (V.4) (a) with double relaxation (one positive for swelling and one negative to describe densification) and (b) with a single relaxation. ... 195 Figure V-19. Typical diffusion behaviors in glassy polymers with penetrant concentration and Deborah numbers for differential step-change sorption experiments. (modified from (modified from Vrentas and Vrentas, 2001), the dimensionless sorption curves are calculated from Eq. (V.4) for 𝜙𝜙 = 0.7). ... 196 Figure V-20. Theoretical iso-mass uptake of water and ethanol in PET at 35°C at equilibrium with a water or ethanol gas mixture (below the liquidus curve), with a hydroalcoholic solution (on the liquidus curve) and at high pressure (above the liquidus curve): (a) 𝑚𝑚𝐷𝐷𝑎𝑎𝐷𝐷, 𝑎𝑎𝐷𝐷 (b) 𝑚𝑚𝐷𝐷𝑎𝑎𝐷𝐷, 𝑎𝑎𝐷𝐷 and (c) 𝑚𝑚𝐷𝐷𝑎𝑎𝐷𝐷, 𝑎𝑎𝐷𝐷 + 𝑚𝑚𝐷𝐷𝑎𝑎𝐷𝐷, 𝑎𝑎𝐷𝐷). The liquidus curve calculated from Figure V-4a is plotted as a continuous line. The symbols depict the conditions tested experimentally. ... 197 Figure V-21. Comparison of mass uptakes for conditions depicted in Figure V-20 with continuous predictions from ternary isotherms (to be used for equilibriums with hydroalcoholic solutions) and ternary isotherms (to be used for equilibriums with saturated
Figure V-24. Illustration of the procedure to calculate arbitrary diffusion coefficients from the proposed blob-FV model a) solute blob model; b) free volume parameterization and 𝐷𝐷 model; c) example of water diffusion prediction in PET ... 202 Figure V-25. Scaling of diffusion coefficients,
D
lin orD
a, of n-alkanes (n-A), 1-alcohols (1-O) and alkyl-acetates (a-A) with the molecular mass of the alkyl chain, M in: (a) PET, (b) PA6, (c) PS and (d) PVAc. Continuous and dotted lines correspond to the regression lines for regular solutes (n-alkanes) and their generalization to anchored ones (1-alcohols and alkyl acetates) via Eq. (V.39), respectively.M
blob was estimated the common intersection of all regression lines ofln
D
lin vs ln M (see its interpretation in Eqs.(V.19) and (V.30)). ... 215 Figure V-26. Apparent activation energiesE
a of linear solutes in function of the alkyl chain mass, M , in: (a) PET, (b) PA6, (c) PS and (d) PVAc. Data sets were split according to the considered families of molecular probes (n-A: n-alkanes, 1-O: 1-alchols and a-A: alkyl acetates) and according to the temperature ranges used for the determination ofE
a . The linear regressionsE
a vs ln M are plotted as continuous lines (see Eqs. (V.29) and (V.31)). ... 220 Figure V-27. Normalized activation energies (see Eq. (V.29)) when free volume effects are normalized by the dimensionless temperatureI
defined in Eq.(V.28). All values are expressed in excess to a theoretical hexyl chain (C6H13). Regression lines with ln M are plottedas continuous and dashed lines, for probes with low and high anchor effects, respectively.222 Figure V-28. Variation of
α
lin( )
T
withT T
−
g when it is estimated from regular linear probes (blob model) and equivalent anchored solutes. Symbols correspond to determinations according to method 1 (scaling ofD
lin orD
a with M ; see Figure V-25 and Eq.(V.19)) or according to method 2 (regression ofE
a with ln M ; see Figure V-26 and Eq.(V.29)). The continuous model ((V.22)) is plotted as continuous lines for different estimates ofK
α,K
βand r for both regular solutes and anchored ones (see text for values). ... 224 Figure V-29. Polymer function P T T
(
, g)
versusT T
−
g predicted by Eq. (V.20)(continuous lines) and by Eq.(V.15) using either specific (dashed lines) or generic (dotted lines) WLF constants. The corresponding FV parameters are listed in Table V-2. All models are plotted for three typical r values at glassy state (0.5, 0.25 and 0.1) leading to three branches wheng
T T
−
<0. As constant thermal expansion is assumed at rubber and glassy states, the diagramsare limited by the inequalities:
1
(
)
,
1
g gK
T
T T
T
K
r
α
α β
−
>
−
−
and lin(
T T, g)
1α
≥ . The squareand round symbols depict the P T T
(
, g)
values corresponding toα =
lin4
andα =
lin9
, respectively. ... 230 Figure V-30. Experimental (symbols) and predicted (lines) diffusion coefficients via Eq. (V.30)and parameters listed in Table V-2 for n-alkanes in PVAc (bold continuous lines), PA6 (continuous lines), PET (dashed-dotted lines), PS (dashed lines) and PEN (dotted lines). The dashed vertical line represents theT
g value of the polymer for the corresponding set of data. The predictions assume the inequality:( , ) 1 1 T Tg g r K
T T
αK
β α −
−
>
−
Figure V-31. Experimental (symbols) and predicted (lines) diffusion coefficients via Eqs.(V.30) and (V.39) along with parameters in Table IV-5 for (a) 1-alcohols and (b) alkyl acetates in PVAc (bold continuous lines), PA6 (continuous lines), PS (dashed lines) and PEN (dotted lines). The dashed vertical line represents the
T
g value of the polymer for the corresponding set of data; the corresponding.T
g values of PVAc and PA6 are out of bounds. ... 233 Figure V-32. Comparison of experimental diffusion coefficients, (”exp”, filled symbols), and simulated ones by molecular dynamics (“sim”, open symbols) with values predicted from Eq. (V.25) and parameters reported in Table V-3 for (a) water and (b) toluene in amorphous PET at infinite dilution of not mentioned otherwise. All calculations are performed with a theoreticalT
g of 349 K (continuous lines). Swollen PET due to a contact with a liquid or measurements at high solute activities is identified as “swollen” and is associated to an indicativeT
g of 333 K, value from Langevin et al. (1994) for PET fully swollen with water; corresponding values are plotted as dashed lines. ... 238 Figure V-33. Comparison of predicted and experimental diffusion coefficients of toluene at infinite dilution in various polymers. ... 240 Figure V-34. Microscopic observations in phase contrast of the cross sections of 12µm-thick PET film F1. (a) neat film; (b) film immersed in water at 50°C for 10 hours; (c) film immersed in ethanol at 50°C for 10 hours. ... 243 Figure V-35. Comparison of the apparent activation energies of diffusion of ethanol (gravimetric measurement after liquid contact with 99% ethanol, five repetitions for each condition). The inset shows the distribution of apparent activation energies based on 1000 bootstrap samples. ... 244 Figure V-36. Sorption kinetics of ethanol and toluene in 12 µm thick PET films (F1) at 50°Cat high activities. The fitted model is a delayed version of Eq. (V.4). ... 245 Figure V-37. Theoretical and experimental mass losses (water and ethanol) in 12 µm thick PET film (F1) at 50°C: (a) theoretical residual ethanol content; (b) theoretical residual water content; (c) cumulated amount of water and ethanol; (d) comparison between experimental and theoretical value along the routes ABEDF and ABCDF. ... 247 Figure V-38. Independent simulation of the mass transfer of water and ethanol associated with a negative step of water activity of 0.51 down to 0.40 and a positive step of ethanol activity to 0.38 at 50°C. Concentration profiles (100 times) are shown for the whole period and are distributed as the square root of time. ... 248 Figure V-39. Comparison between simulated mass uptake and experimental determinations for 680 µm thick bottle walls at 50°C using the cosorption microbalance (experimental conditions and simulated results are shown in Figure V-38 with fitted values for water and ethanol listed in Table V-4). ... 249 Figure V-40. Analysis of the fluctuations of mass uptake vs the fluctuations of relative humidity (period 240 s) in 12 µm thick PET bottle (M) at 50°C: (a) raw results, (b) correlation between fluctuations when the average delay between has been removed. ... 250 Figure V-41. Sorption/desorption cycles of 12 µm thick PET films at 25°C from an initial state at 50±10% RH. Cases leading to significant desorption are plotted in dashed lines. ... 251
Figure VII-1. Designs simplifiés de bouteilles (𝐷𝐷1..𝐷𝐷4) utilisés pour illustrer la démarche
d’optimisation géométrique sous contraintes du matériau et du produit emballé. La hauteur
𝑏𝑏 of 𝐷𝐷1 and 𝐷𝐷2 est fixée à 15 cm. Le disque noir (∅ 2 𝛼𝛼𝑚𝑚) représente l’ouverture de la bouteille
(le bouchon n’est pas visible). ... 268
Figure VII-2. Représentation géométrique des équations (VII.1) et (VII.3)-(VII.4) pour une bouteille de 0.25 L. Les isocontours représentent les valeurs du rapport
(
(
00)
)
0.25 1 P P t F t F M V L M V L = = = = . ... 269
Figure VII-3. Principe du prototypage rapide de bouteilles pour les boissons alcoolisées via
l’approche itérative à trois Etapes [E]valuation, [D]écision et ré[S]olution proposée. ... 270
Figure VII-4. Optimisation de la géométrie d’une mignonnette (capacité 150 mL et un volume d’espace de tête de 10 mL) utilisée pour le transport aérien avec une durée de vie de 180 jours à 25°C pour une boisson de type vodka. ... 272 Figure VII-5. Principe de l’étude des propriétés de sorption dans le PET (a-b) et isotherme ternaire eau-éthanol déterminée à 50°C (c-f). La courbe en gras représente le « liquidus » et les symboles les conditions utilisées pour la validation présentée dans la Figure V-21. .... 273 Figure VII-6. Comparaison entre les prédictions de l’isotherme ternaire eau-éthanol dans le PET à 35°C avec les sorptions expérimentales. ... 275 Figure VII-7. Relations en lois d’échelle, théorie des volumes libres et coefficients de diffusion : (a) comparaison des lois d’échelle avec la masse moléculaire pour des solutés linéaires et encombrés ; (b) filiation de la théorie des volumes libres ; (c) lois d’échelle dans le polyéthylène basse densité à 23°C ; (d) principe du paramétrage de la théorie des volumes libres à partir des coefficients de diffusion de molécules sondes linéaires. L’équation de Piringer utilisée pour démontrer la conformité des matériaux d’emballages alimentaires est représentée en pointillés sur la figure (a) ; elle correspond à un surestimateur empirique qui sous-estime la dépendance réelle à la masse moléculaire 𝑀𝑀. ... 276 Figure VII-8. Paramétrisation et prédictions des coefficients de diffusion de l’eau et de l’éthanol dans le PET à l’état caoutchoutique et vitreux : (a) lois d’échelle à l’état caoutchoutique et vitreux pour des molécules sondes linéaires ; (b) modèle générique de coefficients de diffusion et paramétrage du modèle pour l’eau et le toluène ; (c) validation pour l’eau sur la base d’une identification de 𝑀𝑀 à partir des données de Launay et al. (1999) ; (d) validation pour le toluène dans cinq polymères ; (e) dépendance des coefficients de diffusion du toluène à la température ; (f) cinétiques de sorption à 50°C mettant en évidence la relaxation du polymère. ... 277 Figure VII-9. Analyse des fluctuations du flux de matière en fonction de la fluctuation périodique (période de 240 s) de la pression partielle en vapeur d’eau à 50°C pour un échantillon de 630 µm d’épaisseur. ... 279 Figure VII-10. Distribution de la perte de poids (droite) et de la variation du titre alcoolique (gauche) en fonction des distributions combinées des températures au cours du transport et du stockage (encart). La figure centrale montre la variation déterministe de la perte de poids et du titre alcoolique (abv) en avec un temps de séjour équivalent à 25°C. ... 280
List of Tables
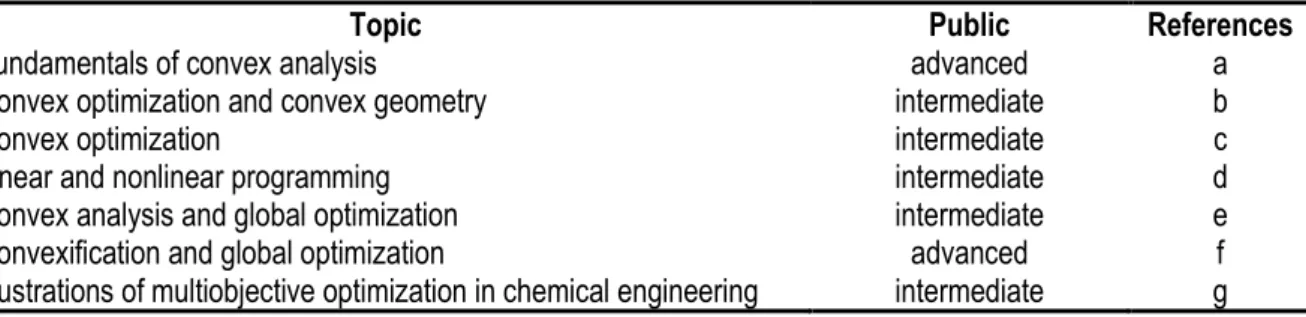
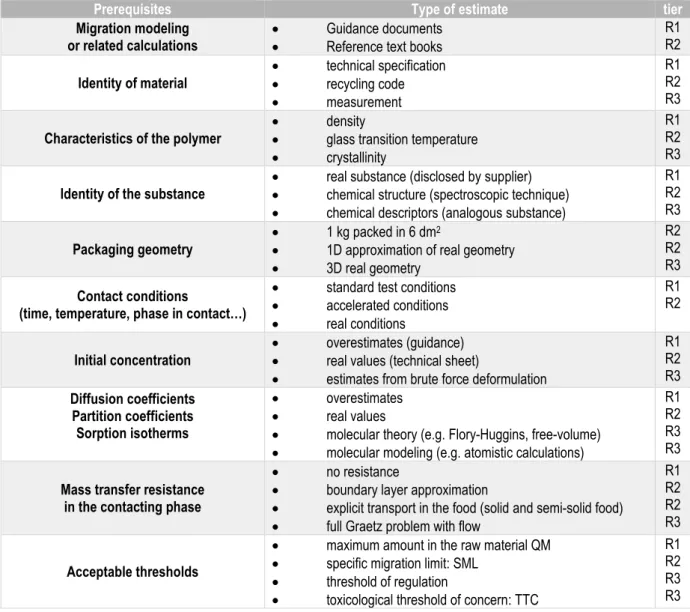
Table II-1. Overview of problem-solving methodologies. ... 14 Table II-2. Comparison between the complexity level defined by Genrich Altshuller and the TRL. ... 16 Table II-3. Typology of optimization problems ... 18 Table II-4. List of relevant monographies to tackle complex optimization problems (convex or not) met in engineering and related fields. ... 22 Table II-5. Classification of ecodesign tools and methodologies and associated problem-solving method (see Table II-1). ... 27 Table II-6.Prerequisites and indicative tiers to be used for compliance testing (R1=most severe, R3=most refined) ... 32
Fo
andBi
correspond to dimensionless time and ratio internal-to-external mass transfer resistance, which are both defined in Table II-7. ... 35 Table II-8. Key dimensionless quantities of the migration from monomaterials. Contact is assumed to be initiated att =
0
. ... 36 Table II-9. Illustration of the main behaviors associated with multilayer structures. The concepts of functional barrier and reservoir are illustrated in Figure II-11. ... 45 Table II-10. Parameters used to construct realistic and conservative migration scenarios depicted in Figure II-12 and Figure II-13. Quantities are expressed respectively to the likely values† for the first layer (the three layers ABC are indexed 1,2,3). They are scalar when thecontribution of each layer as a source is considered in combination with others (the three sources are considered at once). The contributions of individual sources are indicated by 3×1 vectors mentioning the properties of all layers considered as a source or not. ... 48 Table II-11. Expressions of practical partial pressures and saturation concentrations in relationship with the reference state of the substance in the conditions where its migration its studied... 71 Table II-12. Density (kg⋅m-3) of water-ethanol mixture and corresponding volume fraction of
ethanol (
φ
ethanol ) between 10 and 60°C. Volume fractions are calculated from partial molar volumes. ... 76 Table II-13. Recommended distributions for probabilistic modeling of the migration from monolayer materials. The distributions of v* andFo
* are posterior distributions. ... 85 Table II-14. Main steps in LCA analysis ... 100 Table II-15. Overview of typical packaging materials for beverages (after Marsh and Bugusu, 2007;Welle,2011;Ramos et al.,2015) ... 103 Table II-16. Comparative environmental impacts of PET containers vs alternative materials from a selection of studies. Containers are bottles except if mentioned differently. The selection is based on peer-reviewed studies except if indicated otherwise. Considered impacts include the production of containers, transport, disposal of solid waste resulting from packaging and recycling. ... 106Table III-2. List of the considered tiers in the nested formulation
[ ][ ]
i tier T E D S ... 132Table IV-1. Studied PET films and bottles ... 135
The solutes incorporated in the contacting phase (gas, liquid, solution) are listed in Table IV-2. Water and ethanol, alone or in mixtures were the main solutes. The composition of hydroalcoholic mixtures were denoted by their alcohol-by-volume ( 𝑎𝑎𝑏𝑏𝑎𝑎 ), defined as the number of liter (L) of pure ethanol present in 1 L of solution at 20 °C (pure ethanol: 𝑎𝑎𝑏𝑏𝑎𝑎 = 1). Other aromatic solutes were surrogate molecules chosen with double purposes: comparison with literature data on similar PET materials and naturally fluorescent molecules consisting of linearly repeated jumping units. Toluene was preferred to benzene (single jumping unit) due to its high toxicity. ... 142
Table IV-3. Thermodynamic and transport properties of water and ethanol in PET ... 139
Table IV-4. Consolidated data t
D
eo develop and validate high-tier modeling in PET .... 139Table IV-5. Overview of the database for binary diffusion coefficients in PET and in additional polymers used for validation ... 142
Table IV-6. Hydroalcoholic solutions simulating real alcoholic beverages ... 145
Table IV-7. Studied long-term storage conditions ... 146
Table IV-8. Overview of sorption measurement strategies ... 147
Table V-1. Comparison of shelf-lives extrapolated from experiments and calculated from simulations. ... 172
Table V-2. Main parameters used to predict diffusion coefficients, and free volume effects plotted in Figures 5-7. ...228
Table V-3. Main parameters used to predict diffusion coefficients of water and toluene in Figures 8 and 9. ... 236
Table V-4. Comparison of diffusion coefficients determined at different tiers and using different methods... 252
NOMENCLATURE
The symbols are listed in alphabetic order and grouped by similarities. Redundant definitions are given on independent lines. When the definitions may be ambiguous, reference equations are indi-cated. All units are in SI.
Roman symbols
%𝐴𝐴,%𝐵𝐵 volume fractions of saturated gas on the co-sorption microbalance (-)
𝑎𝑎𝑏𝑏𝑎𝑎 alcohol-by-volume (volume of ethanol at 20°C, number of mL of pure ethanol in 1 mL of mixture) 𝑎𝑎𝑖𝑖 activity of solute 𝑖𝑖 (-)
𝑎𝑎𝑙𝑙𝑖𝑖𝑙𝑙 constant equal to 0.24 in the extended FVT (Eq. V.17)
𝐴𝐴 surface area of contact or exposed (m2)
𝐴𝐴𝑝𝑝′ preexponential factor in the Piringer’s Equation (Eq. II.44)
𝐵𝐵(𝜖𝜖) Boltzmann factor (Eq. II.57) 𝐵𝐵𝑖𝑖 =ℎ𝑙𝑙𝑝𝑝
𝐷𝐷𝑖𝑖,𝑝𝑝 dimensionless mass Biot or Sherwood number (-)
𝛼𝛼 crystallinity = volume fraction of crystalline phase (-), celerity of the sound (m⋅s-1)
𝐶𝐶, 𝐶𝐶𝑖𝑖,𝑘𝑘, 𝑪𝑪 volume concentration (mol⋅m-3 or kg⋅m-3), concentration of substance 𝑖𝑖 in the phase/layer 𝑘𝑘,
con-centration field after discretization
𝐶𝐶𝑝𝑝𝑖𝑖 heat capacity of pure substance 𝑖𝑖 (J⋅kg-1⋅K-1)
𝐶𝐶12,𝐶𝐶22 universal WLF constants (17.44 and 51.6 K, respectively)
𝐷𝐷 bottle depth (m)
𝐷𝐷,𝐷𝐷𝑗𝑗 ,𝐷𝐷𝑖𝑖,𝑘𝑘 diffusion coefficient (m2⋅s-1), diffusion coefficient in layer 𝑗𝑗, diffusion coefficient of substance 𝑖𝑖 in the
phase/layer 𝑘𝑘
𝐷𝐷0 preexponential coefficient in the FVT of Vrentas and Duda (m2⋅s-1)
𝐷𝐷𝑙𝑙𝑖𝑖𝑙𝑙, 𝐷𝐷𝑎𝑎 diffusion coefficients of homologous solutes with repeated patterns without and with anchors (m2⋅s -1)
𝐷𝐷𝑏𝑏𝑙𝑙𝑏𝑏𝑏𝑏, 𝐷𝐷𝑎𝑎𝑙𝑙𝑎𝑎ℎ𝑏𝑏𝑜𝑜 diffusion coefficients associated to the isolated blob and anchor (m2⋅s-1)
𝐷𝐷𝐷𝐷𝑏𝑏 =𝐷𝐷𝑖𝑖,𝑝𝑝
𝛽𝛽𝑙𝑙𝑝𝑝2 Deborah number or dimensionless relaxation time (-) 𝐸𝐸∗, 𝐸𝐸
𝑏𝑏𝑙𝑙𝑏𝑏𝑏𝑏∗ , 𝐸𝐸𝑎𝑎𝑙𝑙𝑎𝑎ℎ𝑏𝑏𝑜𝑜∗ specific solute-polymer interaction energy in the FVT of Vrentas and Duda (J⋅mol-1), its
gen-eralizations for an individual blob and anchor, respectively 𝐸𝐸𝑎𝑎,〈𝐸𝐸𝑎𝑎〉 activation energy (J⋅mol-1), apparent activation energy
𝑖𝑖 frequency (Hz) or arbitrary function, generalized driving force 𝑖𝑖 = −𝜕𝜕𝜕𝜕𝜕𝜕𝜕𝜕 𝑖𝑖𝑖𝑖,𝑗𝑗 fugacity of substance 𝑖𝑖 in layer/material 𝑗𝑗
ℎ,ℎ𝑖𝑖 mass transfer coefficient through liquid boundary layer (m⋅s-1), equivalent conductance for
sub-stance 𝑖𝑖
〈ℎ𝐴𝐴+𝐵𝐵〉𝑇𝑇 ensemble-averaged enthalpy of mixing (J⋅mol-1)
𝐻𝐻 bottle height (m)
Δ𝐻𝐻𝐹𝐹𝑚𝑚𝑏𝑏𝑙𝑙𝑎𝑎𝑜𝑜1+𝐹𝐹2 molar enthalpy of the mixing of liquids 𝐹𝐹1 and 𝐹𝐹2 (J⋅mol-1) 〈I〉 dimensionless temperature defined in Eq. V.27 (-)
𝑗𝑗,𝐽𝐽 mass flux density (mol⋅m-2⋅s-1 or kg⋅m-2⋅s-1), index of layer/material with the food indexed 𝑗𝑗 = 0
𝑗𝑗𝑜𝑜𝑒𝑒𝑟𝑟 reference layer maximizing 𝑙𝑙𝑗𝑗𝑘𝑘𝐷𝐷𝑗𝑗𝑗𝑗 (-)
𝑘𝑘, 𝑘𝑘𝑗𝑗 Henry coefficient (Pa⋅m3⋅mol-1 or Pa⋅m3⋅kg-1), Henry coefficient of layer 𝑗𝑗
𝐾𝐾12,𝐾𝐾22 constants in the FVT of Vrentas and Duda related to WLF constants (Eqs V.10 and V.11)
𝐾𝐾𝛼𝛼, 𝐾𝐾𝛽𝛽 polymer specific constants in the FVT extended to flexible solutes (K)
𝐾𝐾𝑖𝑖,𝑗𝑗1/𝑗𝑗2=
𝐶𝐶𝑖𝑖,𝑗𝑗1 𝐶𝐶𝑖𝑖,𝑗𝑗2=
𝛾𝛾𝑖𝑖,𝑗𝑗2
𝛾𝛾𝑖𝑖,𝑗𝑗1 partition coefficient of substance 𝑖𝑖 between the phases/layers 𝑗𝑗1 and 𝑗𝑗2 (-)
𝑙𝑙, 𝑙𝑙𝑗𝑗,𝑙𝑙𝑤𝑤𝑎𝑎𝑙𝑙𝑙𝑙 distance or thickness (m), thickness of layer 𝑗𝑗, thickness of walls
ℓ visited distance (m)
ℓ𝐹𝐹=𝐾𝐾𝐹𝐹/𝑝𝑝𝐿𝐿𝑃𝑃/𝐹𝐹 dimensionless equivalent length of the contacting phase (-)
𝑥𝑥𝑗𝑗 accumulated distance or thickness up to layer 𝑗𝑗
𝑥𝑥𝑃𝑃/𝐹𝐹 material-to-food volume or mass ratio (-)
𝑚𝑚 number of layers (-)
𝑚𝑚𝑖𝑖,𝑚𝑚𝐹𝐹, %Δ𝑚𝑚𝐹𝐹, 𝑚𝑚𝑝𝑝 residual mass of compound 𝑖𝑖, mass of the food (kg), relative weight variation tolerance (-),
mass of the empty packaging unit (kg)
𝑀𝑀, 𝑀𝑀𝑖𝑖, 𝑀𝑀𝑗𝑗 molecular mass (kg⋅mol-3), molecular mass of substance 𝑖𝑖, amount transferred from layer/material
𝑗𝑗
𝑀𝑀𝑎𝑎𝑙𝑙𝑎𝑎ℎ𝑏𝑏𝑜𝑜,𝑀𝑀𝑏𝑏𝑙𝑙𝑏𝑏𝑏𝑏,Δ𝑀𝑀𝑒𝑒𝑒𝑒𝑎𝑎 molecular masses of the terminal rigid units (different of the repeated blob) and the
re-peated pattern (kg⋅mol-3), equivalent molecular associated to the anchor to reach the same diffusion
coefficient as in a regular linear solute
𝑀𝑀𝑝𝑝 accumulated mass of the packaging units corresponding to a consumption rate (kg)
𝑖𝑖 exponent associated to the system of coordinates (𝑖𝑖 = 0: Cartesian, 𝑖𝑖 = 1: cylindrical, 𝑖𝑖 = 2: spherical)
𝑖𝑖𝑖𝑖𝑔𝑔,𝑖𝑖𝑎𝑎 number of molecules 𝑖𝑖 in the gas phase (Eq. IV.13), initial number of molecules of dry air in the
headspace (Eq. IV.14)
𝑖𝑖𝑙𝑙𝑏𝑏𝑛𝑛𝑒𝑒𝑠𝑠,𝑖𝑖𝑠𝑠𝑡𝑡𝑒𝑒𝑝𝑝𝑠𝑠 number of nodes in the discretization scheme, number of steps in the migration scenario
𝑖𝑖𝑜𝑜𝑖𝑖𝑔𝑔𝑖𝑖𝑛𝑛
𝑏𝑏𝑙𝑙𝑏𝑏𝑎𝑎𝑘𝑘𝑠𝑠, 𝑖𝑖𝑏𝑏𝑙𝑙𝑏𝑏𝑏𝑏𝑠𝑠 or 𝑁𝑁 number of rigid jumping units or blobs
𝑁𝑁,𝑁𝑁0 number of substances
𝑠𝑠, 𝑠𝑠𝑖𝑖,𝑫𝑫 partial pressure (Pa), partial pressure of solute 𝑖𝑖, parameter vector
𝑃𝑃(𝑇𝑇, 𝑇𝑇𝑔𝑔) polymer function in the extended FVT (Eqs. V.15, V.20)
𝑞𝑞 =𝑙𝑙𝜕𝜕
𝑝𝑝, 𝑞𝑞𝑙𝑙 dimensionless position (-), zeros of the transcendental equation tan 𝑞𝑞𝑙𝑙= −ℓ𝐹𝐹𝑞𝑞𝑙𝑙 (Eq. II.19) 𝑄𝑄 ,𝑄𝑄 total volume flow rates of ways A and B of the co-sorption microbalance (m3⋅s-1)
𝑀𝑀 =𝛼𝛼𝑔𝑔
𝛼𝛼𝑐𝑐 subcooling ratio (-) 𝒓𝒓 position vector
𝑀𝑀𝑖𝑖,𝑘𝑘 ≈𝑉𝑉�𝑉𝑉�𝑘𝑘𝑖𝑖 number of molecules of phase 𝑘𝑘 displaced by the insertion of solute 𝑖𝑖
ℜ overall mass transfer resistance (s⋅m-1)
𝑥𝑥 ideal gas constant (8.314 J⋅K-1⋅mol-1) 𝑥𝑥𝐻𝐻 relative humidity (%)
𝑆𝑆𝑙𝑙 summation term in Eq. II.17
𝑡𝑡 time (s)
𝑡𝑡𝑎𝑎𝑏𝑏𝑙𝑙𝑠𝑠𝑐𝑐𝑚𝑚𝑝𝑝𝑡𝑡𝑖𝑖𝑏𝑏𝑙𝑙 time to consume the content of the packaging (s)
𝑡𝑡𝑠𝑠ℎ𝑒𝑒𝑙𝑙𝑟𝑟 shelf-life (s)
𝑇𝑇, 𝑇𝑇𝑔𝑔, 𝑇𝑇𝑖𝑖,𝑚𝑚 temperature (K), glass transition temperature, melting temperature of pure compound 𝑖𝑖
𝑠𝑠,𝑎𝑎 parameters in the FVT of Vrentas and Duda so that 𝑉𝑉�2∗= 𝑠𝑠 + 𝑎𝑎𝑇𝑇𝑔𝑔
𝑠𝑠 =𝐶𝐶(𝑥𝑥,𝑡𝑡)
𝐶𝐶𝑟𝑟𝑟𝑟𝑟𝑟 dimensionless concentration (-), usually with 𝐶𝐶𝑜𝑜𝑒𝑒𝑟𝑟 the averaged initial concentration 𝑎𝑎̅∗= 𝐶𝐶𝐹𝐹
𝐶𝐶𝐹𝐹𝑟𝑟𝑒𝑒 normalized concentration representing the distance to equilibrium (-)
𝑉𝑉�1∗, 𝑉𝑉�1∗𝑙𝑙𝑖𝑖𝑙𝑙 critical volume of the solute jumping unit or of its largest rigid unit (m3), value for linear solutes
𝑉𝑉𝑎𝑎𝑏𝑏𝑙𝑙𝑠𝑠𝑐𝑐𝑚𝑚𝑝𝑝𝑡𝑡𝑖𝑖𝑏𝑏𝑙𝑙 volume of food consumed during a prescribed amount of time (m3)
𝑉𝑉𝐹𝐹, 𝑉𝑉𝐹𝐹𝑡𝑡=0,𝑉𝑉𝑏𝑏𝑒𝑒𝑠𝑠𝑒𝑒𝑜𝑜𝑎𝑎𝑔𝑔𝑒𝑒, 𝑉𝑉ℎ𝑒𝑒𝑎𝑎𝑛𝑛 food volume (m3), initial food volume, packaging capacity, volume of the headspace
𝑉𝑉�2∗ specific hole free volume of the equilibrium liquid polymer in the FVT of Vrentas and Duda (m3)
𝑉𝑉�2∗ critical volume of the polymer jumping unit (m3, Eq. V.13)
𝑉𝑉�𝑖𝑖 molar volume (m3⋅mol-1)
𝑉𝑉𝑜𝑜𝑖𝑖𝑔𝑔𝑖𝑖𝑛𝑛 𝑏𝑏𝑙𝑙𝑏𝑏𝑎𝑎𝑘𝑘
𝑠𝑠𝑛𝑛𝑣𝑣 volume of the rigid unit (m3)
𝑊𝑊 bottle width (m)
𝒙𝒙 or 𝒚𝒚, 𝒙𝒙𝑳𝑳, 𝒙𝒙𝑼𝑼 input vectors, lower bounds of 𝒙𝒙, upper bounds of 𝒙𝒙
𝑥𝑥 position (m)
𝑥𝑥𝑖𝑖 molar fraction in compound 𝑖𝑖
𝑧𝑧 number of neighbors in the off-lattice FH formulation (-)
Greek symbols
𝛼𝛼, 𝛼𝛼𝑙𝑙𝑖𝑖𝑙𝑙,𝛼𝛼𝑎𝑎 scaling exponents of diffusion coefficients with their molecular mass at infinite dilution (-), idem for
linear solutes, idem for solutes with anchors
Γ = 1 +∂lnγ𝜕𝜕𝑙𝑙𝑙𝑙𝜕𝜕𝑣𝑣 thermodynamic factor associated to mutual diffusion coefficients (-)
Δ𝑎𝑎𝑤𝑤, Δ𝑎𝑎𝑒𝑒 tolerances of the co-sorption microbalance on the variation of activities of water and ethanol (-)
Δ𝑗𝑗 fluctuation of mass flux (kg⋅s-1)
Δ𝑠𝑠 difference of partial pressure responsible of permeation (Pa), fluctuation of partial pressure 𝜖𝜖, 𝜖𝜖𝐴𝐴+𝐵𝐵 small variation or porosity, pair contact energy (J or J⋅mol-1), pair contact energy between 𝐴𝐴 and 𝐵𝐵
𝜁𝜁,𝜁𝜁𝑡𝑡𝑜𝑜𝑎𝑎𝑎𝑎𝑒𝑒,𝜁𝜁𝑚𝑚𝑐𝑐𝑡𝑡𝑐𝑐𝑎𝑎𝑙𝑙 friction coefficient (J⋅s⋅mol-1⋅ m-2), at infinite dilution and higher concentration, respectively
𝜅𝜅 preexponential factor in Eq. II.6 (Hz)
𝜆𝜆 arbitrary weight in Eq. II.3, parameter related to the thermal expansion of the polymer in the FVT of Vrentas and Duda (Eq. V.12)
𝜇𝜇, 𝜇𝜇𝑖𝑖,𝑘𝑘 chemical potential (J⋅mol-1), chemical potential of solute 𝑖𝑖 in phase 𝑘𝑘
𝜉𝜉 = 𝑉𝑉�1∗
𝑉𝑉�2∗(𝑇𝑇𝑔𝑔), 𝜉𝜉𝑀𝑀 ratio of the critical volume of the solute jumping unit to the critical volume of the polymer jumping unit in the FVT of Vrentas and Duda (-), value of 𝜉𝜉 associated with molecular mass 𝑀𝑀
𝜌𝜌, 𝜌𝜌𝑘𝑘 molar density (mol⋅m-3) or probability density (m-3), density of phase 𝑘𝑘 (kg⋅m-3)
𝜏𝜏 dimensionless excess activation energy in the Piringer’s equation (Eq. II.44) 𝜏𝜏0 longest polymer relaxation time (s)
𝜙𝜙𝑖𝑖,𝑘𝑘 volume fraction of solute 𝑖𝑖 in phase 𝑘𝑘 (-)
𝜒𝜒𝑖𝑖,𝑘𝑘 or 𝜒𝜒𝑖𝑖+𝑘𝑘 binary Flory-Huggins coefficient between the components 𝑖𝑖 and 𝑘𝑘 (-)
Ψ =𝜋𝜋 1 3�6𝑉𝑉𝐹𝐹𝑡𝑡=0�23
𝐴𝐴 sphericity of the packaging with a capacity 𝑉𝑉𝐹𝐹𝑡𝑡=0 and an exposed surface area 𝐴𝐴
𝜔𝜔𝑖𝑖 weights (-)
Mathematical operators
Ω𝑖𝑖𝑙𝑙𝑡𝑡 internal volume
𝜕𝜕Ω𝑖𝑖𝑙𝑙𝑡𝑡 internal surfaces in contact with the liquid or its vapors
𝑎𝑎𝑀𝑀𝑇𝑇𝑚𝑚𝑖𝑖𝑖𝑖(𝑖𝑖) = 𝑥𝑥𝑚𝑚𝑖𝑖𝑙𝑙 argument of the minimum (i.e. 𝑖𝑖(𝑥𝑥𝑚𝑚𝑖𝑖𝑙𝑙) is minimum)
Δ difference operator
𝑖𝑖𝑖𝑖,𝑃𝑃𝑇𝑇 (𝑎𝑎𝑖𝑖) = 𝐷𝐷𝑖𝑖, 𝑖𝑖𝑖𝑖,𝑃𝑃𝑇𝑇 −1(𝐷𝐷𝑖𝑖) = 𝑎𝑎𝑖𝑖 sorption isotherm, its inverse
𝑖𝑖𝑘𝑘(𝒙𝒙),𝑇𝑇(𝒙𝒙),ℎ(𝒙𝒙) 𝑘𝑘𝑡𝑡ℎ goal function of 𝒙𝒙, lower constraints, upper constraints
𝑖𝑖𝑠𝑠𝑇𝑇(… ),𝑇𝑇𝑠𝑠𝑇𝑇(… ) FVT model for rigid solutes and anchors (Figure V.24)
𝑖𝑖𝑋𝑋(𝑥𝑥) = 𝑠𝑠𝑀𝑀(𝑋𝑋 = 𝑥𝑥) probability that the random variable 𝑋𝑋 takes the value 𝑥𝑥 (probabilistic description)
𝐹𝐹𝑋𝑋(𝑥𝑥) = 𝑠𝑠𝑀𝑀(𝑋𝑋 ≤ 𝑥𝑥) cumulated density function of the random variable 𝑋𝑋 (probabilistic description)
𝐺𝐺𝑎𝑎𝑚𝑚𝑚𝑚𝑎𝑎(𝑎𝑎Γ, 𝑏𝑏Γ) gamma distribution of parameters 𝑎𝑎Γ and 𝑏𝑏Γ
𝑱𝑱 Jacobian
𝑴𝑴 diffusion operator matching boundary conditions so that the mass diffusion problem is discretized as
𝜕𝜕𝑪𝑪
𝜕𝜕𝑡𝑡 = 𝑴𝑴𝑪𝑪.
𝑁𝑁𝐹𝐹𝑀𝑀𝑚𝑚�1, 𝑠𝑠𝐶𝐶0� normal distribution with an unitary expectation and a standard deviation 𝑠𝑠𝐶𝐶0 𝑄𝑄𝑋𝑋 overestimation factor of 𝑋𝑋
𝑠𝑠𝑋𝑋 shape factor associated to the distribution of 𝑋𝑋∗ (probabilistic description)
𝑋𝑋� likely value of 𝑋𝑋 (probabilistic description) 𝑋𝑋� sample of 𝑋𝑋 (probabilistic description)
〈𝑋𝑋〉𝑇𝑇 ensemble average of 𝑋𝑋 at temperature 𝑇𝑇
⌊𝑋𝑋⌋ lower limit of 𝑋𝑋 (floor) ⌈𝑋𝑋⌉ upper limit of 𝑋𝑋 (ceiling)
𝑋𝑋𝑖𝑖 = ℎ𝑖𝑖−1(𝑌𝑌1, 𝑌𝑌2, … , 𝑌𝑌𝑙𝑙) back-transformation of random variables 𝑌𝑌1, 𝑌𝑌2,…,𝑌𝑌𝑙𝑙 when it exists
𝑌𝑌𝑖𝑖 = ℎ𝑖𝑖(𝑋𝑋1, 𝑋𝑋2, … , 𝑋𝑋𝑙𝑙) multivariate transformation of random variables 𝑋𝑋1, 𝑋𝑋2,…,𝑋𝑋𝑙𝑙
𝑊𝑊𝐷𝐷𝑖𝑖𝑏𝑏(0, 𝑠𝑠𝑡𝑡) = 𝑠𝑠𝑡𝑡𝑥𝑥𝑠𝑠𝑡𝑡−1𝐷𝐷−𝜕𝜕𝑠𝑠𝑡𝑡 for 𝑥𝑥 ≥ 0 and 0 otherwise: Weibull distribution of parameters 1 and 𝑠𝑠𝑡𝑡
Subscripts
0 initial
1 solute in Flory notations 2 polymer in Flory notations 𝛼𝛼 , 𝛽𝛽, 𝛿𝛿 arbitrary phases 𝛼𝛼, 𝛽𝛽, 𝛿𝛿 𝑎𝑎 dry air
𝐴𝐴+𝐵𝐵 𝐴𝐴 and 𝐵𝐵 in mixture (random contacts) 𝐴𝐴→𝐵𝐵 transition from 𝐴𝐴 to 𝐵𝐵 (𝐴𝐴𝐵𝐵) copolymer AB 𝑏𝑏𝑒𝑒𝑠𝑠𝑒𝑒𝑜𝑜𝑎𝑎𝑔𝑔𝑒𝑒 beverage 𝑏𝑏𝑏𝑏𝑡𝑡𝑡𝑡𝑙𝑙𝑒𝑒 bottle 𝐵𝐵𝐵𝐵 boundary layer 𝑒𝑒 ethanol 𝑒𝑒𝑒𝑒 at equilibrium
𝐹𝐹 food or liquid food simulant ℎ𝑒𝑒𝑎𝑎𝑛𝑛 in the headspace
𝑖𝑖 solute index 𝑖𝑖𝑙𝑙𝑡𝑡 internal domain 𝑗𝑗 material or layer index
𝑘𝑘 component, variable or dimension index 𝑙𝑙𝑖𝑖𝑙𝑙 linear solutes
𝑚𝑚𝑐𝑐𝑡𝑡𝑐𝑐𝑎𝑎𝑙𝑙 mutual (high concentration) 𝑝𝑝𝑐𝑐𝑜𝑜𝑒𝑒 pure compound
𝑃𝑃 polymer 𝑜𝑜𝑖𝑖𝑔𝑔𝑖𝑖𝑛𝑛
𝑏𝑏𝑙𝑙𝑏𝑏𝑎𝑎𝑘𝑘 rigid units (blob) 𝑠𝑠𝑎𝑎𝑡𝑡 saturation
𝑡𝑡𝑏𝑏𝑡𝑡𝑎𝑎𝑙𝑙 accumulated (e.g. total partial pressures) 𝑡𝑡𝑜𝑜𝑎𝑎𝑎𝑎𝑒𝑒 trace (infinite dilution)
𝑤𝑤 water 𝑤𝑤𝑎𝑎𝑙𝑙𝑙𝑙 walls
𝑔𝑔 in the gas phase
𝑙𝑙𝑖𝑖𝑘𝑘𝑒𝑒𝑙𝑙𝑙𝑙 likely value (probabilistic description) 𝐵𝐵 liquid state
𝑚𝑚𝑐𝑐𝑡𝑡𝑐𝑐𝑎𝑎𝑙𝑙 mutual (high concentration)
𝑜𝑜𝑒𝑒𝑟𝑟 reference value used for normalization 𝑠𝑠𝑎𝑎𝑡𝑡 saturation
𝑆𝑆 solid state 𝑡𝑡 at time 𝑡𝑡 𝑡𝑡ℎ𝑒𝑒𝑏𝑏𝑜𝑜𝑒𝑒𝑡𝑡𝑖𝑖𝑎𝑎𝑎𝑎𝑙𝑙 theoretical value 𝑡𝑡𝑖𝑖𝑒𝑒𝑜𝑜 𝑖𝑖 evaluation at tier 𝑖𝑖 𝑡𝑡𝑜𝑜𝑎𝑎𝑎𝑎𝑒𝑒 trace (infinite dilution) 𝑇𝑇 at temperature 𝑇𝑇
𝑠𝑠 relative to volume fraction 𝑠𝑠𝑛𝑛𝑣𝑣 van-der-Waals
𝜕𝜕,𝑙𝑙,𝑧𝑧,𝑡𝑡 function of spatial coordinates 𝑥𝑥, 𝑀𝑀, 𝑧𝑧 and time 𝑡𝑡
ABBREVIATIONS
[E][D][S] Evaluation, Decision, SolvingBC boundary condition
𝛼𝛼𝑀𝑀𝑖𝑖 cumulated density function CFD computational fluid dynamics
CFDA Chinese Food and Drug Administration CFR Code of Federal Regulations
CM center-of-mass
D4S Design for Sustainability
DDBST Dortmund Data Bank Software + Separation Technology
DfE Design for Environment
DVS dynamic vapor sorption
EC European Communities
EFSA European Food Safety Authority ENR Event Notification Reports
EU European Union
EUROVOC multilingual, multidisciplinary thesaurus covering the activities of the EU
FDA US Food and Drug Administration
FDCA 2,5-furandicarboxylic acid
FH2 Flory-Huggins theory for binary mixtures FH3 Flory-Huggins theory for ternary mixtures FMECA Failure Mode Effects and Criticality Analysis
FV free volume
FVT free volume theory
h-FV hole Free-Volume
IC Initial Condition
ISO International Organization for Standardization LCA life cycle assessment
LDPE low-density polyethylene
NFPA National Fire Protection Association
NIST National Institute of Standards and Technology NRC Event Notification Reports
OECD Organization for Economic Co-operation and Development OIML International Organization of Legal Metrology
OML overall migration limit
PA6 Polyamide 6
PDE partial differential equation 𝑠𝑠𝑀𝑀𝑖𝑖 probability density function PEF polyethylene furanoate
PEN polyethylene naphthalate
PET polyethylene terephthalate PMMA poly (methyl methacrylate)
PP polypropylene
PS polystyrene
PVAc polyvinyl acetate
PVC polyvinyl chloride
QM maximum amount
RASFF Rapid Alert System for Food and Feed
RH relative humidity
SM safety margin
SML specific migration limit
TE transport equation
TRIZ theory of inventive problem solving
UN United Nations
UNEP United Nations Environment Programme
UNIFAC UNIQUAC Functional-group Activity Coefficients
US United States of America
WLF William-Landel-Ferry
Chapter I. Introduction
I.1. Context
• Global challenges for food packaging
During the last decade, two opposite views on the benefits of food packaging have emerged. The world population is projected to reach 9.8 billion in 2050 from 7.6 billion today (UN, 2017), with 68% living in urban areas (UN, 2018). According to the dominant point of view, food packaging provides the solution of delivering food to urban and aging populations, living distantly from production areas, and wishing read-to-eat meals, consumer convenience, and experience. In this perspective, food packaging contributes to reducing food waste (Williams and Wikström, 2011;Williams et al., 2012). All choices need to be sustainable and efficient: first on the market, cost competitive, enhancing consumer experience, and minimiz-ing environmental impacts (Coles and Kirwan, 2011). Food safety issues are envisioned as a trade-off between the food protection and hygiene brought by the packaging and the risk of contamination associated with their use.
Alternative opinions on food packaging have evolved progressively from beneficial to significantly negative (Hamaide et al., 2014). They have been sucessively associated with po-tential sources of harmful substances, wastes, greenhouse gases, etc. During the last meeting of the Food Packaging Forum (Stieger, 2018), experts concluded that materials in contact with food (plastics, elastomers, varnishes, adhesives, printing inks, paper, and board) are likely to be the main source of chemical contaminants in food. Among them, plastic materials have the largest market share for food contact applications (Geueke et al., 2018). They are responsible for 80-85% of the total marine litter affecting all the world’s oceans (Bergmann et al., 2017), including the deep seafloor (Pierdomenico et al., 2019). The use of plastics in multimaterial-multilayer systems possibly printed and coated complicate the identification, collect and recy-cling of these materials (PlasticsEurope, 2018), with a growing contribution of ready-to-eat foods (Silberbauer and Schmid, 2017). Additionally, new raising concerns are brought by