Publisher’s version / Version de l'éditeur:
Vous avez des questions? Nous pouvons vous aider. Pour communiquer directement avec un auteur, consultez la première page de la revue dans laquelle son article a été publié afin de trouver ses coordonnées. Si vous n’arrivez Questions? Contact the NRC Publications Archive team at
PublicationsArchive-ArchivesPublications@nrc-cnrc.gc.ca. If you wish to email the authors directly, please see the first page of the publication for their contact information.
https://publications-cnrc.canada.ca/fra/droits
L’accès à ce site Web et l’utilisation de son contenu sont assujettis aux conditions présentées dans le site LISEZ CES CONDITIONS ATTENTIVEMENT AVANT D’UTILISER CE SITE WEB.
Technical Report (National Research Council of Canada. Ocean, Coastal and
River Engineering), 2019-03-31
READ THESE TERMS AND CONDITIONS CAREFULLY BEFORE USING THIS WEBSITE.
https://nrc-publications.canada.ca/eng/copyright
NRC Publications Archive Record / Notice des Archives des publications du CNRC :
https://nrc-publications.canada.ca/eng/view/object/?id=b848edb3-2bcc-4b5c-8d44-80555973cee1 https://publications-cnrc.canada.ca/fra/voir/objet/?id=b848edb3-2bcc-4b5c-8d44-80555973cee1
NRC Publications Archive
Archives des publications du CNRC
For the publisher’s version, please access the DOI link below./ Pour consulter la version de l’éditeur, utilisez le lien DOI ci-dessous.
https://doi.org/10.4224/40000404
Access and use of this website and the material on it are subject to the Terms and Conditions set forth at
Reinforcement of ice covers for transportation: material investigation
and preliminary laboratory testing
RE)
PAGE i
Reinforcement of ice covers for
transportation: Material investigation
and preliminary laboratory testing
Report No.: OCRE-TR-2018-031
Authors: Paul Barrette, Lawrence Charlebois, Bradley Butt
Ocean, Coastal and River Engineering (OCRE)
Prepared for:
Transport Canada
Crown-Indigenous Relations and Northern Affairs Canada
Arctic Program (National Research Council)
© 2019 Her Majesty the Queen in Right of Canada,
as represented by the National Research Council of Canada. Cat. No. NR16-289/2019E-PDF
Executive summary
From an engineering perspective, ice is a highly convenient building material, for a number of
reasons, namely, it is not only ‘self-created’ but it also removes itself at the end of the winter.
For this reason (amongst others), floating ice covers have been used extensively throughout history for transportation purposes. The challenge is that we have little control over these processes. Our ability to predict them (e.g. when is the river going to freeze? will it freeze entirely or will we see open water leads again?) is also very limited. Furthermore, these
structures are highly vulnerable to climate change. Ice cover reinforcement is a way to increase the predictability of the ice’s load bearing capacity and of its capability to sustain vehicle weight,
thereby reducing the required thickness for safe usage. Since the early 1940’s, a variety of
reinforcing materials have been incorporated in ice to improve its resistance to fracture and ultimate strength. These reinforced ice composites have been tested in laboratory and field studies to determine their engineering characteristics.
The work reported herein is to identify suitable reinforcement materials, to characterize how they affect the mechanical behavior when embedded in ice and to assess the feasibility of field deployment.
Macroscopic and microscopic reinforcement techniques are described along with technical and practical considerations for the design and construction of reinforced ice covers. A relative assessment of the techniques is provided and some details on a candidate reinforcing material, polymeric geogrid, are provided. As a preliminary laboratory phase, two test series were
conducted in a refrigerated chamber – one without reinforcement (ice only), the other with
reinforcement. The reinforcement consisted of heavy duty plastic cable ties (also called ‘tie
wraps’). The ice was produced from an insulated stainless steel rectangular basin. Rough beams were then extracted from the basin and machined into prismatic beams 400 mm in length. These were tested in a four-point loading configuration.
The results show that:
The outcome of testing with ice is fully consistent with that of other studies, providing confidence on the validity of our experimental procedures.
The average beam ultimate yield strength for the non-reinforced and the reinforced ice were comparable, which indicates the reinforcement did not make the ice stronger in these preliminary tests. This may have to do with the nature of the bonding at the interface between the cable ties and the ice. On the other hand, beams reinforced with three cable ties were stronger than those with two ties, which is in contradiction with the previous observation. This will require further examination in the follow-up investigations. The energy absorbed by the reinforced ice, which translates into the work done by the
loading system onto the beam, was significantly higher than for the non-reinforced ice. This is because time to failure for the former was longer. This indicates a higher resilience to failure for the reinforced ice beams. More information on the nature of the deformation, i.e. the details of beam failure, will also be examined in follow-up
Contents
EXECUTIVE SUMMARY ... III
TABLE OF FIGURES ... VII
TABLES OF TABLES ... IX
1
INTRODUCTION ... 1
1.1 Ice – An unpredictable material ... 1
1.2 Objectives... 2
2
NATURAL ICE COVERS ... 3
2.1 Ice growth ... 3 2.2 Ice types ... 4 2.2.1 Columnar ice ... 4 2.2.2 Lake ice ... 4 2.2.3 Frazil ice ... 4 2.2.4 Agglomerate ice ... 4
2.3 Ice cover for transportation ... 4
3
INVESTIGATING THE EFFECTIVENESS OF REINFORCED ICE ... 5
3.1 Load and deformation ... 5
3.1.1 Mechanical energy... 5 3.1.2 Material response ... 6 3.2 Loading modes ... 6 3.2.1 Tension ... 6 3.2.2 Compression ... 6 3.2.3 Flexural loading ... 6 3.2.4 Load application ... 6 3.3 Response to loading ... 7 3.3.1 Elastic deformation ... 7 3.3.2 Creep deformation ... 7
3.3.3 Delayed elastic deformation ... 8
3.3.4 Cracks, fractures, fissures ... 8
3.3.5 Ice failure ... 9
3.3.6 Breakthrough ... 9
3.4 Strength ... 9
3.4.1 Flexural strength ... 9
3.4.2 Ultimate yield strength (or yield strength) ... 9
3.6 Reinforcement material ... 9
4
ICE REINFORCEMENT ... 10
4.1 Origins and development of ice reinforcement ... 10
4.2 Overview of modern ice reinforcement techniques ... 10
4.2.1 Macroscopic ice reinforcement ... 10
4.2.2 Microscopic ice reinforcement ... 12
4.2.3 Requirements ... 12 4.3 Design Considerations ... 13 4.3.1 Loading mode ... 13 4.3.2 Reinforcement characteristics ... 13 4.3.3 Environmental Compatibility ... 15 4.4 Construction considerations ... 15 4.4.1 Availability ... 15 4.4.2 Constructability ... 15 4.4.3 Reliability ... 16 4.4.4 Recoverability... 16 4.4.5 Reusability ... 16 4.5 Stakeholder considerations ... 17 4.5.1 Stakeholder acceptability ... 17 4.5.2 Regulations ... 17
4.5.3 Value for money (relative cost) ... 17
4.6 Assessment of modern ice reinforcement techniques ... 17
4.6.1 Geogrid reinforcement materials ... 19
4.6.2 Candidate materials ... 25
5
LABORATORY INVESTIGATIONS ... 27
5.1 Reinforcement material ... 27
5.2 Ice beam production ... 27
5.3 Testing ... 28
5.3.1 Temperature ... 28
5.3.2 Testing configuration ... 31
5.3.3 Monitoring load and displacement ... 32
5.3.4 Beam testing ... 32
5.3.5 Data processing... 35
5.4 Results ... 37
5.5 Discussion on the preliminary results ... 38
6
SUMMARY ... 40
APPENDICES ... 43
Appendix 1 ... 44 Appendix 2 ... 50Table of figures
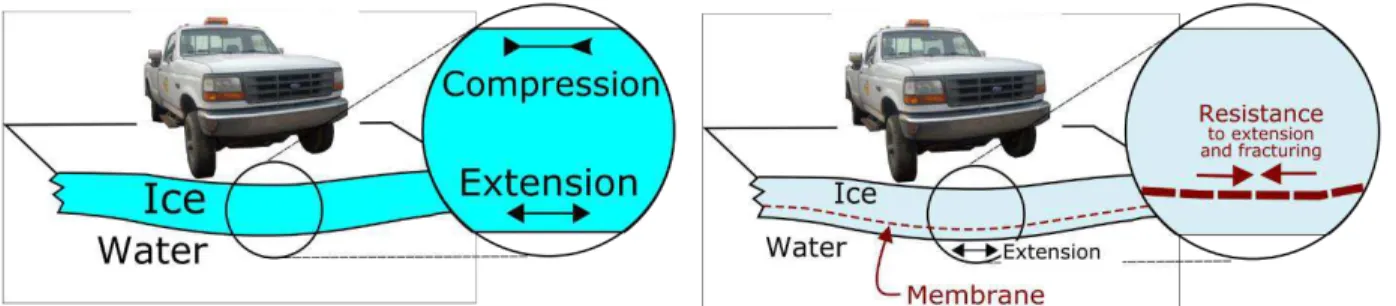
Figure 1: Left) Stress regime inside an ice cover loaded vertically. Right) Incorporation of a membrane or geogrid inside an ice cover, to increase its resistance to the extensional component. ... 2 Figure 2: A common scenario for the initiation and growth of an ice cover. Note the
columnar-grained structure. ... 3 Figure 3: Two methods to evaluate the effectiveness of reinforced ice in a laboratory: Left) beam
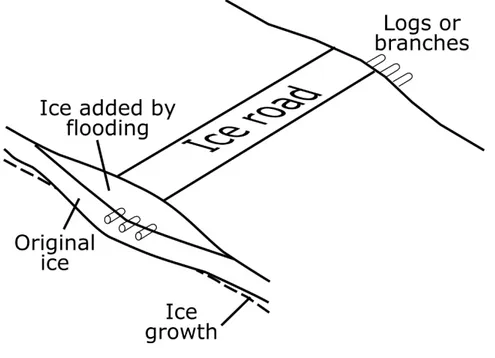
testing. Right) Vertical loading of an ice sheet – the basin may be several meters in width, depending on the size of the environmental chamber where it is located. ... 5 Figure 4: Cracking pattern on an ice road. ... 8 Figure 5: An example of an ice road locally reinforced with logs or branches (Ohstrom and
DenHartog, 1976). ...11
Figure 6: Deployment of a geogrid - this one is of the uniaxial type. ...20
Figure 7: Deployment of a biaxial geogrid. ...21
Figure 8: Left) Field deployment of a triaxial geogrid. Right) Schematics showing the load
distribution exerted by a tire onto the supporting medium and the relevance of a triaxial material to compensate for strains in all directions...24 Figure 9: Close-up of a polymer-coated fibre glass. ...25
Figure 10: Material selected for testing: Upper left) Tensar s Biaxial Type 1 Geogrid. Upper
right) One of Tensar s Triax geogrid. Lower left) Strata s SG 150. Lower right) A roll
of Tensars biaxial material. ...26
Figure 11: Cable ties used in the preliminary phase of the beam bending test program. In the right-hand picture, one may note the corrugations on that side of the cable, as is the case of all cable ties. ...28 Figure 12: Upper left) Growth basin. Upper right) Steps followed for beam production.
Below) The cables set-up before (left) and after (right) ice growth around them. Glove
for scale. ...29 Figure 13: Ice beam extraction. ...29 Figure 14: Upper left) Beams with rough cuts. Upper right) Beam after machining the sides
(scale divided into 50 mm partitions) – the elliptic outline in that photo shows a piece of ice enclosing a temperature probe, for ice beam temperature monitoring. Below) Four-point beam testing configuration, target beam dimensions and symbols. ...30 Figure 15: Upper) Four-point rig system (made from aluminum). Below left) Points of load
application in the four-point beam testing rig, with construction details. Below right) Difference in loading regime and how it affects beam failure. ...31 Figure 16 Below left) An ice beam in the test frame. Below right) A reinforced ice beam after the
test, showing the failure surface ( cleavage ) – see text for discussion. ...32
Figure 17: Two distinct scenarios and amount of work associated with each, corresponding to the area below the load/displacement trace. Left) For a constant load. Right) When the load on the ice is increased up to failure. ...36
Figure 18: A general representation of the load behavior for both the non-reinforced and the reinforced ice beams. The area below the load traces is the work done by the loading system onto the ice beam, equivalent to the energy they absorbed. ...37 Figure 19: Comparison of our test data with the compilation from Timco and O'Brien (1994) –
blue (left) and red (right) lines are for the non-reinforced and reinforced ice, respectively. The vertical extent of each is the range of value; the horizontal bar is the average. Both
Tables of tables
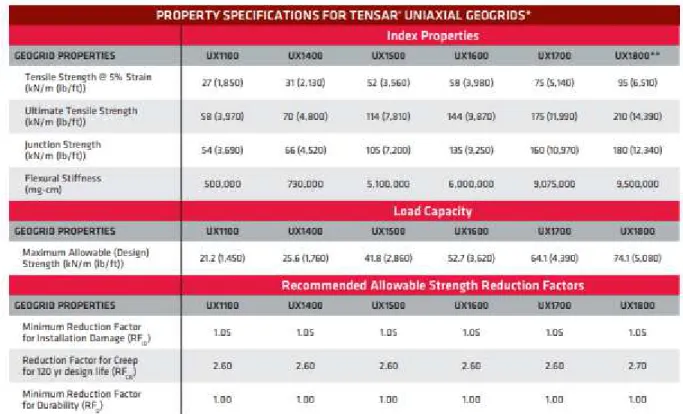
Table 1: Assessment of common ice reinforcement approaches. ...18 Table 2: Example of specifications for a uniaxial material. ...22 Table 3: Example of specifications for a biaxial material. ...23 Table 4: Test grid and outcome for non-reinforced ice beams. The symbols (L, D, W and T) are
explained in Figure 14. The Time to failure and the Displacement column are
from the onset of load application to rupture. The work was the area below the load traces. ...33 Table 5: Test grid and outcome for reinforced ice beams. The symbols (L, D, W and T) are
explained in Figure 14. The Time to failure and the Displacement column are
from the onset of load application to rupture. The work was the area below the load traces. The number of ties inside the ice (two or three) is also indicated. ...34 Table 6: Comparison between the data produced in the present study and those of two previous
1 Introduction
Northern communities in Canada rely on winter roads – roads that only exist in the winter – to access bulk necessities (fuel, construction material) and connect to neighbouring communities and further afield. Any winter road, however, is only as reliable as its weakest link. These weak links are commonly along segments that run on top of floating ice covers (lakes or narrow rivers), sometimes referred to as ice bridges or ice crossings. Moreover, in the Arctic and along the Labrador coast line, communities travel on frozen sea ice. These over-ice segments have to contend with a warming climate, which reduces their yearly operational lifespan and promotes mid-season closures. The reason is that warmer air temperatures make it more difficult to reach a sufficient ice thickness for over-ice segments, which is crucial to these operations because of safety concerns, i.e. breakthroughs. Ice thickening via flooding and/or spray icing are common procedures, but they are becoming insufficient.
1.1 Ice
– An unpredictable material
Most engineering materials used today (e.g. steel, metals and alloys, ceramics, concrete, asphalt, plastics and other organic synthetic compounds) are human-made and, consequently, their properties are controllable and relatively homogeneous. This makes their mechanical behavior predictable. In the context of winter roads, ice making up frozen water surfaces is also an engineering material. But it is produced and controlled by nature, which does not promote uniformity. For instance, ice covers are typically made from layers of different densities. They also have an extensive, random network of internal cracks. The quality of the ice and its
mechanical integrity are subject to both spatial and temporal variations. As a consequence, it is very difficult to estimate with any measure of certainty how much load a given ice cover can
withstand. As Lorne Gold, formerly from NRC and a pioneer in ice road research, stated, “[i]t is
not possible to predict with confidence the maximum loads that can be placed safely on ice covers because of their relatively high temperature and the naturally occurring variations in their characteristics” Gold (1971).
Moreover, ice growth and thickening, natural or via artificial flooding and/or spray icing, will occur but only if the air temperature allows it. At times, it does not. That is to say, even the currently existing methods to increase ice thickness, to mitigate risks of breakthrough and ensure safe and effective winter operations, are at the mercy of the weather.
Incorporating an engineered material – an adequate membrane, geotextile or geogrid - into an
ice cover (Figure 1) would achieve a number of goals: 1) It would increase the ice bearing capacity;
2) It would increase the predictability of bearing capacity and its capability to sustain vehicle weight;
3) Even if the ice does fail (i.e. fracture), the engineered material inside the ice would increase ice cover resilience to failure;
4) This material would become a tool available to operators for strengthening known weak
links in a more effective manner and prevent these locations from shortening the road’s
yearly operational lifespan.
A project in research and development (R&D), henceforth referred to as the ‘Project’, was
road operations. Drawing from previous work done in the past by various research groups, the idea is to identify a target reinforcement material, test it in the laboratory and generate enough information on its performance to guide prospective follow-up work in the form of one or more pilot studies. This report describes preliminary outcome.
Figure 1: Left) Stress regime inside an ice cover loaded vertically. Right) Incorporation of a membrane or geogrid inside an ice cover, to increase its resistance to the extensional component.
1.2 Objectives
The report has several objectives. These are:
1. To provide an overview of natural ice covers in the context of surface transportation (Section 2).
2. To provide an overview of concepts and principles that form the basis for investigating ice cover strengthening (Section 3).
3. To summarize previous investigations on ice strengthening methods, to describe various materials that could be used to reinforce ice covers, and to assess the various
parameters that should be considered in selecting good candidates (Section 4). 4. To summarize the outcome of a preliminary experimental program aimed at comparing
2 Natural ice covers
Floating ice covers are found on lakes, rivers and sea expanses. They can be quite uniform or they can vary in thickness and internal structure. This depends on many factors, notably initial freeze-up, growth history and internal deformation (e.g. thermal cracking, pressure ridges). These are, in turn, are a function of air temperature, precipitation, winds, currents, wave regimes, water level changes, and size of the water body, amongst other factors. Since these factors vary throughout the winter, an ice cover will keep evolving, at least to some extent, until spring break-up. In short, ice covers are complex and difficult to predict.
2.1 Ice growth
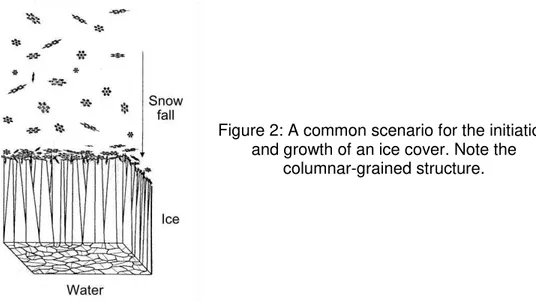
An ice cover commonly begins as a thin layer of snow that falls on a calm water surface (Figure 2). These crystals then grow downward into columnar-shape crystals, sometimes called
congelation ice. Winds, waves, currents, surface flooding and thermal expansion will complicate this scenario, leading to ice layering and a non-uniform ice surface and thickness.
Figure 2: A common scenario for the initiation and growth of an ice cover. Note the
columnar-grained structure.
The bottom surface of the ice, referred to as the ‘canopy’, is always at freezing point. The ice’s
upper surface is close to the air temperature and may undergo the same temperature
fluctuations as the air. A cold air temperature will promote fast ice growth. A snow cover on the ice surface will act as a thermal insulator, in which case the ice will not grow as fast. The nearby presence of a spring or other water input may reduce the ice thickness, even though there may be no sign of it at the ice surface. Thinner ice can also happen near a dam, above a shoal and wherever currents are expected to be strong in rivers and estuaries.
As the average daily air temperature increases at the end of the winter, the ice surface will start to soften, at which point it may become greyish in color. A snow layer on top of the ice cover at that time of the year will provide some protection against the increasingly intense solar
radiations, thereby reducing ice degradation.
At times, ‘wet cracks’ can occur – cracks that cross the full thickness of the ice cover, allowing the water to move upward along the crack and flood part of the ice surface. These scenarios and others have an effect on the ice type and internal layering.
2.2 Ice types
Frozen water comes in various forms and crystal structure, which may vary with the nature of the water body (e.g. lake, river, sea)(Michel and Ramseier, 1971).
2.2.1 Columnar ice
This ice type, shown in Figure 2, is one of the most common in floating ice covers. Each grain’s
crystal axis1 is in the horizontal plane, and the grains are columnar in shape as they extend
vertically downward.
2.2.2 Lake ice
Lake ice only forms on calm water surfaces (no wind, currents or snow) and can have very large grains, with vertically oriented crystal axes.
2.2.3 Frazil ice
Frazil ice is made from fine platelets or spicules that typically occur in dynamic water conditions, e.g. fast flowing rivers.
2.2.4 Agglomerate ice
Depending on the circumstances (weather, ice and water dynamics), an ice cover can comprise several layers. River dynamics may also be conducive to the formation of other ice types, such as frazil ice, which may also form distinct layers inside the ice cover.
2.3 Ice cover for transportation
Winter roads make abundant usage of floating ice surfaces. An ice cover is able to support a load because of the ice cover’s buoyancy and its resistance to flexure. Segments running on these surfaces take advantage of that material, which is naturally-available and leaves no environmental footprints upon melting in the spring. As mentioned earlier, however, a winter road is only as reliable as its weakest link, which segments on floating ice often are. These segments require a minimum thickness to be able to sustain the traffic they are meant to sustain, which requires time. Ice reinforcement to strengthen ice covers has been used historically and in a number of ways. This has been relatively well-documented – see Barrette (2018) for a recent summary.
1The ‘crystal axis’ refers to the crystallographic [0001] axis. This is a standard notation for the hexagonal crystal
3 Investigating the effectiveness of reinforced ice
How do we find out how effective reinforced ice is? As shown elsewhere (Barrette, 2015), this question has been addressed by a number of investigators. A first-order approach is via laboratory testing. The advantage of this approach is that it can be done in a fully controlled environment (e.g. temperature, ice type and uniformity, instrumentation). Also, such testing can make provision for a large number of experiments. Finally, ice breakthrough can be simulated without involving safety risks, as would be the case if these tests were done on a real ice sheet. This is why it is desirable to conduct laboratory testing prior to moving on to fieldimplementation. The latter’s advantage is, of course, that it is more representative of full scale
scenarios.
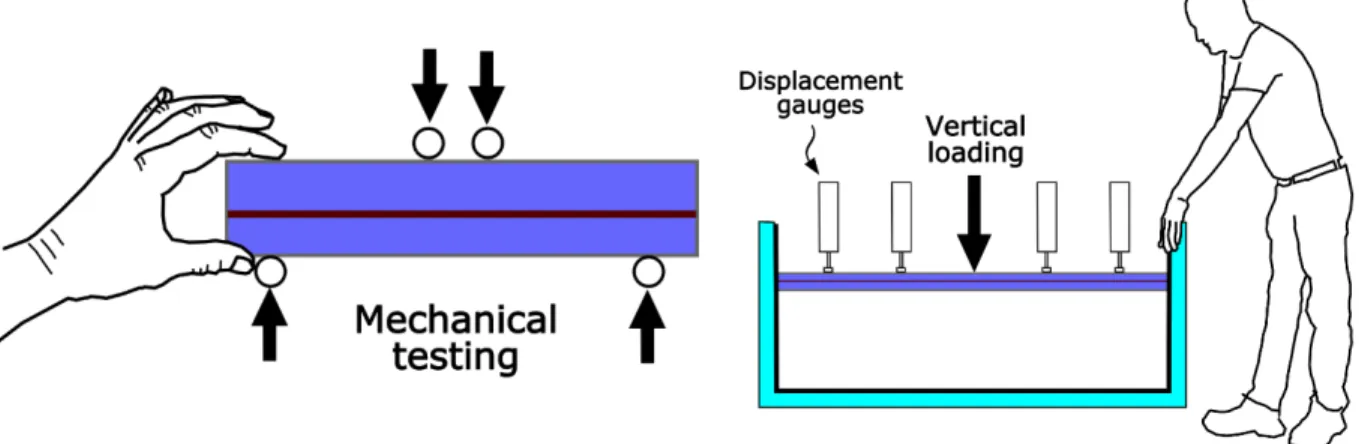
Two methods can be used to test ice in a laboratory: 1) beam bending test, and 2) vertical loading of an ice sheet (Figure 3). A preliminary series of tests was conducted with the first method, as will be described later in this report. The following sections will provide definitions and explanations of a few key concepts as they relate to this report.
Figure 3: Two methods to evaluate the effectiveness of reinforced ice in a laboratory:
Left) beam testing. Right) Vertical loading of an ice sheet – the basin may be several meters
in width, depending on the size of the environmental chamber where it is located.
3.1 Load and deformation
Most of the information conveyed in this report deals with two fundamental concept: load and deformation. The former refers to the weight a vehicle exerts on an ice cover; the latter refers to the amount of deflection the ice will have undergone under such loading and the internal
deformation induced by the loading event.
3.1.1 Mechanical energy
The initial source of energy is gravitational, induced by the weight of a vehicle, as well as the response of the underlying water. This energy translates into a force that is mostly vertical. The energy is absorbed by the ice and the enclosed reinforcement, in various ways. For instance, mechanisms such as the elastic response, the formation of free surfaces (cracks, fissures) and internal friction are typical energy sinks.
3.1.1.1 Load
A load is a force, which is typically measured in newtons (N) or kilonewtons (kN). Note that a kilogram is not a force, but a mass. Hence a person who weighs 60 kg will exert a
downward force of about 600 N onto the ice cover.2
3.1.1.2 Stress
Stress is a load divided by the area onto which it is applied. It is measured in N/m2,
corresponding to one Pascal (P), or in kN/m2, corresponding to a Kilopascal (kPa). An
ice cover can support a higher load if it is distributed over a wider area, i.e. lower stress.
The pressure exerted by a tire onto the ice surface is, essentially, the tire pressure3.
3.1.2 Material response
Material response is defined as how the ice reacts to a given loading event, i.e. how the gravitational energy is absorbed by the ice.
3.1.2.1 Deflection
Deflection is the (mostly) vertical displacement of the ice cover under a vertical load. It has a unit of length, millimeters or meters.
3.1.2.2 Strain
Strain is a deformation ratio, i.e. the amount of internal deformation divided by the original length of the material. Strain has no units, but may be expressed in percentage.
An ice cover typically undergoes very small amounts of strain – less than 1% – even
when it fails, i.e. when it fractures, leading to breakthrough.
3.2 Loading modes
3.2.1 Tension
Tensional loading on a material causes it to be pulled apart (Figure 1).
3.2.2 Compression
Compressive loading is the opposite of tensional loading (Figure 1).
3.2.3 Flexural loading
This is a composite loading mode. When a vertical load, such as the weight of a vehicle, is exerted onto an ice cover, the bottom of the ice is subjected to a tensional load while the top of the ice is subjected to a compressive load (Figure 1).
3.2.4 Load application
3.2.4.1 Static - Short duration2 From Newton’s second law, where force is a product of mass by gravitational acceleration (g), which is about
10 m/s2.
3 Winter tires at normal pressures (35 psi for automobiles) are typically used to drive on floating ice covers, even if
This is a simplified scenario used to evaluate the bearing capacity of an ice cover. If the ice cover is deemed unable to withstand the weight of a given vehicle (for example, a two-ton truck) within a few seconds, then the ice is inappropriate for that load, but may be adequate for a normal passenger vehicle, which is lighter. As described later, this loading type assumes that only elastic deformation is taking place.
3.2.4.2 Dynamic loading
Dynamic loading most often refers to scenarios involving a vehicle as it travels over an ice cover. Ice response is also assumed to be elastic and depends on a number of parameters, e.g. ice thickness, vehicle weight and speed, water depth. Deflection occurs
below the vehicle, with the formation of a ‘bowl’ below it. It can also take the form of
‘waves’ in the ice ahead of the traveling vehicle. 3.2.4.3 Static - Long duration
An ice cover can be strong enough to sustain a load for a few seconds or minutes, but not necessarily for one hour or more. Long duration static loading of an ice cover is an important consideration for scenarios involving, for instance, ice fishing or any other usage where a vehicle is parked on the ice, or a large number of people stand on it (for instance, to watch an on-ice event). Ice pull-outs, areas where vehicles are allowed to park, are another example of scenarios inducing long duration loading.
3.3 Response to loading
3.3.1 Elastic deformation
This is the simplest type of deformation, and can be best understood by visualizing a spring that is loaded in tension: it instantly stretches to a given length. As soon as the load is removed, it instantly recovers. Downward deflection and internal strain of an ice cover can be elastic but only when the load is applied and removed relatively quickly, i.e. in a matter of a few seconds. 3.3.1.1 Modulus of elasticity
Referring back to the above-mentioned spring analogy, this is the ratio of the load required to extend the spring to a given length. The stiffer the spring, the more force will be required. Ice has a modulus of elasticity, as do all solids (metal, plastic, wood, …) – it can be determined by measuring the load (or stress) and the amount of deformation or strain resulting from that load. The modulus is an important consideration in the choice of a reinforcement material.
3.3.1.2 Stiffness
Stiffness is a term that is loosely designating resistance to elastic deformation.
3.3.2 Creep deformation
Unlike for the elastic response, creep only occurs if loading remains on the ice for more than a few seconds. Also, creep is not recoverable. The longer the load duration, the higher the
amount of deflection4. The mechanisms responsible with creep take place at the molecular
4 Creep deformation is what allows glaciers to move down a slope and ice caps to spread outward under their own
scale, and is related with the motion of crystal defects. It will not be dealt with in this report because its contribution to the deformation of an ice cover in the context of transportation is negligible.
3.3.3 Delayed elastic deformation
Delayed elasticity is similar to the elastic response, in that it is instantaneous, i.e. deflection begins as soon as the ice is loaded. It is also recoverable when the load is removed. However,
unlike the elastic response, its recovery is not instantaneous – it takes time. N. Sinha, another
former ice expert at NRC, demonstrated that delayed elasticity is closely related with the formation of cracks (e.g. Sinha, 1982, 1988).
3.3.4 Cracks, fractures, fissures
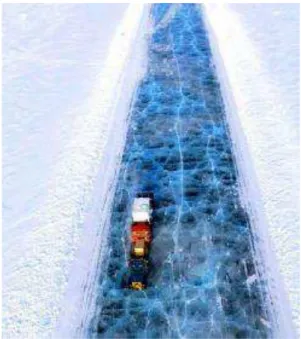
These terms, which may be considered synonymous, refer to the formation of one or more ‘free surfaces’ within the ice, i.e. surfaces that did not exist beforehand (Figure 4). They are a normal occurrence inside natural ice covers due to expansion and contraction caused by changes in air temperature. They can also be produced or promoted during loading of an ice cover, e.g. from
the weight of a vehicle.5
Figure 4: Cracking pattern on an ice road.6
3.3.4.1 Fracture toughness
Fracture toughness is the ability for an existing crack to propagate further into the material.
5 The influence of naturally-occurring cracks in a floating ice cover is not known, as this topic has so far attracted
very little attention from the ice engineering community.
6 From a Transport Canada Webinar, entitled Information and Tools to Support Transportation Adaptation, by
3.3.5 Ice failure
An ice cover fails in flexure when it is mechanically unable to sustain a load. The outcome of this process is a first crack along the bottom of the ice, below the point of load application, followed by crack multiplication.
3.3.6 Breakthrough
Breakthrough may succeed to failure. It specifically designates a load that has clearly gone through the ice, often from the development of radial and circumferential crack networks.
3.4 Strength
Strength may be envisaged as a resistance to failure. It is a stress.
3.4.1 Flexural strength
This is the amount of stress ice can sustain in flexure without failing.
3.4.2 Ultimate yield strength (or yield strength)
For the purpose of this report, this concept refers to the amount of stress ice can sustain without a breakthrough.
3.5 Resilience
For the purpose of this report, resilience is a measure of how resistant ice is to ultimate yield strength. This parameter is, a priori, qualitative and, as such, does not have a unit. A means of quantifying it will be discussed later in this report.
3.6 Reinforcement material
This refers to the material that was incorporated into the ice and meant to help the ice resist cracking. In this project, we investigated two possibilities: 1) one-dimensional (e.g. strips of material, cables, rods) or two-dimensional (geomembrane, geogrid, geotextiles).
4 Ice reinforcement
4.1 Origins and development of ice reinforcement
Humans have relied on ice as a structural material, presumably since the first crossings of frozen bodies of water. Moreover, the notion of incorporating material into an ice cover to increase its strength is not novel. In fact, structurally reinforced ice has been used in
applications beyond transportation. For example, the Inuit have used lichen to strengthen their
traditional dwelling – the igloo (Nixon, 1989), made from snow. Over time, traditional uses of
reinforced ice have been supplanted largely by an increasing trend of transportation
infrastructure development and industrialization in northern regions. One approach to increasing the capacity and longevity of over-ice crossings is to engineer desirable characteristics into an ice cover by creating a reinforced ice composite.
Reinforced ice and its engineering applications have been reported on since the early 1940’s,
beginning with the unlikely proposal to construct a floating anti-submarine base out of ice and
wood pulp – the Habbakuk project (Gold, 2004). Since then, a variety of reinforcing materials
have been incorporated in ice to improve its resilience. These reinforced ice composites have been tested in laboratory and field studies to determine their engineering characteristics. Other
researchers have recently reported that “[d]uring World War II in the USSR, different ways of ice
reinforcement using logs, branches and twigs were used to permit motor traffic on the ice of Ladoga lake on the “Life Road” during the siege of Leningrad […]” (Vasiliev et al., 2014, Vasiliev et al., 2015). It is also recorded that the reinforcement of river ice ferries with reinforced ice was also used for heavy military transport in other areas of the Front. The U.S. Army has
constructed an ice bridge in Korea, reinforced with rice straw, which was capable of supporting an M-41 tank (Ohstrom and DenHartog, 1976). The National Research Council Canada (NRC) has a history of reinforced ice engineering dating back to the Habbakuk project.
The following sections describe modern techniques and considerations for reinforcing an ice cover.
4.2 Overview of modern ice reinforcement techniques
Ice cover reinforcement can be categorized into two types of techniques: macroscopic and microscopic (Vasiliev et al. , 2014).7 The former is mostly used for roads while the latter is
applied for all types of engineered structures. Both techniques could conceivably be used on the same ice cover. Both have been shown to act as inhibitors to crack initiation and propagation.
4.2.1 Macroscopic ice reinforcement
Macroscopic reinforcement is done by laying a structural material – e.g. logs, steel beams or
cables, a net, a geogrid – onto the ice cover at strategic locations and flooding it, so that it gets
incorporated into the ice cover. This can be combined with traditional ice thickening methods (Vasiliev et al. , 2014, Vasiliev et al. , 2015). Advantages include low cost, light weight and ease of deployment. A prospective drawback is weak bonding.
7 By analogy, this is like using re-bars and microfibers, respectively, to reinforce concrete, which is also a brittle
An example is shown in Figure 5. Following are a few investigations on that topic.
Gold (1971) gives three examples of ice bridge reinforcement with logs (two cases) and steel cables (one case).
Michel et al. (1974) describes ice bridges constructed with wooden logs set in built-up layered ice near the bottom surface, where the ice cover was in tension under load. The premise was that, if the ice failed, the logs would take up the load. This allowed the required design ice thickness to be reduced by 25-35%.
Grabe (1986) addressed creep of reinforced ice, as observed during four-point beam bending experiments. Fibreglass rods were incorporated into seams that were machined at the top and bottom of the beams. These were then submitted to a constant load. Fransson and Elfgren (1986) did creep tests on ice reinforced with sand, birch branches
and sawn timber.
Glockner (1988) looked at ice specimens incorporating fiberglass yarn, and deformed in shear mode (no difference was observed with or without reinforcement), in tension to test bond strength, and in tension to test for failure strength and creep behavior.
Figure 5: An example of an ice road locally reinforced with logs or branches (Ohstrom and DenHartog, 1976).
Ohstrom and DenHartog (1976) investigated ice reinforcement in cantilever beams with three different materials: tree branches, aircraft cables and wood dowels. Significant
improvement – up to a five-fold increase – in bearing capacity was observed.
Reinforcement also caused the ice to withstand the load even after beam failure. The branches afforded better bonding than the wood and the cables, for which slipping ‘along the reinforcement’ is reported.
Jarrett and Biggar (1980) tested four fabrics frozen near the base of ice specimens, where the ice was in tension during flexural tests. Reinforcement increased beam strength up to 31%. It was also reported that the higher the initial elastic modulus, the higher the strength. Cederwall (1981) incorporated two steel bars 8 mm in diameter near the base of 300 x 160 mm ice beams, which were tested in flexure under a constant load. Failure stresses were 320 to 400 MPa, as measured by strain gauges attached to the steel bars (i.e. sustained by the reinforcement).
Haynes and Martinson (1989), Haynes et al. (1992) reported on the use of a polymeric
mesh (‘Geogrid’), which increased the ice bearing capacity in the laboratory by up to
300%. With this material embedded in the ice cover, failure was much more localized with reinforced ice; it also reduced ice deflection. Testing was done in the laboratory and in the field. Problems encountered during field deployment included: 1) unrolling the full length of the mesh below the ice was made difficult because it undulated and did not lay flat on
the underside of the ice, and 2) the mesh was not frozen into the ice – just floating against
it (the ice had not grown into it).
4.2.2 Microscopic ice reinforcement
For microscopic reinforcement, the ice itself can be produced by mixing water with another material (e.g. wood pulp, fiberglass) before freezing. Specimens produced from these mixtures are usually tested in the laboratory to assess their strength. Following are examples.
Perutz (1948) and Gold (1993) reported on an attempt by the allies during WWII to build an aircraft carrier made from a mixture of ice and wood pulp, a cheap and plentiful material whose resistance would unable the ship to withstand the enemy’s torpedoes. That is the Habbakuk project mentioned earlier. Because of various technical difficulties, the project was eventually abandoned. That was an early example of how the mechanical resistance of ice could be increased by incorporating a different material into it.
Coble and Kingery (1963) investigated a number of options (fiberglass yarn, fiberglass insulating mat, wood fiber, asbestos fiber, newspaper mash, bond paper mash, bond paper strips, starch). A linear increase in strength with the fiber content is documented for all materials.
Nixon and Smith (1987) and Kuehn and Nixon (1988) addressed fracture toughness and tested ice specimens containing softwood sawdust, shredded bark and shredded newspaper. They report a reduction of required thickness by over one third compared to what would be needed without reinforcement). They also observed an increase in fracture toughness, the later being more noticeable for the fibers with the smallest diameter. Fibre pull-out and fibre debonding are thought to be responsible for that phenomenon.
Nixon (1989) resorted to alluvium, locally available and abundant, to strengthen ice. Nixon and Weber (1991) also looked at alluvium to reinforce the ice. They chose sand
with a 80% weight content, and tested at different temperatures. They report an increase in flexural strength with decreasing temperature.
4.2.3 Requirements
The design of a reinforced ice cover requires a number of considerations, both technical and practical. Several considerations are described in the literature, including:
Material availability – the economic aspects of which are discussed by several authors (Coble and Kingery, 1963, Kuehn and Nixon, 1988, Vasiliev et al. , 2014)
Extra time needed for construction (Michel et al. , 1974, Ohstrom and DenHartog, 1976) A darker material embedded in the ice absorbs solar radiation and can contribute to ice
deterioration (Ohstrom and DenHartog, 1976, Haynes et al. , 1992)
Depending on the reinforcing material, it may have to be recovered for environmental reasons, which may prove difficult (Jarrett and Biggar, 1980)
Material deployment in the field depends on its nature – it may be difficult to position and freeze in the ice cover (Haynes et al. , 1992).
These and other considerations are described in the following sections.
4.3 Design Considerations
4.3.1 Loading mode
The design of the reinforced ice cover, or reinforced area (shoreline or parking zone), should consider whether the primary loading mode will be static or dynamic and should also consider estimated durations of loading. Other considerations would be the timing and physical spacing between loading events (e.g. vehicle passes), i.e. the recovery time of the ice cover between loading events. In dynamic situations, the abrupt accelerations and decelerations of vehicles may also be a consideration (e.g. in emergency situations and accidents, approaching the shoreline, etc.), as these events could magnify loading of the ice cover and reinforcing material(s).
4.3.2 Reinforcement characteristics
4.3.2.1 Ice affinityIn order to assess the effectiveness of a reinforcing strategy, another crucial characteristic of the material to consider relates to how well ice grows around or through the reinforcing material. It is important that the reinforcement allows for the ice sheet to grow in a manner so to attain its greatest strength. Researchers have documented this as a problem for some materials (Haynes et al. , 1992).
The reinforcing material should be capable of forming some level of bonding with the growing ice. The material should not impede the growth of naturally seeded crystals, such that the orientation and size of ice crystals provides at least the same resistance to failure as the natural cover and such that preferential shear planes or weakly-bonded zones are not formed within the reinforced ice cover. Reinforcing elements with poor affinity for the growing ice may have low pull-out resistance, which could lead to a catastrophic failure when the bond between the ice and reinforcement is broken.
4.3.2.2 Tensile strength
When reinforcing materials are positioned at or near the bottom of the ice cover (in the region under tension), they should act to increase the composite tensile strength and resist fracture. Typical tensile strengths for ice range from 0.7 to 3.1 MPa (Petrovic, 2003) while the tensile strength for wood products ranges from 45 to 120 MPa (Green et al., 1999), and structural steels range from 400 to 550 MPa (e.g. ASTM A36 mild steel). In comparison, a high-density polyethylene (HDPE) geogrid may achieve a tensile strength in the order of 5 to 50 MPa.
Should the ice and reinforcing material be sufficiently bonded and strain in the reinforcement is low, some tensile stress in the ice cover should be transferred to the reinforcing material. Reinforcement with relatively high tensile strength may also reduce the ease with which fractures can propagate throughout the ice cover (i.e. increase fracture toughness). 4.3.2.3 Elongation to maximum tensile strength
Many materials experience some ductile deformation upon loading and their full strength is not mobilized until just before the material fails. Plastics and related polymeric products develop some strength as the material is stretched and deformed. Manufacturers may report strength values at specific strains (e.g. 2%, 5%) and the reported ultimate strength may be significantly higher. If necessary, the reinforcement could conceivably be pre-stressed (strained) in order to reduce the amount of in-situ strain and to develop its maximum strength at the time of
installation8.
4.3.2.4 Flexural stiffness
The stiffness of the reinforcing material may serve to increase the overall flexural stiffness of the ice cover and act to decrease deflection of the ice cover under loading. This could prevent loss of freeboard and further failure of the ice cover. In a polymeric material like geogrid, the stiffness is derived from the thickness of the ‘ribs’ (linear elements) and the density of the network. For thin geogrids with large apertures (openings between linear elements making up the material), the flexural stiffness will generally be lower than that of a similar polymeric product with thick ribs and small apertures.
4.3.2.5 Absorption and thermal conductivity
Absorption of incoming solar radiation could cause premature deterioration of the ice cover and reinforcing elements with high absorptivity may accelerate this process. This effect could be significantly pronounced for thin ice covers and during the freeze-up and thaw periods. Thermal conductivity of the reinforced ice can be manipulated to some extent by modifying its
constituents (Vasiliev et al. , 2014). Furthermore, thermal incompatibility (i.e. largest conductivity contrasts between materials) may affect the ultimate quality or uniformity of the ice cover. Some consideration may be given to incorporating light coloured or reflective reinforcing materials. 4.3.2.6 Pull-out resistance and fracture toughness
In the case of fibres or linear reinforcing elements (bars, cables, etc.), pull-out resistance may be an important consideration. Fibre pull-out and fibre debonding are thought to be responsible for decreasing fracture toughness, and larger diameter elements inside the material were more susceptible to this phenomenon according to Kuehn and Nixon (1988). This also relates to the concept of ice affinity described previously.
4.3.2.7 Ultraviolet (UV) resistance
Specifically for reinforcing materials that will be used year after year, deterioration by ultraviolet (UV) spectrum light may be a consideration. Modern polymeric compounds designed for outdoor use will have additives to reduce or eliminate the impact of UV degradation. Natural materials (e.g. wood, fibres, and alluvium) should experience little UV degradation.
4.3.3 Environmental Compatibility
The reinforcing material may have to meet environmental criteria, including, but not limited, to those previously mentioned:
Direct or indirect damage to the environment through its constituents or degradation by-products (e.g. no potential for generation of micro-plastics)
Maintenance of integrity in the presence of water
Suitability for deployment and use in low temperatures (around 0°C in the ice cover and potentially much lower during deployment)
Capability to withstand the processes of ice growth and thermal expansion and contraction of the ice cover
Resistance to UV degradation
Ecological compatibility (e.g. no interference with fish habitat and other wildlife activity) Other environmental considerations may also be relevant depending on the seasonal
deployment and retrieval schedules including, for example, resistance to spring break-up (if the material is to be left in place during that period).
Earlier works have suggested that natural reinforcing materials, e.g. alluvium (sediments from the river bed), could resettle back into its environment and hence have minimal environmental impact (Nixon, 1989). However, this should be re-evaluated in the context of modern regulation and best practice. Others have suggested recently that natural fibers are a better reinforcing material due to environmental considerations (Vasiliev et al. , 2014) and suggest that more exotic water soluble and non-toxic synthetic polymers (e.g. xanthan gum or polyvinyl alcohol) may be used in conjunction with other materials to reinforce ice.
4.4 Construction considerations
4.4.1 Availability
In a general context, ‘availability’ of a reinforcement material may be used in two senses. Firstly, in the case of a material provided by nature, it refers to how close it is to the target on-ice
segments, bearing in mind flying in that material could otherwise be costly and time-consuming. Secondly, when applied to a manufactured material, ‘availability’ may allude to how easily obtained it can be from a manufacturer, its on-going production and existence on the market. Access to materials in remote regions serviced by winter roads may be a challenge. Even in regions south of the tree line, access to timbers or other natural material and means of transporting that material to the work site may be uneconomical. Transportation of materials from populated centers by air or water may be required.
4.4.2 Constructability
Another important consideration is the constructability of the reinforced ice cover. In remote areas with limited access to begin with, there are limitations on available equipment and
personnel for delivering, deploying and incorporating materials in the ice cover. Winter roads are not always accessible in the summer and so delivery of equipment and materials may have to be supported by air, or by water during the ice-free season. The initial set-up can be a
deployment. Furthermore, deployment strategies must consider the limited bearing capacity of thin ice covers such that deployment equipment must be of low weight and ground pressure. This means careful planning is required when accessing these ice covers for deployment purposes. Working in strong currents (e.g. on rivers) could also pose a challenge for
deployment of reinforcement during freeze-up and for recovery in the spring. Worker safety and environmental disturbance around shorelines and river or lake beds must also be considered. Ice formation dynamics should also be considered when determining the best deployment and recovery strategy. The bottom of the ice cover may not be flat – this could cause challenges if deploying material after the ice has formed in place. Ice dynamics could further damage a reinforcing material.
Furthermore, the nature of the material may mean that it cannot be uniformly distributed throughout the ice cover (e.g. wood pulp) or placed at a targeted elevation within the ice profile (e.g. geogrid). Earlier attempts at reinforcement with polymeric geogrids have highlighted the issue of a ‘wobbly grid’ not lying flat against the canopy or within the ice (Haynes et al. , 1992). Finally, an important consideration for general constructability of the ice cover is the availability of and training requirements for a labour force and equipment to deploy, monitor and retrieve the reinforcement as necessary.
4.4.3 Reliability
Many materials proposed for ice reinforcement have not been rigorously and independently evaluated as the community of researchers and engineers investigating this topic is limited. The reliability of some methods may not yet be well established, while for others (e.g. wood pulp), there is a reasonable level of confidence in the ice composite performance in limited
applications evaluated in laboratory and field conditions.
4.4.4 Recoverability
Recoverability describes ease with which the reinforcing material can be collected at the end of the season. Recovery of the material may be required for environmental or economic reasons, or to ensure that the waterway remains navigable during the open water season.
4.4.5 Reusability
The reusability of the materials (from one year to the next) may also be an important
consideration from logistic and economic perspectives. Transportation of materials to and from the site may be costly or impractical. Therefore, leaving the material near the deployment site to be reused the following winter would be advantageous. During the spring break-up of the ice cover, the reinforcing materials could be damaged; this could reduce the likelihood of reusing the material for multiple winters. Furthermore, over multiple years of use, the material
characteristics could change (for instance due to time-dependent creep). For materials like polymeric geogrids, creep reduction factors may be provided by manufacturers.
4.5 Stakeholder considerations
4.5.1 Stakeholder acceptability
Consideration must be given to the overall acceptability of the reinforcement strategy including the material(s) used, the deployment strategy, reliability, recoverability and environmental considerations. Availability of materials and cost must also be considered for remote northern regions. Stakeholder acceptability is not as tangible as the other criteria, in a sense that if reinforcement is perceived as objectionable by the local communities, there will be resistance to its implementation. A healthy relationship and good communication with the communities at the outset is desirable.
4.5.2 Regulations
Federal, provincial/territorial and local regulations may govern the construction and operation of a reinforced ice crossing. Depending on the type of reinforcement used, impact on the
ecosystem, navigable waterways, shorelines, or vegetation may need to be assessed and mitigated.
In addition to legislated requirements, indigenous communities may also have specific
requirements for the monitoring and performance of reinforced ice crossings. Consultation with these communities is important.
4.5.3 Value for money (relative cost)
A quantitative assessment of the relative cost of reinforcement solutions may be required (for instance, on a per square meter per day basis). Because ice road reinforcement has so far never been systematically implemented, this factor has yet to be explored. It could conceivably take into account:
The longevity of the reinforced ice cover, e.g. how long it is passable each season How many winters the reinforcing material can be deployed (reused).
The value per tonne of goods transported, since stronger reinforcement can support more traffic and bring more value to communities.
4.6 Assessment of modern ice reinforcement techniques
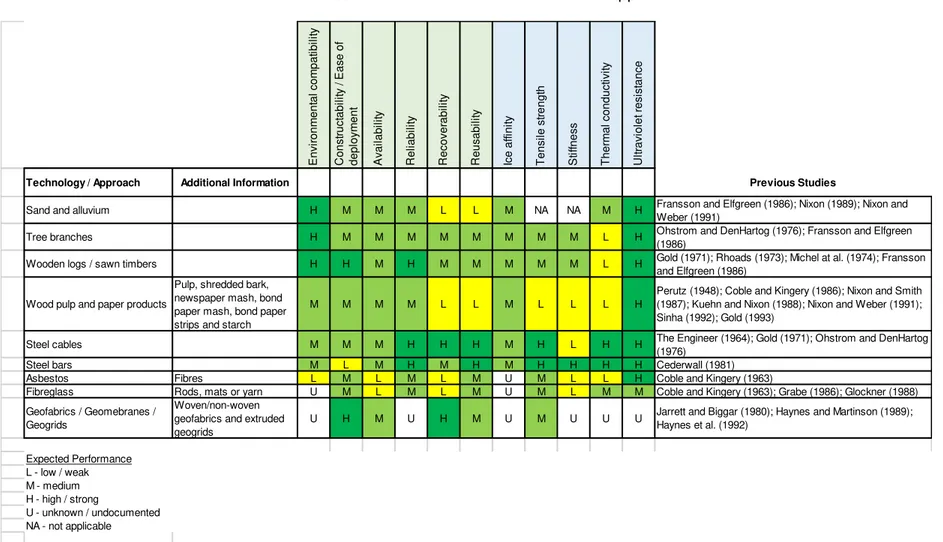
Table 1 provides a relative assessment of the more common macroscopic and microscopic reinforcement techniques in the context of a few key technical and practical considerations (as described in the preceding sections). The assessment is based on a literature review and judgement of the authors. Each technique has its advantages and disadvantages. The preferred solution may be site-specific and will likely be influenced by technical considerations as well as regulations and stakeholder requirements.
Geogrids are deemed the most promising material, on account of their properties but also because they are constantly evolving. Indeed, the performance of the most recent material available on the market has yet to be investigated. As such, it is worth exploring what options currently exist. Moreover, one of the key factor in selecting a reinforcement material is
Table 1: Assessment of common ice reinforcement approaches. E n vi ro n m e n ta l co m p a ti b il it y C o n st ru ct a b il it y / E a se o f d e p lo ym e n t A va il a b il it y R e li a b il it y R e co ve ra b il it y R e u sa b il it y Ice a ff in it y T e n si le st re n g th S ti ff n e ss T h e rm a l co n d u ct ivi ty U lt ra vi o le t re si st a n ce
Technology / Approach Additional Information Previous Studies
Sand and alluvium H M M M L L M NA NA M H Fransson and Elfgreen (1986); Nixon (1989); Nixon and Weber (1991)
Tree branches H M M M M M M M M L H Ohstrom and DenHartog (1976); Fransson and Elfgreen (1986)
Wooden logs / sawn timbers H H M H M M M M M L H Gold (1971); Rhoads (1973); Michel at al. (1974); Fransson and Elfgreen (1986)
Wood pulp and paper products
Pulp, shredded bark, newspaper mash, bond paper mash, bond paper strips and starch
M M M M L L M L L L H
Perutz (1948); Coble and Kingery (1986); Nixon and Smith (1987); Kuehn and Nixon (1988); Nixon and Weber (1991); Sinha (1992); Gold (1993)
Steel cables M M M H H H M H L H H The Engineer (1964); Gold (1971); Ohstrom and DenHartog (1976)
Steel bars M L M H M H M H H H H Cederwall (1981) Asbestos Fibres L M L M L M U M L L H Coble and Kingery (1963)
Fibreglass Rods, mats or yarn U M L M L M U M L M M Coble and Kingery (1963); Grabe (1986); Glockner (1988) Geofabrics / Geomebranes /
Geogrids
Woven/non-woven geofabrics and extruded geogrids
U H M U H M U M U U U Jarrett and Biggar (1980); Haynes and Martinson (1989); Haynes et al. (1992) Expected Performance L - low / weak M - medium H - high / strong U - unknown / undocumented NA - not applicable
4.6.1 Geogrid reinforcement materials
Polymeric geogrids offer some desirable characteristics, including good tensile strength and recoverability. The material is also commonly used in road applications, where it supports vehicle traffic on soft soil subgrades. Here we provide some more information on common polymeric geogrid products that are commercially available. All are two-dimensional sheet-like materials that are rolled for storage and transportation purposes. They are divided into three categories, depending on the direction(s), along the material surface, strength can be mobilized:
Uniaxial: Material designed to resist tension in one direction
Biaxial: Material designed to withstand tension in two orthogonal directions Triaxial: material designed to withstand tension in any direction
The products referenced are available from one of the foremost manufacturers, Tensar
International9. Nilex10 is one such product line. Local distributors are likely to carry these
products. However, distribution centers are located mainly in highly-populated regions. Other
manufacturers with competing and comparable products include Maccaferri11 and ADFORS12.
4.6.1.1 Uniaxial (UX) geogrid – High Density Polyethylene (HDPE)
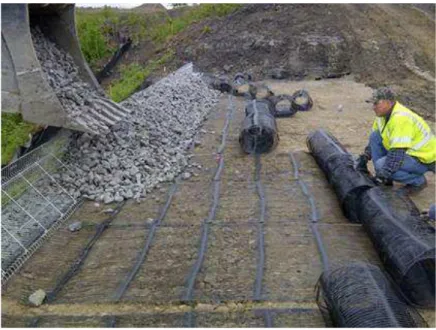
Uniaxial geogrids are the least expensive polymeric geogrid product but still offer good strength characteristics. An example of its deployment is shown in Figure 6; material specifications are shown in Table 2.
Benefits include:
• Cost savings
• Weight savings
• Uniaxial design may be ‘good enough’ for linear traffic patterns
• High tensile strength
• High flexural stiffness
• Excellent UV resistance
Disadvantages include:
• Uniaxial strength along length of roll / strength dependent on installed orientation /
subject to installation error or movement/rotation within ice sheet
• Subject to damage during installation
• Lower availability, not produced in high quantities (compared to other products)
• Highest strengths develop after 5% strain
• Lower surface area for ice bonding/adhesion
9 https://www.tensarcorp.com/ 10 http://nilex.com/road-optimization 11 https://www.maccaferri.com/ca/ 12 http://www.adfors.com/
Offshore, Coastal and River Engineering (OCRE)
4.6.1.2 Biaxial (BX) geogrid - Polypropylene
An example of one such material is shown in Figure 7, and the corresponding specifications are shown in Table 3.
Benefits include:
• • Good availability, common product
• • Bilateral tensile strength
• • Good adhesion potential, increased surface area
Disadvantages include:
• Lower UV resistance compared to HDPE
• Lower tensile strength compared to uniaxial
• Lower flexural stiffness (compared to uniaxial)
• Highest strengths develop after 5% strain
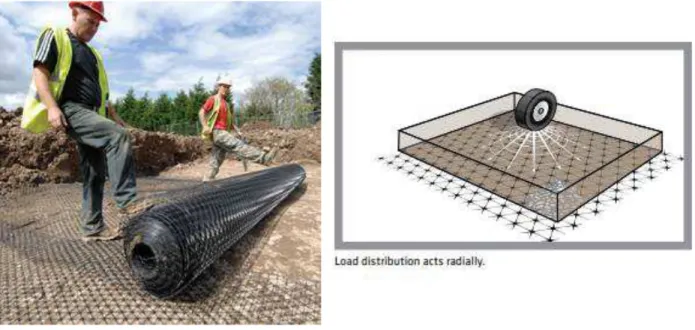
Figure 6: Deployment of a geogrid13 - this one is of the ‘uniaxial’ type.
Figure 7: Deployment of a ‘biaxial’ geogrid14.
Table 2: Example of specifications for a uniaxial material15.
Table 3: Example of specifications for a biaxial material16.
4.6.1.3 TriAx (TX) geogrid - Polypropylene
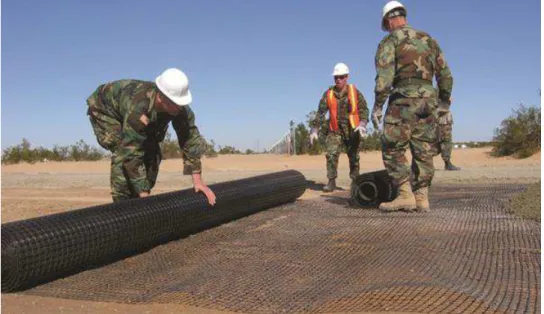
An example of a triaxial material is shown in Figure 8.
Figure 8: Left) Field deployment of a ‘triaxial’ geogrid17. Right) Schematics showing the load
distribution exerted by a tire onto the supporting medium and the relevance of a triaxial material to compensate for strains in all directions.
Benefits include:
• Radially distributed loading
• Higher load capacity due to orientation of 'ribs' and increased rib depth compared to
biaxial or uniaxial
• Relatively common product, although not as wide used as biaxial due to legacy of
biaxial use
• High stiffness
Disadvantages include:
• Lower UV resistance compared to HDPE
• Cost (2 to 3 times cost of biaxial)
4.6.1.4 GlasGrid – polymer-coated fibre glass
For comparison purposes, it is worth mentioning yet another type of geogrid, made from
polymer-coated fibre glass18 (Figure 9).
Figure 9: Close-up of a polymer-coated fibre glass19.
Benefits for that material include:
• High tensile strength
• High modulus of elasticity
Disadvantages include:
• Two materials (fibre glass + polymeric coating) • Cost (more difficult to manufacture)
4.6.2 Candidate materials
The aim of the foregoing was to provide the readership with an understanding of what is available at this time in terms of reinforcement material. A focus was placed on geogrids, a promising material but whose properties and performance has yet to be explored. Amongst the examples that were provided are those that have been retained to investigate further. These are (Figure 10):
18https://www.tensarcorp.com/Systems-and-Products/GlasGrid-Asphalt-Reinforcement-System
Figure 10: Material selected for testing: Upper left) Tensar’s Biaxial Type 1 Geogrid. Upper right) One of Tensar’s Triax geogrid. Lower left) Strata’s SG 150. Lower right) A roll of
Tensars’ biaxial material.
• The type 1 Biaxial Geogrid, from Tensar.
• One of the TriAx geogrids, also from Tensar.
• The Stratagrid SG 150, by Strata Systems20
In addition, 6-mm threaded rods will also be tested, which should prove insightful because of the significant contrast between that type of reinforcement and the geogrids.
5 Laboratory investigations
The purpose of this section is to describe a series of beam tests that were done in the
laboratory in order to obtain preliminary information, qualitative and quantitative, on the behavior of reinforced ice. Note that testing on ice beams without reinforcement was also done, to
establish a basis for comparison.
Proper experimental procedures play an essential role in the success of any laboratory endeavor. These procedures typically require a significant investment in resources at the beginning of the program, involving a fair amount of trial-and-error in fine tuning. These will also be described.
5.1 Reinforcement material
At the beginning of the project, NRC initiated its search for a suitable material (Section 4). While this was being looked into, two beam test series were conducted (i.e. in parallel with the search for a suitable material). Testing was done using a proxy material. This is referred to as the preliminary phase, whose purpose was to work out the procedures in preparation for a later, more formal test series using the selected reinforcement materials. The outcome of the formal beam tests will be included in a report next fiscal year. The proxy material consisted of heavy duty plastic cable ties (i.e. also known as tie wraps) about 600 mm in length and 9 mm wide and
2 mm in thickness (Figure 11)21. Either two or three cable ties were incorporated into the ice
beams.
5.2 Ice beam production
Ice was grown in a basin 1600 mm in length, 600 mm in width and 520 mm in depth (Figure 12) inside an environmental chamber. Prior to putting water in the basin, the reinforcement material
was installed at a desired vertical level across the basin – the procedure is shown in Figure 12.
Water was then added into the basin and brought down to freezing temperature. Its surface was
then ‘seeded’, so as to simulate ice growth in nature (Figure 2). This resulted in a thin layer of
slush at the water surface. That ice was allowed to grown downward – within up to two days, a
thickness of 80-90 mm was achieved. The growth basin was fitted with a pressure relief pipe,
which allowed the water to be pushed out of the basin as the ice grew22.
At that point, the ice was extracted from the basin with an electric chain saw in the form of roughly cut blocks (Figure 13, Figure 14, upper left). About half of these blocks enclosed
reinforcement material; the other half did not. All were stored in another environmental chamber
at -20oC awaiting final machining and testing.
On the day of testing, the rough blocks were precision-machined with a milling machine into the final target beam dimensions (Figure 14).
21 Product #052-1521-0, sourced at Canadian Tire, UL Product category E359184. 22 When water freezes, it gains volume.
5.3 Testing
5.3.1 Temperature
All tests were done at a room temperature of -5C +/- 1oC, after the ice specimens had
equilibrated to that temperature. Because the ice was stored in a cold room set at a very low temperature (before machining it into final beam dimensions), we needed a way to keep track of the beams’ testing temperature. A methodology was thus devised to ensure the ice specimens had achieved the target test temperature. This was done by incorporating a temperature probe (thermistor) inside a dummy ice specimen (Figure 14, upper right) that accompanied the ice to be tested between cold rooms. The temperature read-out from the dummy specimen was taken to be the same as that of the ice beams.
Figure 11: Cable ties used in the preliminary phase of the beam bending test program. In the right-hand picture, one may note the corrugations on that side of the cable, as is the case of
Figure 12: Upper left) Growth basin. Upper right) Steps followed for beam production.
Below) The cables’ set-up before (left) and after (right) ice growth around them. Glove for
scale.
Figure 14: Upper left) Beams with rough cuts. Upper right) Beam after machining the sides (scale divided into 50 mm partitions) – the elliptic outline in that photo shows a piece of ice enclosing a temperature probe, for ice beam temperature monitoring. Below) Four-point beam
Figure 15: Upper) Four-point rig system (made from aluminum). Below left) Points of load application in the four-point beam testing rig, with construction details. Below right)
Difference in loading regime and how it affects beam failure.
5.3.2 Testing configuration
The four point beam testing rig, shown schematically in Figure 15, was the same as that used
by Barrette and Jordaan (2001, Section 4.2). The load at these points is delivered through a
cylindrical rod made of aluminium, with a steel core running along its axis. The aluminium and the steel components may be allowed to slip at their interface. The purpose of this arrangement is to minimise the friction the loading points are exerting on the ice. This interferes with the deformation of the beam, which requires a very small amount of
horizontal displacement upon bending. Failure to account for this effect may lead to fracture patterns that are affected to some extent by the loading regime (Figure 15, right). The ice rests on fine sand paper and set screws are used to fix the inner and outer rod at one point on the upper and lower surface of the ice beam.
5.3.3 Monitoring load and displacement
Displacement and load were measured with a linear potentiometer23 and a load cell24,
respectively (Figure 16), at an acquisition rate of 500 Hz, i.e. 500 readings per second, or 0.002 seconds between readings.
5.3.4 Beam testing
Each specimen was installed in a Chatillon-type test frame and loaded with the four point beam bending rig described above (Figure 16). The original top surface of the ice was always on the upper (compressive) side of the specimen. A total of 11 and 9 specimens without and with reinforcement, respectively, were tested (Table 4 and Table 5).
Figure 16 Below left) An ice beam in the test frame. Below right) A reinforced ice beam after the test, showing the failure surface (‘cleavage’) – see text for discussion.
23 TE Connectivity model number DV301-0050-111-1110 24 Honeywell model number 3397