HAL Id: halshs-00556933
https://halshs.archives-ouvertes.fr/halshs-00556933
Preprint submitted on 18 Jan 2011
HAL is a multi-disciplinary open access archive for the deposit and dissemination of sci-entific research documents, whether they are pub-lished or not. The documents may come from teaching and research institutions in France or abroad, or from public or private research centers.
L’archive ouverte pluridisciplinaire HAL, est destinée au dépôt et à la diffusion de documents scientifiques de niveau recherche, publiés ou non, émanant des établissements d’enseignement et de recherche français ou étrangers, des laboratoires publics ou privés.
on deforestation: Compensated Successful Efforts for
“avoided deforestation” (REDD)
Pascale Combes Motel, Romain Pirard, Jean-Louis Combes
To cite this version:
Pascale Combes Motel, Romain Pirard, Jean-Louis Combes. A methodology to estimate impacts of domestic policies on deforestation: Compensated Successful Efforts for “avoided deforestation” (REDD). 2011. �halshs-00556933�
Document de travail de la série Etudes et Documents
E 2008.05
A methodology to estimate impacts of domestic policies on deforestation:
Compensated Successful Efforts for “avoided deforestation” (REDD)
June 2008 38 p.
Combes Motel*, P., Pirard+*, R., Combes*, J-L.
* Centre d’Études et de Recherches sur le Développement International (CERDI), 65 boulevard F. Mitterrand, 63000 Clermont Ferrand, France. Fax: +33 (0) 4 73 17 74 28 + Institute for Sustainable Development and International Relations (IDDRI), 27 rue Saint-Guillaume, 75337 Paris Cedex 07, France. Fax: +33 (0) 1 45 49 76 85
Corresponding author: romain.pirard@iddri.org
Abstract
Climate change mitigation would benefit from Reduced Emissions from Deforestation and Degradation (REDD) in developing countries. The REDD mechanism is in charge of distilling the right incentives for fostering forest conservation with appropriate compensation of foregone revenues, which in turn is related to avoided deforestation (how many hectares of forests are saved). Although any prediction of deforestation rates (i.e. business-as-usual scenarios) is challenging, and any negotiated target is subject to political influence, these two ways have been prioritirized so far. In other words, proposals have focused on a baseline (or cap)-and-trade approach, which relevance is questionable because resulting financial compensations are subject to unfairness if estimations of avoided deforestation are not reliable. Rather than considering overall deforestation (predicted and observed), we argue that a REDD mechanism would gain from linking compensations to real efforts that developing countries implement for slowing deforestation rates. This would provide more efficient incentives to design and enforce suitable policies and measures. The methodology we present to measure these efforts (labeled Compensated Successful Efforts) is based on the rationale that overall deforestation is due partly to structural factors, and partly to domestic policies and measures. This typology differs from others presented in the literature such as proximate / underlying causes, or economic / institutional factors. Using an econometric model, our approach estimates efforts that are (i) independent of structural factors (economic development, population, initial forest area, agricultural export prices), (ii) estimated ex post at the end of the crediting period, and (iii) relative to other countries. In order to illustrate the methodology we apply the model to a panel of 48 countries (Asia, Latin America, Africa) and four periods between 1970 and 2005. We conclude on the feasibility to estimate avoided deforestation using the Compensated Successful Efforts approach. In addition to being conservative from an environmental perspective, this approach guarantees fairness by accounting for dramatic changes during the commitment period.
1.
Introduction
1.1. “Avoided Deforestation” for climate change mitigation
The Climate Convention resulted in the Kyoto Protocol with legally-binding targets for Greenhouse Gas emissions in industrialized countries. While focusing on fossil fuel emissions, this agreement did also include emissions related to land uses in these countries. Besides, their commitments might be achieved through emissions reductions in forestry projects eligible under the Clean Development Mechanism (CDM). Agreements in 2001 limited projects to plantation activities. But other activities related to forestry would serve the ultimate objective of the climate convention, which makes a good case for their inclusion: “besides delaying climate change, [forests] delay effects of vulnerability” (Dutschke, 2007, p. 297).
Tropical deforestation broadly speaking - including permanent conversion of forests, shifting cultivation, and forest management - was responsible for emissions amounting to 15-35% of those generated by fossil fuels in the 1990s (Houghton, 2005). Since ignoring such a source of emissions would affect the measures to combat climate change, the formal inclusion of "Avoided Deforestation" (REDD) in the Kyoto Protocol is being intensively discussed in international fora (Skutsch et al., 2007). In this paper we consider deforestation only without addressing emissions reductions with sustainable logging practices because methodological issues at stake differ (UNFCCC, 2007).
1.2. Existing proposals and unsolved issues
A mechanism to compensate developing countries for reduced deforestation rates is an appealing idea and might allow countries with large tropical forest areas to access carbon finance (Chomitz et al., 2007). Several proposals have been submitted so far by a range of stakeholders: Parties to the Convention (e.g. Central Africa countries), research institutes (e.g.
CISDL), NGOs (e.g. Rainforest Alliance), etc. All of them share a common paradigm: avoided deforestation is estimated as the gap between observed deforestation (or carbon stocks) and a baseline to determine.
The challenge to estimate with accuracy avoided deforestation eligible to compensations stands at two levels: determination of the baseline (deforestation rates of reference or emissions), and measurement of actual emissions. Taking into account recent technological progress we assume that measurement of actual emissions will be feasible in the future (DeFries et al., 2005).
These proposals also present methods to elaborate deforestation rates of reference, which constitute the counterfactual against which emissions reductions are estimated. In their review, Pirard and Karsenty (2008) identified three main categories: deforestation rates of reference are either (i) predicted based on sophisticated models, (ii) extended based on historical trends with or without adjustment factors, or (iii) negotiated based on existing carbon stocks at the start of the crediting period.
In the first two categories (i) and (ii), deforestation rates of reference are poorly reliable because of unpredictable factors (e.g. international commodity prices) and utterly complex drivers of deforestation. The most complete studies to date have solely identified which variables impact on deforestation but cautiously abstained from weighting the importance of these variables quantitatively (Geist and Lambin, 2002; Angelsen and Kaimowitz, 1999)1. If based on historical trends, the deforestation rate of reference cannot pretend to be realistic if it assumes no change in the domestic / international context (without adjustment factors). But any assumed change in context with an adjustment factor must rely on negotiations with
1
In addition some have stressed methodological problems that arise for econometric models (Mahapatra and Kant, 2005) and models applied to global panels (Scrieciu, 2007)
associated political influence. In the third category negotiations are clearly subject to political pressures with a risk that objectives are eventually inflated.
Among the consequences of using inaccurate deforestation rates of reference, the environmental integrity of the mechanism is threatened: “fake” carbon credits (non additional reductions) are likely to be allocated, and scarce public financial resources might be inefficiently spent.
1.3. A new approach to estimate avoided deforestation imputable to domestic efforts
We argue that these shortcomings are unavoidable if proponents of REDD do not consider another paradigm. Indeed proposals so far have followed the mainstream pattern: they attempt to estimate reductions of overall deforestation notwithstanding the difficulty to fix the counterfactual. The mechanism is therefore assumed to compensate overall reductions of deforestation, as this is explicitly stated by the prominent “Compensated Reductions” approach (Santilli et al., 2005). A first step towards a new paradigm was formulated in Benndorf et al. (2007, p. 285) who promote “Cause-oriented commitments [that] can take the form of non-quantified Policies and Measures”. In this paper we wish to go one step further with an econometrically-based approach. Rather than considering overall deforestation (observed and predicted) for each participating country, we attempt to identify specifically impacts of domestic policies and measures (thereafter called “efforts”).
To estimate avoided deforestation induced by efforts specifically has the great advantage to bypass (not solve) the unsolved problems related to the prediction of overall deforestation. Indeed we do not need a counterfactual, as we detail in the next section. Another way to deal with domestic efforts would be to compensate countries in a direct way, e.g. training security guards in protected forest areas, financing increased salaries for forestry officers in order to
combat corruption, compensating smallholders for not converting forests into agricultural fields, etc. This is done by projects such as the Australia Global Initiative on Forests and Climate. But this provides limited access to carbon finance because it does not generate marketable carbon credits.
In the second section we describe our approach labeled “Compensated Successful Efforts” and related issues. Next, we apply it with a panel of 48 developing countries with large tropical forests over the period 1970-2005. Last, we discuss the results of the model, and conclude.
We stress the methodological orientation of this paper, which the reader shall not expect to present authoritative predictions in terms of how much effort to impute to each country. For two reasons: data on deforestation in developing countries over 1970-2005 remain poorly reliable; and REDD as a major incentive for reducing deforestation is not implemented yet. But REDD will likely foster elaboration of improved data on forests even for past periods, thereby making our approach fully applicable.
[Insert Box 1]
2.
“Compensated successful efforts”: An innovative approach to
estimate avoided deforestation
2.1. What innovations compared to other approaches?
In contrast to proposals that focus on reductions of overall rates of deforestation, we develop an approach based on the estimation of domestic “efforts” by developing countries to reduce deforestation through implementation of public policies and measures. This approach is inspired by the fact that deforestation is due partly to structural factors, market failures, and
policy failures (cf. Figure 1). Therefore developing countries that are willing to reduce deforestation might be able a minima to correct policy failures that constitute a “low hanging fruit”. For instance, Culas (2007) shows that more secure property rights result in lower deforestation ceteris paribus. We also argue that deforestation due to structural factors is far easier to estimate compared to overall deforestation, especially if estimated a posteriori once the evolution of the main factors is known.
The three main characteristics that make our approach innovative are:
- Deforestation due to domestic efforts is explicitly distinguished from deforestation due to structural factors. This allows the mechanism to account for the factors the country has no grip on, thereby imputing avoided deforestation to domestic policies only;
- Estimation of avoided deforestation rates is done a posteriori (at the end of the crediting period). This allows the mechanism to fully take into account the evolution of structural factors, which is not possible under current proposals with predictions ex ante at the beginning of the period;
- Efforts to reduce deforestation are estimated relatively to other participating countries, and not in absolute terms. This allows the mechanism to be conservative with the identification of most virtuous countries only. It gives strong guarantees for environmental integrity.
2.2. How to distinguish between domestic efforts and structural factors?
2.2.1. Preliminary list of structural variables
While our approach’s rationale is to estimate avoided deforestation due to domestic policies and measures, it stems in fact from the assumed feasibility to estimate structural deforestation due to heavy trends and exogenous factors. Once structural deforestation is estimated and compared to observed deforestation, it is then straightforward to conclude that a country has (or has not) implemented policies to reduce deforestation and is eligible to compensations (or is not).
Obviously the key lies in the identification of significant structural factors that we define as follows: factors of significant influence on deforestation, that follow heavy trends and that are unlikely to be tools in government’s hands for reducing deforestation.
Table 1 recapitulates key variables with assumed impacts on deforestation (according to the literature), and provides a preliminary attempt to set apart proxies for structural factors.
[Insert Table 1]
This table is elaborated according to main consensual research results on tropical deforestation.2 While not an exhaustive list, it intends to serve as a sound basis to identify structural factors to account for in the model. Note that a necessary condition for selected variables is to be measurable. Next sub-sections discuss the eligibility of short-listed variables.
2
Note that sometimes there is no consensus on whether the impact is positive or negative (e.g. technological change, or timber prices).
2.2.2. Economic development
The relation between deforestation and economic growth is commonly analyzed with the Environmental Kuznets Curve. While the impact of economic growth on deforestation does not deserve to be further debated, its structural nature might be questioned within our framework. On the one hand domestic policies have a straightforward influence on economic growth, but on the other hand the external economic context accelerates or reverses these trends. Note that the more the country is open the more the external environment will impact domestic economic development.
Finally we see two important arguments in favor of including economic development in the model: First it cannot be suspected of use by public authorities specifically for reducing deforestation: obviously it remains a top priority for any government ahead of complying with a hypothetical REDD mechanism. Second it would be counterproductive not to compensate a country just because its economic development turns out to induce more deforestation: it would potentially act as an incentive against development. Instead, we prefer to explicitly encourage and reward additional public measures that reduce deforestation for a given economic development, following Bhattarai and Hammig (2004, p. 370) who hypothesized that “underlying institutional and policy conditions affect the relationship between deforestation and income”.
Note that demographic growth impacts on deforestation are consensual for several reasons that we do not take space to debate here. This significant impact is confirmed by the model.
2.2.3. Initial forest area
Deforestation is positively correlated to the initial forest area for at least two reasons: the smaller the forest area, the more remote and expensive logging or forest conversion activities;
the smaller the forest area, the more non-forested lands (in proportion to total area) available to other land uses such as agriculture, cattle ranching, tree plantations or urbanization. This positive correlation is one key finding of research on forest transitions: many countries follow the “forest scarcity path” with decreasing net forest loss induced by increasing forest scarcity (Rudel et al., 2005).
Furthermore, the inclusion of this structural variable allows our approach to indirectly reward countries with early actions for forest conservation, which is a common claim among developing countries (UNFCCC, 2007). Indeed countries that undertake early actions (for conservation) will tend to retain larger forest areas than others due to less deforestation. Consequently their structural deforestation estimated based on the “initial forest area” at the beginning of the period will be relatively high.
2.2.4. Agricultural commodities export prices
At an aggregate level, most models show a positive correlation between agricultural prices and deforestation (Angelsen and Kaimowitz, 1999): the higher the prices the more profitable the forest conversion to agriculture or pastures. Yet this reasoning should be adapted to the case of non-uniform price changes among agricultural crops, because different crops and livestock products affect forests at various degrees. More intensive land uses (soybeans) can be expected to have lower effects on forests than extensive land uses (cattle-raising), for a similar increase in market prices.
Export prices are a structural factor in the sense that most countries are price takers in the international agricultural markets, which is not the case with domestic markets where policies and measures have a significant impact (input subsidies, tariff barriers...). We include the most relevant agricultural commodities for tropical developing countries with respect to deforestation, according to Niesten et al. (2004): cattle, cocoa beans, coffee green, natural
rubber, palm oil, soybeans. Tailoring the list of agricultural commodities to each country would have rendered the model more accurate in estimating their impacts on deforestation. For instance palm oil and natural rubber have the highest impacts for Indonesia and Malaysia, but cattle and soybeans are most relevant for Brazil (Miyamoto, 2006, WRM, 2004). However, we decided to merge all commodities for each country in order to increase the degrees of freedom in the model. Table 2 illustrates differing importance of agricultural commodities among countries.
[Insert Table 2]
The variable estimates the instability of export prices rather than means or increases over a period. In the case of abrupt increases over several years in agricultural export prices, forest conversion becomes attractive for developing alternative land uses. It is therefore likely that abrupt increases in prices (that translate into higher instability) enhance deforestation. But the reverse is not true because forest clearance is irreversible at least in the middle run. This “asymmetrical effect” is also observed for economic reasons: sunk costs associated to forest conversion into agricultural fields create an irreversibility effect because farmers keep on doing agriculture despite drops in commodity prices. On the other hand, higher instability might be perceived as higher risk by land users with negative impacts on deforestation rates. Empirical results with our model ultimately show that this latter impact is relatively weak compared to the “asymmetrical effect”.
2.2.5. Timber export prices
Research findings do stress how ambiguous and controversial is the effect of higher international timber prices on logging and deforestation (Arcand et al., 2007; Angelsen and Kaimowitz, 1999). Even translated in export prices, higher prices might have contrasted effects. On the one hand higher prices might induce investments in logging operations and
forest conversion to alternative land uses. On the other hand higher prices might encourage more sustainable and long term forest management where there is secure land tenure because of the increased value of forests (Chomitz et al., 2007). In its study of the links between macroeconomic change and timber production (among other traded-sector production), Wunder (2005, p. 82) contends that “sharp nominal devaluation can have dramatic expansionary effects on logging”. Yet, the same author further admits that its theoretical framework “misses the point that domestic markets drive logging expansion in most developing countries”. This point is also stressed by Sierra (2001) who showed that in Ecuador domestic timber prices did not react significantly to market liberalization and enhanced timber trade, and concluded that international trade has low impacts on domestic deforestation in this context. Wunder (2005) and Mæstad (2001) insist that specific forest products should be targeted for a more robust analysis.
Therefore we decide not to take timber export prices as a structural variable although we recognize it could improve the model if done with a sufficient level of disaggregation among forest products3. Important to note, the temporal fixed effects in the model reflect timber prices in international markets to some extent: if these prices show great variations over one period, it is likely that export prices will follow the same trend for most countries.
2.2.6. Climatic events
The variable “climatic events” illustrates how difficult to draw a frontier between structural factors / domestic efforts. While countries have absolutely no grip on climate itself, its consequences might be closely related to domestic policies and measures. For instance fires in Indonesia are aggravated by droughts (El Niño), but research also concludes that land use and
3
But complete disaggregated information is not available for all countries. Moreover domestic policies can modify the export structure for a given country, in particular when domestic timber processing is promoted against roundwood exports.
policies play a significant role in mitigating or increasing fire occurrences (Stolle et al., 2003; Dennis et al., 2005). Some studies deliver spectacular conclusions, such as Chomitz et al. (2007) who show the link between rainfall and deforestation in Brazilian Amazonia.
But this variable does not satisfy the necessary condition of being measurable: some values (temperatures, rainfall…) might have contrasted impacts on deforestation among countries and within a same large country with several weather patterns and forest biomes. Note that climatic phenomena with repeated occurrences in a given country are reflected in the country fixed effect. For instance, repeated El Niño in South-East Asia since the early 1980s are likely to translate into higher structural deforestation as estimated by our model.
2.2.7. Foreign debt
According to the review by Angelsen and Kaimowitz (1999, p. 90) the studies do not converge on the impact of foreign debt on deforestation, because of poor-quality data or “very simplistic assumptions about government objectives and policy formation”. This is a variable on which governments have a grip even though it is imposed at the beginning of a period. Governments encourage forest depletion to generate short-term gains through tax collection in order to reimburse the foreign debt they inherited; and the portion of the budget that is allocated to debt reimbursement depends on public decisions. These are mixed arguments for including the variable in the model. But a decisive argument for not including it arises from the risk of double-counting with debt-for-nature swaps deals during the period: a country might reduce its debt through agreements on the conservation of forest areas, and simultaneously benefit from REDD owing to the direct positive impact on deforestation.
2.2.8. Others
The impact of demographic variables on deforestation is widely acknowledged, but its classification in structural variables / domestic policies variables is questionable. While governments can launch programs to increase / decrease population growth, it is unrealistic to expect such policies to be strictly related to REDD objectives. Moreover impacts of such policies might be felt in the long term but certainly not in the 5-year periods of time that are considered by the REDD mechanism.4
For reasons partially similar to timber export prices, the real exchange rate might have contrasted effects on deforestation (less competitiveness on international markets, but increased domestic demand), although latest research on the matter concludes: “our economic results do not reject the null hypothesis that real depreciations increase deforestation in developing countries” (Arcand et al., 2007, p. 18). Beside ambiguous effects on deforestation, we see another good reason for not taking the real exchange rate as a structural variable: governments can devaluate their currency, which is a realistic hypothesis in the developing world. It is thus a domestic policy tool and potentially a “domestic effort” to reduce deforestation.
The role of technological change is debated because opposite assumptions might be verified in different contexts. On the one hand higher productivity is an incentive for agriculture expansion on a large scale because of higher financial returns; on the other hand higher productivity allows farmers to cultivate smaller areas for similar results. Impacts might be different for export crops or subsistence agriculture. Moreover, the measure of technological change in agriculture might be misleading if ones takes the usual indicator “agricultural yield” (or land productivity) as it says nothing on the intensity of the factors of
4
Adjusted R-squared with our model decreases slightly by 2.5 points if demographic variables are suppressed from the list of structural variables.
production capital and labor (Federico, 2005). As for climatic events, it is indirectly accounted for in the model with the fixed effects.
Last, economic circumstances clearly affect deforestation through various channels. In least developed countries, for instance, rapid increments in wealth stimulate activity in forested areas because of new road infrastructure, chainsaw purchases, seeds purchase, etc., with direct impacts on forest cover. In countries with relatively small forest cover, these increments in wealth stimulate job creations in urban areas and rural migrations, with lowered pressure on remaining forests (Rudel and Roper, 1997).
2.3. Main differences with other deforestation models
2.3.1. Environmental Kuznets Curve (EKC)
On purpose we do not include variables related to governance and institutional improvements as structural variables, because these are among the most obvious tools available to public authorities: “strengthening of sociopolitical institutions would help to flatten the EKC for deforestation and reduce the present level of tropical deforestation worldwide” (Bhattarai and Hammig, 2001, p. 1006). Although EKC models generally view better governance as an efficient means to achieve lower deforestation rates or environmental degradations while pursuing economic development (Dasgupta et al., 2006), note that some authors demonstrated empirically that preferences for environmental quality are better expressed under a democratic than an autocratic regime (Farzin and Bond, 2006). Some argued that countries with highest biodiversity richness are those with highest levels of political corruption (Smith et al., 2003), but others stressed the complexity of the links between public governance and the overexploitation of natural resources (Barrett et al., 2006). By capturing the effects of governance among all other domestic efforts rather than specifically, our model is not affected by the complexity of these links.
2.3.2. Forest transitions
Our model also differs from models used to study forest transitions, i.e. models that study the correlations between deforestation and economic growth (“economic development path”) or remaining forest area (“forest scarcity path”) according to Rudel et al. (2005). Not only do forest transition models take into account reforestation activities, which constitute the core of forest transition phenomena in industrialized countries (Rudel, 1998; Mather et al., 1999) or developing countries like China or Vietnam (Mather, 2007), while we only consider natural forest area; but in addition our model includes explanatory variables with high instabilities (e.g. agricultural export prices), which is not the case for most forest transition models that focus on long-run trends (Perz, 2007).
2.3.3. Proximate and underlying causes of deforestation
Our choice of explanatory variables is not based on the common distinction between proximate (or direct, or immediate…) and underlying causes of deforestation (e.g. in Geist and Lambin, 2001). We are not concerned by the fact that some causes are direct in the sense that their occurrence or variation generates more or less deforestation through simple channels (e.g. infrastructures, agriculture); and other causes are underlying in the sense that they impact on the sources of deforestation through more complex channels (e.g. impact of agricultural technological change or domestic currency devaluations on smallholders’ decisions to convert forests).
In contrast, our approach makes a distinction between (i) variables that pertain to domestic efforts, mostly public activities that are initiated and implemented by public authorities; and (ii) variables to which public authorities must adapt mostly deep-rooted trends or structural factors. This is why our approach has no intention to predict a deforestation rate of reference, but rather to evaluate a posteriori structural deforestation rates. Thus, this approach allows us
to avoid the unsolved problems related to any prediction of deforestation rates. For instance Wunder (2000) pointed out “the wealth of theories” in this field and isolated six main theoretical approaches to deforestation: the role of logging companies, the fuelwood trap, poverty, population growth, tenure and access rules, and extra-sectorial (non-forestry) policies.
3.
“Compensated successful efforts”: an application to four periods
between 1970 and 2005
3.1. The econometric model
The general form of the econometric model we used for applying our approach is given by the following equation:
it K k kit k t i it a a a b x y = + + +
∑
+ε =1where i = 1,…, N countries and t = 1,…, T periods; ai the intercept term for country i, at the intercept term for period t; bk , k = 1, …, K the coefficient to be estimated for the K structural variables; εit the error term that is identically and independently distributed.E
(
ε
it,xkit)
=0 ∀k and has a zero mean.: structural variables are orthogonal to the error term. This econometric hypothesis has an economic interpretation in the sense that it is assumed that the model is correctly specified i.e. pertinent structural variables are not omitted and that deforestation does not influence structural variables within periods.ai catches unobservable countries’ structural characteristics that are period invariant, e.g. long term climatic and geographical characteristics. at catches unobservable periods’ characteristics that are country invariant, e.g. international price movements. In other words,
the heterogeneity through space and time is assumed to be fully accounted for by the panel structure, i.e. country and period fixed effects.
A panel least squares estimation is preferred since all included countries are primarily concerned with tropical deforestation. We thus make the reasonable assumption of fixed effects (Green, 2000).
Residuals are calculated as follows:
ε
ˆit ≡ yit −yˆit with yˆit the “structural” deforestation and yit the observed deforestation. Residuals measure relative avoided deforestation efforts. They are a proxy of the autonomous part of policies that contribute to avoided deforestation. If residuals are significantly negative, it indicates an avoided deforestation successful effort owing to efficient domestic policies and measures. Conversely, a significantly positive residual indicates additional deforestation caused by market or policy failures. Residuals obviously also include random variables like measurement errors in deforestation figures, idiosyncratic shocks which are assumed to be orthogonal to explanatory variables. Hence, only residuals that are significantly different from zero can be interpreted as a measure of avoided (negative or positive) deforestation effort.[Insert Table 3]
3.2. Data
For each of the 48 countries included in the sample (Table 4), four observations are available on the following periods: 1970-1980, 1980-1990, 1990-2000, and 2000-2005. Observations are period averages that allow to get rid of short-term fluctuations in order to better identify structural determinants of deforestation.
Forest area statistics are taken from FAOSTAT (www.faostat.fao.org) for the 1970-90 periods, and from FAO (2006) for the 1990-2005 periods. We calculated natural forest areas by subtracting “forest plantations areas” from “total forest areas” for years 1990-2005, but kept given forest area figures for years 1970-90.
Agricultural commodities export prices are taken from FAOSTAT (www.faostat.fao.org). The variable is calculated based on weighted annual means according to their relative total export values. For each period, we used for each country only the commodities without missing data (or equal to zero) in order not to have artificial ups and downs in the average annual unit export value. The variable calculates the instability during each period for each country.
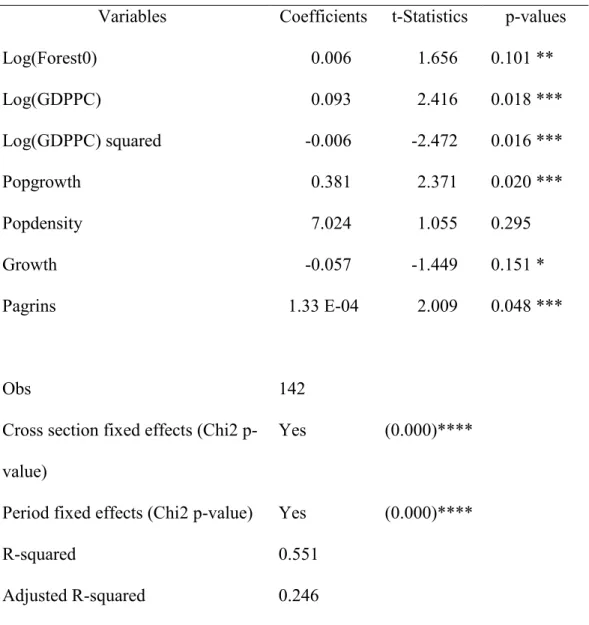
3.3. Results
[Insert Table 5]
Structural variables explain one fourth of observed deforestation rates variability.5 Coefficients for explanatory variables give expected signs. In particular, we observe a Kuznets curve, the positive impact of demographic variables,6 and the positive correlation between initial forest areas and deforestation rates. Initial forest areas have a positive impact on deforestation and thereby exhibit a convergence effect of forests towards a long term level. The estimated coefficient shows that the gap between the actual level of forest area and its long-term level is reduced at a 0.6% annual rate. The Growth variable has a negative but weak impact on deforestation.
5
It does not mean however that three fourth of observed variability is the result of policy measures and / or market failures since residuals are also the subject of measurement errors on deforestation rates and / or idiosyncratic shocks.
6
Demographic variables impacts must be cautiously interpreted since FAO used population densities (among others) to calculate deforestation rates in about 50% of the developing countries included in our sample in 1980 (Rudel and Roper, 1997)
The agricultural commodities export prices (instabilities) are highly significant7: the more instable the prices over one period, the more deforestation presumably for generating profits from forest conversion into agricultural land uses. This correlation is very useful for the purpose of determining avoided deforestation with REDD, because it links a significant part of the deforestation to factors that countries do not control and should not be deemed responsible for. By definition these prices are prone to great fluctuations because of the speculative international markets on which the commodities are sold.
[Insert Table 6]
4.
Discussion
In this section the reader should bear in mind the illustrative stance of the paper and not expect authoritative estimations of avoided deforestation. Looking at a regional scale, the model confirms heavy trends already expressed in the literature, in particular the increasing deforestation in African countries in recent years 2000-2005. These countries had deforested less than estimated by structural factors during the period 1970-80, likely because of very limited infrastructure provision. With a global recent improvement of the investment climate in the region, with Chinese entrepreneurs in particular, it is not surprising that overall deforestation was greater than estimated with structural factors. This trend might keep going in the coming years. Different from Asian and Latin American countries where agriculture is a major cause of deforestation, most forest degradations in Africa are due to timber production specifically and do not lead to conversion: they might thus not appear in deforestation figures.
7
We ran the model with an alternative specification: instead of instabilities, we tried to take increases over each period. The variable is built as follows: the main commodity is selected for each country and each period (criteria: highest export value in first year of period), and the increase over the period is multiplied by the relative added value of the agricultural sector (interactive term). This specification was inspired by Barbier (2004). However, as expected (see 2.2.4), it is less significant in the model compared to the instability of export prices.
[Insert Table 7]
Looking at the countries individually, we detect which ones are virtuous, which is equivalent to being eligible to compensations for REDD. Globally there are 9 episodes of significant (20% level) avoided deforestation, and 9 episodes of over-deforestation levels (Table 7). African countries are relatively less involved in avoided deforestation episodes. Latin American countries are more involved in avoided deforestation efforts and over-deforestation episodes as well. This is probably the manifestation of a great variability in economic policies and market failures in Latin America.
Costa Rica has a significant avoided deforestation in 2000-2005. This could be due to a conservation program initiated in the late 1990s based on Payments for Environment Services, or to other factors such as macroeconomic policies. Also, the model indicates that China over-deforested in 1980-90, but reversed the trend afterwards because of the large floods that devastated the country in the late 1990s.
The Philippines are a specific case, with far too high deforestation rates in the 1970s and a huge avoided deforestation in the 1980s. While the country has indeed made efforts to slow forest conversion in the late 1980s, and while the remaining forest areas had dropped dramatically in the 1970s thus possibly generating an abrupt “scarcity path” phenomenon, the model might have unduly detected avoided deforestation because of inaccurate FAO figures.
Nepal and Honduras provide important insights for the reliability of the approach. Nepal has avoided deforestation in 1980-90, during which period the country suffered a great instability in cattle export prices. This was taken into account by the model. Reversely, Honduras has high deforestation rates over the two last periods, but the model detected over-deforestation in the last period only, mainly because the country had suffered high instability in cattle export prices during the previous period.
The Indonesian case is interesting as a major country with respect to tropical forests. While deforestation rates there are usually considered very high, the fixed effect term in the model takes this long term trend into account. As a consequence, Indonesia is not identified as a country with significantly low or high deforestation rates in addition to structural deforestation. As the country has lots of policy failures (e.g. law enforcement) that national authorities could address to protect forests, any future improvement would likely appear in the model as avoided deforestation.
We must stress the methodological orientation of this paper, as data available for running the model in all cases lack accuracy, and in some cases are misleading. Therefore we do not expect that results are robust in identifying low / high deforestation compared to the structural one. But the intensifying debate on how to compensate developing countries for their efforts in reducing emissions from deforestation will certainly mobilize increasing amounts of human and financial resources to this objective. This has started already with the COP13 that attracted much attention on the matter. This will likely contribute to dramatic efforts for making better forest / carbon inventories in order to monitor natural forest evolution. Key to our approach, these efforts can also improve data on past deforestation rates (M. Løyche Wilkie, pers. com., 15 May 2007, FAO Forestry Department) with obvious consequences in terms of accuracy for estimating structural deforestation and residuals.
So far no large incentive such as REDD has ever been designed and implemented for forest conservation. In other words our approach should not be able to detect the effects of such a mechanism which does not exist yet. Strictly talking only Costa Rica without doubt deserves recognition for avoided deforestation owing to its original, large-scale, and successful program based on Payments for Environmental Services. To some extent, this program could be substituted by a REDD mechanism with similar effects that our model would easily capture.
5.
Conclusions
To give tropical deforestation a prominent role in climate change mitigation efforts is deemed necessary and will likely materialize with a mechanism for Reduced Emissions from Deforestation and Degradation (REDD). With this mechanism financial compensations transferred to developing countries will be based on the national level of avoided deforestation and degradation, which is by definition equal to the gap between observed deforestation and degradation and a target to agree upon. Depending on proposals so far, this target would be either predicted or negotiated, but experts agree on the pitfalls of both approaches. Predicting deforestation and degradation with accuracy is not realistic and negotiated targets are prone to political influences.
To solve these methodological issues, we propose to estimate avoided deforestation without using these targets8. We assume that overall deforestation in developing countries is the sum of structural deforestation and a residual deforestation (positive or negative) due to domestic policies and measures. In other words, structural factors such as economic development and growth, population densities, initial forest areas, climatic events, or international agricultural commodity markets, have an impact on deforestation rates in each country. In addition to that, countries have specificities in terms of governance, law enforcement, economic incentives, etc., that generate an overall observed deforestation that is either higher or lower than structural deforestation. Virtuous countries with appropriate and voluntary policies will likely contain their deforestation below estimated structural deforestation. Reversely, countries that do not conduct specific policies in this sense, or countries that accelerate deforestation for any reason, will likely exceed structural deforestation.
8
Our approach takes the form of an econometric model applied to a panel of participating countries over several periods. Regressions provide coefficients for structural factors and resulting structural deforestation for each period. The gap with observed deforestation is caught by the residual. A residual that is significantly negative for a given country during a given period indicates avoided deforestation. It is the statistical expression of domestic policies and measures that help contain deforestation despite the influence of structural factors. To gain accuracy and fairness, estimations are done a posteriori at the end of a crediting period. This allows the model to fully account for the evolution of structural factors. In the case of international market prices for agricultural commodities, for instance, we argue that this is necessary because of their speculative nature and unpredictable evolution.
We apply the model to 48 countries over five periods from 1970 to 2005. Notwithstanding imprecise data on forest cover, and the associated warnings concerning the accuracy of avoided deforestation estimations, we obtain encouraging results. For instance, Costa Rica is detected as a virtuous country during recent times, which result is supported by its large remaining forest cover, and (debated) implementation of an innovative Payment for Environmental Services program.
Data on deforestation in tropical developing countries is known to be imprecise in best cases, and misleading in worst cases. We are aware of this limitation (not specific to our approach) for the interpretation of the results. While stressing the methodological orientation of the present article, we have no doubt that implementation of the REDD mechanism will rapidly prompt improvements in the field of deforestation monitoring and measurement. Technical solutions exist, and implementation is just a matter of willingness and financial resources. We are optimistic because participation to REDD is voluntary, and the mechanism will likely generate large financial transfers. Concerning idiosyncratic shocks and their
misleading impacts on the residuals in the model and hence on the estimated avoided deforestation, this risk can be overcome by using higher confidence levels.
We therefore conclude on the feasibility of an estimation of avoided deforestation based on the estimation of structural deforestation rates. Note that the list of structural factors might be modified according to claims that countries would justify in advance of the crediting period, and is thus subject to changes if deemed necessary. We do not pretend that such a list is definitive, neither that it is fully objective. On the contrary it remains open to political discussion, and should continuously incorporate progress in the general understanding of tropical deforestation. But while dynamic and subject to revisions, we argue that this list provides a better and more consensual basis to estimations of avoided deforestation than ex-ante predictions for baselines or politically negotiated targets.
In addition to being conservative from an environmental perspective, this approach guarantees fairness by accounting for dramatic changes during the commitment period, such as abrupt increases in agricultural prices or population growth. These are two conditions necessary to fulfill if one wishes to get the support from all parties, inclusive of participating countries and those seeking environmental integrity. In other words, the “Compensated successful efforts” stands as a trade-off between the reward of results compared to national deforestation rates and the reward of bare efforts with no guarantee of effective implementation. As such, it completes unavoidable and even desirable political negotiations with the support of a scientific approach.
References
Angelsen, A. and Kaimowitz, D., 1999. Rethinking the causes of deforestation: lessons from economic models. The World Bank Research Observer, 14(1):73-98.
Arcand, J-L., Guillaumont, P. and Guillaumont-Jeanneney, S., 2007. Deforestation and the real exchange rate. Journal of Development Economics. In press.
Barbier, E.B., 2004. Explaining agricultural land expansion and deforestation in developing countries. Paper prepared for the session “Panel data evidence on economic development and the environment in developing countries”, American Agricultural Economics Association annual meeting, August 1-4, Denver.
Barrett, C., Gibson, C., Hoffman, B. and McCubbins, M., 2005. The complex links between governance and biodiversity. Conservation Biology, 20(5):1358-66.
Benndorf, R., Federici, S., Forner, C., Pena, N., Rametsteiner, E., Sanz, M-J. and Somogyi, Z., 2007. Including land use, land-use change and forestry in future climate change agreements: thinking outside the box. Environmental Science and Policy, 10(4):283-94. Bhattarai, M. and Hammig, M., 2004. Governance, economic policy, and the Environmental Kuznets curve for natural tropical forests. Environment and Development Economics, 9:367-82.
Chomitz, K.M., Buys, P., De Luca, G., Thomas, T.S., and Wertz-Kanounnikoff, S., 2007. At loggerheads? Agricultural expansion, poverty reduction, and environment in the tropical forests. World Bank Policy Research Report. Washington DC.
Culas, R.J., 2007. Deforestation and the environmental Kuznets curve: An institutional perspective. Ecological Economics, 61:429-37.
Dasgupta, S., Hamilton, K. Pandey, K.D. and Wheeler, D., 2006. Environment during growth: accounting for governance and vulnerability. World Development, 34(9):1597-1611.
DeFries, R., Achard, F., Brown, S., Herold, M., Murdiyarso, D., Schlamadinger, B., and de Souzo Jr., C., 2007. Earth observations for estimating greenhouse gas emissions from deforestation in developing countries. Environmental Science and Policy, 10(4):385-94.
Dennis, R., Mayer, J., Applegate, G., Chokkalingam, U., Colfer, C.J.P., Kurniawan, I., Lachowski, H., Maus, P., Permana, R.P., Ruchiat, Y., Stolle, F., Suyanto and Tomich, T.P., 2005. Fire, people and pixels: linking social science and remote sensing to understand underlying causes and impacts of fires in Indonesia. Human Ecology, 33(4):465-504.
Dutschke, M., 2007. CDM forestry and the ultimate objective of the climate convention. Mitigation and adaptation strategies for global change, 12:275-302.
FAO, 2006. Global Forest Resources Assessment 2005. Progress towards sustainable forest management. FAO Forestry Paper, 147, Rome.
Farzin, Y.H. and Bond, C.A., 2006. Democracy and environmental quality. Journal of Development Economics, 81(1):213-35.
Geist, H.J. and Lambin, E.F., 2002. Proximate causes and underlying driving forces of tropical deforestation. BioScience, 52:143-50.
Geist, H.J. and Lambin, E.F., 2001. What drives tropical deforestation? LUCC Report Series, 4, University of Louvain.
Green, W.H., 2000. Econometric analysis. Prentice Hall International, Hempstead, UK.
Houghton, R.A., 2005. Tropical deforestation as a source of GHG emissions. In: P. Moutinho, P. and S. Schwartzman (Editors), Tropical Deforestation and Climate Change. Amazon Institute for Environmental Research and Environmental Defense, Belém, Brazil, pp. 13-22. Mæstad, O., 2001. Timber trade restrictions and tropical deforestation: a forest mining approach. Resource and Energy Economics, 23:111-32.
Mahapatra, K. and Kant, S., 2005. Tropical deforestation: a multinomial logistic model and some country-specific policy prescriptions. Forest Policy and Economics, 7(1):1-24.
Mather, A.S., 2007. Recent Asian forest transitions in relation to forest-transition theory. International Forestry Review, 9(1):491-502.
Mather, A.S., Fairbain, J. and Needle, C.L., 1999. The course and drivers of the forest transition: the case of France. Journal of Rural Studies, 15(1):65-90.
Miyamoto, M., 2006. Forest conversion to rubber around Sumatran villages in Indonesia: comparing the impacts of road construction, transmigration projects and population. Forest Policy and Economics, 9:1-12.
Niesten, E., Rice, R., Ratay, S.M. and Paratore, K., 2004. Commodities and conservation: the need for greater habitat conservation in the tropics. Center for Applied Biodiversity Science, Conservation International, Washington DC.
Perz, S.G., 2007. Grand theory and context-specificity in the study of forest dynamics: forest transition theory and other directions. The Professional Geographer, 59(1):105-114.
Pirard, R. and Karsenty, A., 2008. Climate change mitigation: should “avoided deforestation” be rewarded? Journal of Sustainable Forestry, In Press.
Rudel, T.K., 1998. Is there a forest transition? Deforestation, reforestation, and development. Rural Sociology, 63(4):533-52.
Rudel, T.K, Coomes, T.K., Moran, E., Archard, F., Angelsen, A., Xu, J. and Lambin, E., 2005. Forest transitions: towards a global understanding of global land use change. Global Environmental Change, 15:23-31.
Rudel, T. and Roper, J., 1997. The paths to rain forest destruction: Cossnational patterns of tropical deforestation, 1975-90. World Development, 25(1):53-65.
Santilli, M., P. Moutinho, S. Schwartzman, D. Nepstad, L. Curran and Nobre, C., 2005. Tropical deforestation and the Kyoto Protocol. An editorial essay. Climatic Change, 71:267-76.
Scrieciu, S.S., 2007. Can economic causes of tropical deforestation be identified at a global level? Ecological Economics, 62:603-612.
Skutsch, M., Bird, N., Trines, E., Dutschke, M., Frumhoff, P., de Jong, B.H.J., van Laake, P., Masera, O. and Murdiyarso, D., 2007. Clearing the way for reducing emissions from deforestation. Environmental Science and Policy, 10(4):323-34.
Smith, R.J., Muir, R.D.J., Walpole, M.J., Balmford, A. and Leader-Williams, N., 2003. Governance and the loss of biodiversity. Nature, 426:67-70.
Stolle, F., Chomitz, K.M, Lambin, E.F. and Tomich, T.P., 2003. Land use and vegetaiton fires in Jambi Province, Sumatra, Indonesia. Forest Ecology and Management, 179:277-92.
UNFCCC, 2007. Report on the second workshop on reducing emissions from deforestation in developing countries, FCC/SBSTA/2007/3, UNFCCC, Bonn.
WRM, 2004. Role of agriculture and cattle-raising in deforestation. WRM Bulletin 85, World Rainforest Movement, Uruguay.
Wunder, S., 2005. Macroeconomic change, competitiveness and timber production: a five-country comparison. World Development, 33(1):65-86.
Wunder, S., 2000. The economics of deforestation. The example of Ecuador. St. Martin’s Press, New York.
Box 1 Definitions and acronyms
Reduced Emissions from Deforestation and Degradation (REDD, or “Avoided Deforestation”). Mechanism related to the Climate Convention that aims to promote emissions reductions from deforestation and degradation in developing countries. It is still debated how to determine the level of financial compensations transferred to host countries.
Deforestation rate of reference (baseline scenario or negotiated target). Counterfactual figure compared to observed deforestation in order to determine the amount of financial compensations (carbon credits or others) to developing countries.
Structural factors. Deforestation is partly due to heavy trends (e.g. population) or exogenous factors (e.g. international markets) that we label “structural factors”.
Domestic efforts. Deforestation is partly due to policies and measures that depend on each country’s willingness to lower deforestation, and that we label “domestic efforts”.
Table 1 Classification of main variables related to deforestation
Variables for domestic policies and measures Structural Variables
Public policies for reducing deforestation
specifically
Public policies for various objectives
Mixed variables for structural factors and domestic policies and
measures
Economic development (long term trends)
Forest conservation Road infrastructure Foreign debt
Economic growth (business cycle)
Land tenure Change in rural unemployment
Real exchange rate
Demographic growth All measures against illegal logging
Governance and institutions
Trade and financial openness
Initial forest area Strict rules for forest management
Agricultural policies Technological change
Export agricultural commodity prices
Timber export prices
Table 2 Main agricultural commodities that compete with tropical deforestation
Cattle Cocoa beans Coffee green Natural rubber Palm oil Soybeans
Argentina x x Brazil x x x Cameroon x x Colombia x x x Costa Rica x x x Ecuador x x x Guatemala x x x India x Indonesia x x x Malaysia x x Nicaragua x x Pakistan x Panama x x x Peru x Tanzania x Thailand x x Uganda x x
Source: FAOSTAT data (www.faostat.fao.org).
Note: Selection based on commodities’ “Export Value 2005”. For each country maximum three commodities among the six. Rejection of commodities without significant commercial importance relative to forest area (“Export value 2005” < “Forest area 2005”). Countries for which no commodity meets these conditions are not represented.
Table 3 Variables’ definition and description
Variables Description Source
Dependent variable:
Defor Average annual deforestation rate, % FAO
Explanatory variables:
Log(Forest0) Initial forest area FAO Log(GDPPC) and
log(GDPPC) squared,
GDP per capita, PPP World Development Indicators 2007 Popgrowth Population growth, average annual growth rates, % World Development
Indicators 2007 Popdensity Population density, average population divided by
the country area in 2000
World Development Indicators 2007 Growth GDP average annual growth rate, % World Development
Indicators 2007 Pagr Agricultural commodity export unit values FAO Pagrins Instability of agricultural commodity export unit
values. It is calculated as the squared residual of a regression where the explained variable is the agricultural commodity export unit value and the explaining variables are its lagged value (stochastic trend) and a deterministic trend9
FAO
9
Agricultural export prices instabilities are thus calculated as deviations from a stochastic and deterministic trend. This method may be applied to stationary and non stationary variables.
Table 4 List of 48 countries included in the model
Africa (23) Asia and Oceania (12) Latin America and Caribbean (13)
Angola (AGO) Madagascar (MDG) Cambodia (KHM) Argentina (ARG) Benin (BEN) Malawi (MWI) China (CHN) Bolivia (BOL) Burkina Faso (BFA) Mozambique (MOZ) India (IND) Brazil (BRA) Central African Republic
(CAF)
Nigeria (NIG) Indonesia (IDN) Chile (CHL)
Chad (TCD) Senegal (SEN) Laos (LAO) Colombia (COL) Dem. Rep. Congo (ZAR) Sierra Leone (SLE) Malaysia (MYS) Costa Rica (CRI) Côte d’Ivoire (CIV) Sudan (SDN) Nepal (NPL) Ecuador (ECU) Ethiopia (ETH) Tanzania (TZA) Papua New Guinea (PNG) Guatemala (GTM) Gabon (GAB) Uganda (UGA) Philippines (PHL) Honduras (HND) Ghana (GHA) Zambia (ZMB) Sri Lanka (LKA) Nicaragua (NIC) Guinea (GIN) Zimbabwe (ZWE) Thailand (THA) Panama (PAN) Kenya (KEN) Vietnam (VNM) Paraguay (PRY)
Peru (PER)
Note: Selected countries had to meet three conditions: being a developing country, being located in the tropics, having a forest area above one million hectares in 1970.
Table 2 Estimation results (Dependent variable Defor)
Variables Coefficients t-Statistics p-values
Log(Forest0) 0.006 1.656 0.101 ** Log(GDPPC) 0.093 2.416 0.018 *** Log(GDPPC) squared -0.006 -2.472 0.016 *** Popgrowth 0.381 2.371 0.020 *** Popdensity 7.024 1.055 0.295 Growth -0.057 -1.449 0.151 * Pagrins 1.33 E-04 2.009 0.048 *** Obs 142
Cross section fixed effects (Chi2 p-value)
Yes (0.000)****
Period fixed effects (Chi2 p-value) Yes (0.000)****
R-squared 0.551
Adjusted R-squared 0.246
Method of estimation: Panel Least Squares. T-statistics are robust to observations specific heteroskedasticity in the disturbances. **** significant at the 1% level; *** significant at the 5% level; ** significant at the 10% level; * significant at the 20% level. Agricultural
commodity export unit values are not included in the regression since they are not significant. Cross section (countries) and period fixed effects are strongly significant.
Table 3 Negative and positive avoided deforestation relative efforts
Regions 1970-1980 1980-1990 1990-2000 2000-2005
Africa - * + ***
Asia - *
Asia except China and India - **** + ** Latin America
African Countries 1970-1980 1980-1990 1990-2000 2000-2005 Congo, Dem. Rep. +
Ethiopia + Ghana - * Malawi + + Mozambique + Nigeria - **** + ** Uganda + Zambia + +
Latin American countries 1970-1980 1980-1990 1990-2000 2000-2005 Costa Rica + **** -**** Guatemala + * - **** Honduras - * - + *** Nicaragua + ** Panama + **** - - * Paraguay - ** + **** - * Asian countries 1970-1980 1980-1990 1990-2000 2000-2005 Cambodia + China + *** - * India + - Indonesia - * + Nepal - *** Philippines + **** - ****
Sri Lanka - *** + Thailand +
Residuals’ signs are reported when they are statistically different from zero at the 1% level (****), 5% level (***), 10% level (**), 20% (*), 35% (no star). A negative sign indicates a relative avoided deforestation effort and a positive one indicates a relative over-deforestation. Efforts are calculated relatively to the mean sample (residual mean is nil)
Table 4 Summary results: avoided deforestation / over-deforestation episodes
Countries 1970-1980 1980-1990 1990-2000 2000-2005
Avoided deforestation episodes (significant at the 20% level)
Total 4 3 1 5
Africa 1 (0.52) 0 0 1 (0.42)
Latin America 2 (1.85) 0 1 (3.69) 3 (2.22)
Asia 1 (1.00) 3 (4.00) 0 1 (China) (0.80)
Asia (except China and India) 1 (1.20) 3 (4.80) 0 0 Over-deforestation episodes (significant at the 20% level)
Total 4 3 0 2
Africa 0 (0.00) 0 0 1 (1.04)
Latin America 3 (2.77) 2 (2.46) 0 1 (1.85)
Asia 1 (1.00) 1 (China) (1.33) 0 0
Asia (except China and India) 1 (1.20) 0 0 0
The absolute numbers of episodes are reported and the relative ones are reported in parentheses (% episodes in the region / % of countries in the region)