Design of a Micro-Fluidic Functional Testing System for Process Characterization of a Hot Micro-Embossing Machine
By
Kunal H. Thaker
B.S., Mechanical Engineering
University of Maryland at College Park, May 2003 B.S. Materials Science Engineering
University of Maryland at College Park, December 2003 Submitted to the Department of Mechanical Engineering in Partial Fulfillment of the Requirements for the Degree of
Master of Science in Mechanical Engineering at the
Massachusetts Institute of Technology June 2006
D Massachusetts Institute of Technology All Rights Reserved
Signature of Author ...
Department of Mechanical Engineering May 12, 2006
Certified by...
r
David E. Hardt Professor of Mechanical Engineering Thesis SupervisorAccepted by ... ... ... Lallit Anand Chairman, Department Committee on Graduate Students
MASSACHUSETTS INSTITUTE OF TECHNOLOGY
BARKER
JUL 1
4 2006
Design of a Micro-Fluidic Functional Testing System for Process Characterization of a Hot Micro-Embossing Machine
by
Kunal H. Thaker
Submitted to the Department of Mechanical Engineering on May 12, 2006 in Partial Fulfillment of the Requirements for the Degree of
Master of Science in Mechanical Engineering
ABSTRACT
Growth in industrial, commercial, and medical applications for micro-fluidic devices has fueled heightened research and development into micro-fluidic design, materials, and increasingly manufacturing. Polymers (Poly(methyl
methacrylate)-PMMA in particular) are the current material of choice given their low cost, wide range of material properties, and biocompatibility. Given most fabrication processes have
focused on hard materials for the semiconductor industry, an alternate set of processes such as hot micro-embossing (HME) have received increased attention as manufacturing processes for high-volume polymer-based micro-fluidic production. An understanding of
the equipment, process physics, control strategy, and metrology for part fabrication are
required when moving from the lab to production level. An initial statistical analysis of
PMMA parts fabricated on the first generation HME system showed the need to: (1)
design a new HME system; and (2) establish alternative methods for characterizing
micro-fluidic parts. A second generation HME system was constructed with fellow
Manufacturing and Process Control Laboratory (MPCL) graduate students and a FTS (Functional Testing System) was developed to test whether HME parts from the new
HME system were capable of flowing fluid and establish output metrics for process
control based on fluid pressure and flow rate. The new characterization method was shown to have re-registration error as low as ± 1.03% (overall RMS uncertainty of ±1.51%). The experimental data from tests run on the FTS fit a fluid model developed to the expected accuracy of -± 10% for all but the lowest aspect ratio micro-channel.
Moreover, the FTS results were consistent with optical scans of a series of parts made
with varying HME parameters. The FTS was able to detect differences that a few
isolated optical scans could not. The FTS provided a bulk quantity to assess the geometry of the channel rather than at a specified location. These results and the
deficiencies in existing metrology techniques warrant further exploration into
functional-based testing for micro-fluidic devices to parallel well established testing methods in place in the IC industry. Functional testing does not have the capacity to replace
traditional metrology; however, it can add an important output metric-a quantitative measure of the output parts fluid flow.
Thesis supervisor: David E. Hardt
Acknowledgements
First, I must thank my family and friends for their support and encouragement, without which this opportunity, much less its completion, would not have been possible.
I would also like to thank Professor Hardt for his technical consultation and his advice and guidance throughout my time here at MIT. It is a privilege to work for someone with such vast expertise in their field who takes the time to pass on that and other lessons to his students.
I would also like to acknowledge Grant Shoji for the work we did together on the HME heat transfer system, initial statistical analysis of micro-embossed parts, tool
design, and the metrology analysis of the first series of HME characterization tests. I would also like to acknowledge Wang Qi for her collaboration on the tool design and both Wang Qi and Matthew Dirckx for help on troubleshooting problems and
suggesting alternatives for design and testing.
I must also thank: Hayden Taylor, for fabricating the silicon DRIE tools and testing PMMA-PMMA bonding; Dan Bums, for his help in obtaining AFM scans of parts; Sam Korb, for his assistance in depositing PDMS on PMMA; Catherine Nichols and Erica Daniels, for their help in navigating the maze that is MIT; and everyone in the LMP machine shop (Gerry Wentworth in particular) for their time and patience with yet another graduate student trying to meet a deadline.
I would also like to thank all my colleagues in 35-135 who made it an enjoyable place to work regardless of the time- day or night.
Finally, I must thank the Singapore-MIT alliance for funding this work and making my studies at MIT possible.
Table of Contents
A cknow ledgem ents... 5
T able of C ontents ... 7
L ist o f F ig ures ... 10
L ist o f T ab les ... 13
N om en clature ... 14
1 In tro d u ctio n ... 17
1.1 Micro-fluidic Systems in Emerging Technologies ... 17
1.2 Background on HME Process Physics and Equipment ... 19
1.3 Manufacturing Cycle-to-Cycle Process Control in HME ... 22
1.4 T hesis S cope ... . 24
1.5 T hesis O utline ... . 25
1.6 Background on Micro-Scale Device Testing and Packaging ... 26
2 Statistical Analysis of Micro-Embossed Parts: First-Generation HME System... 28
2.1 Description of Tool and Parts ... 28
2.2 Effect of Measurement Resolution ... 29
2.3 Re-Measurement Using Higher Resolution Imaging... 31
2.4 C onclusions... 34
3 Design and Construction of the Second-Generation Hot Micro-Embossing (HME) H eat T ransfer S ystem ... 35
3.1 Background-First Generation HME System... 35
3.2 Second Generation HME Subsystems ... 37
3.3 Temperature Actuation Subsystem... 43
4 Micro-Part Metrology and Characterization... 90
4.1 Need for Micro-Part Characterization ... 90
4.2 Existing Metrology-Based Characterization Methods... 92
5 Overview of the Functional Testing System (FTS) Concept... 97
5.1 Role of Functional Testing in the Integrated Circuit (IC) Industry ... 97
5.2 FT S R equirem ents ... 102
5.3 FTS Preliminary Calculations and Sensitivity Analysis... 103
5.4 FTS Conceptual Design ... 109
5.5 Functional Test Part Tool Design ... 111
5.6 D escription of T est Parts... 115
6 Design of the Functional Testing System (FTS)... 117
6.1 FT S F luid C ircuit L ayout... 117
6.2 Specification and Selection of Major Components ... 118
6.3 Specification and Selection of Minor Components ... 123
6.4 Mechanical Design of the Functional Testing Platform (FTP)... 125
6.5 Microscope Imaging ... 138
7 Hardware Connections and LabView Control & Data Acquisition of the FTS ... 139
7.1 H ardw are C onnections... 139
7.2 L abV iew Program ... 140
8 F T S F luid M odel... 144
8.2 Channel M odel... 145
8.3 Entrance Effects and Flow Turn M odel... 146
8.4 Pressure H ead Constant ... 148
8.5 M odel Sum m ary... 149
9 Functional Test Results... 152
9.1 Prelim inary Tests ... 152
9.2 Re-registration Tests ... 159
9.3 M odel Fit Tests ... 164
10 H M E Characterization Tests... 168
10.1 First Series of Tests... 168
10.2 Second Series of Tests ... 172
11 Conclusions and Possible Future W ork on the FTS ... 179
11.1 Conclusions... 179
11.2 Future W ork ... 180
Appendix... 183
A H M E System Operation and U se M anual... 184
B M aterial Properties... 201
C Com ponent Specifications ... 210
D Fluid Flow M odel M ATLAB Code ... 217
E M iscellaneous...242
F FTS Billof M aterials ... 255
G Sum m ary of Functional H M E Parts... 256
H Sum m ary of Functional Test Runs ... 258
1 FTS M atlab Fluid M odel ... 261
J Functional Testing System (FTS) Operation and Use Manual... 270
List of Figures
Figure 1-1: A schematic of the HME process [10]... 20
Figure 1-2: Plot of the temperature and force profiles of a typical micro-embossing p ro cess [8 ... 2 1 Figure 1-3: General process control loops [13] ... 23
Figure 2-1: Close-up of silicon MIT tool used to fabricate parts on the first generation H M E system [24]... 28
Figure 2-2: Change in tool-part difference standard deviation with changes in scale and feature size [24]... . . 30
Figure 2-3: Plot of tool-part difference for feature 1 scale 1 [10] ... 31
Figure 2-4: AFM (a) and E-SEM (b) pictures of a Scale 6 part ... 32
Figure 2-5: Scale 6 width of the middle of the "I" for seven of the ten parts fabricated [10 ] ... 3 3 Figure 3-1: Close-up of the first generation HME system platens ... 36
Figure 3-2: Three-dimensional view of the full platen assembly [8]... 37
Figure 3-3: The full platen assem bly [8]... 38
Figure 3-4: The platen assembly without the vacuum chuck and with the top and bottom sp acer p lates ... 39
Figure 3-5: Vacuum pump and hose shown with vacuum chuck and barb ... 40
Figure 3-6: Instron 5869 load frame and computer controller... 41
Figure 3-7: Screen capture of the LabView interface used to control the HME system tem p eratu re ... 4 2 Figure 3-8: Thermal Control System Schematic [8]... 43
Figure 3-9: Photo of the Circulation Heater [8]... 45
Figure 3-10: Photo of the Maxchanger model MX-22 cold heat exchanger [8]... 45
Figure 3-11: Flow chart of the updated Matlab model ... 47
Figure 3-12: Photo of the mixing valve, actuator, and positioner [8]... 48
Figure 3-13: Typical centrifugal pump curve [32] ... 53
Figure 3-14: Typical positive displacement pump curve [34]... 54
Figure 3-15: Schematic of gear pump operation [35]... 55
Figure 3-16: Picture of the motor controller in the HME System [36]... 58
Figure 3-17: Heater Controller with Process and Over-temperature displays visible ... 61
Figure 3-18: Expansion tank diagram ... 62
Figure 3-19: Communication between the computer and system components ... 64
Figure 3-20: Pin assignment for the PCI 6208A [39]... 67
Figure 3-21: Bottom spacer plate with five thermocouple ports designed and machined by D irck x [8]... 6 8 Figure 3-22: Electrical circuit integrated with the level sensors... 70
Figure 3-23: Diagram of wire terminals on the motor controller [36]... 70
Figure 3-24: Relay circuit used to switch a +24V source to motor controller inputs... 72
Figure 3-25: Wiring terminals of the heater controller [40]... 74
Figure 3-26: Over-temperature terminal diagram [41]... 75
Figure 3-27: TC 2190 Thermocouple Inputs ... 76
Figure 3-29: 3D model showing approximate component locations and the Unistrut frame ... 8 2
Figure 3-30: Schematic of a single platen subcircuit in the system... 86
Figure 3-31: 3D Studio Max model of the proposed system layout ... 87
Figure 4-1: Diagram of an AFM cantilevered tip in contact with a sample and laser m onitored [44] ... 92
Figure 5-1: Overview of functional testing applied to IC manufacturing [48]... 98
Figure 5-2: Test structure to determine the thickness to the thickness of the Inter-layer Dielectric (ILD) by measuring the capacitance between the top metal plate and metal interconnects [47]... 99
Figure 5-3: Picture of a device interface board (a) and a socket adapter (b) [48] ... 100
Figure 5-4: Functional Testing method used in IC fabrication with Automated Test E quipm ent (A T E )... 10 1 Figure 5-5: Plot of the flow rate vs. channel width for all other parameters constant and an ideal water pressure source of P=23 psi... 108
Figure 5-6: Conceptual design of the FTS... 110
Figure 5-7: Copper platen used on the first generation HME system... 112
Figure 5-8: Schematic of the mask designed for the fabrication of DRIE silicon tools with close-up of a feature used in functional testing ... 114
Figure 6-1: FT S fluid circuit layout ... 117
Figure 6-2: Schematic of the operation of a peristaltic pump [53]... 119
Figure 6-3: Harvard Apparatus PHD 2000 infusion syringe pump ... 120
Figure 6-4: ACCULAB VIC-303 Mass balance and GENEQ Testo 625 Humidity/Temp S en so r... 12 1 Figure 6-5: 3D Instruments DTG-6000 Pressure Gauge ... 123
Figure 6-6: 140 ml syringe used for all testing with Luer-lock fitting ... 124
Figure 6-7: FT P V ersion 1 ... 127
Figure 6-8: FTP V ersion 1 schem atic ... 127
Figure 6-9: FT P V ersion 2 ... 128
Figure 6-10: FTP Version 2 (left) and FTP Version 3 (right)... 129
Figure 6-11: FTP V ersion 3 Schem atic ... 130
Figure 6-12: FTP Version 4 (channels drilled in the top support platform are visible).. 131
Figure 6-13: FTP V ersion 4 schem atic ... 131
Figure 6-14: Hardness rating of commonly found rubbers and plastics [54]... 133
Figure 6-15: Schematic of the FTP assembly with the two-layer sealing method ... 136
Figure 6-16: FTP Version 5 with part loaded and c-clamps with springs attached... 137
Figure 6-17: M -Series Labscope... 138
Figure 7-1: Schematic showing the hardware connections and data stream for the control and data acquisition of the syringe pump, mass scale, and pressure sensor ... 140
Figure 7-2: LabView Program for syringe pump control and pressure sensor and mass scale data acquisition ... 14 1 Figure 8-1: C urve fit for Contraction KL ... 148
Figure 8-2: Model terms for pressure vs. flow rate of FTS with a 200pm x 100pm micro-c h an n e l p art ... 15 0 Figure 8-3: Full Model of pressure vs. flow rate for FTS with a 200pm x 100[im
Figure 9-1: Sample plot of pressure vs. time for a 100pm x 100tm channel test part in F T P V ersion 5 ... 152 Figure 9-2: Sample plot of mass vs. time for a 100pm x 100tm channel test part in FTP
V ersio n 5 ... 15 3 Figure 9-3: Plot of mass vs. time for flow rate calibration ... 154 Figure 9-4: Plot of pressure vs. time for a 800ptm x 351tm part in FTP Version 4 for an
arbitrary flow rate to test the required claming force to seal the micro-channel .... 157 Figure 9-5: Re-registration error for 8001tm x 35ptm part ... 160 Figure 9-6: Re-registration error for 200ptm x 100 pm part ... 161 Figure 9-7: Schematic explaining the effect of gasket layer deformation on micro-channel aspect ratio (a) high aspect ratio and (b) low aspect ratio... 162 Figure 9-8: Microscope image of the alignment of the reservoir to the gasket layer and
flu id in let... 16 3 Figure 9-9: Re-registration error for 100ptm x 100 pxm part in FTP Versions 4 and 5 ... 164 Figure 9-10: Pressure vs. flow rate for 200 ftm x 100 ptm part tested in FTP Version 4
with model and measurement RMS uncertainty ... 165 Figure 9-11: Pressure vs. flow rate for 300 ptm x 50 /im part tested in FTP Version 4 with m o d el... 16 6 Figure 9-12: Pressure vs. flow rate for 800 p[m x 35 gm part tested in FTP Version 4 with
model and measurement RMS uncertainty ... 166 Figure 10-1: Central composite design parameters for the first set of HME
characterization tests... 169 Figure 10-2: Channel width for eight HME processing conditions (TEmbossing: TDe-embossing):
... ... ... ... .. ... 170 Figure 10-3: Picture of the broken tool reservoir... 171 Figure 10-4: Plot of FTS data for parts made before and after the tool broke... 172 Figure 10-5: 22 design parameters for the second set of HIME characterization tests .... 173 Figure 10-6: Summary (c) of the metrology (a) and FTS (b) data for the four parts from
th e 22 D O E ... 174 Figure 10-7: FTS experimental results versus model predictions based on metrology data
... .... . . . ... ... 175 Figure 10-8: Side by side image of the silicon tool (left) and part (1) (right) ... 176 Figure 10-9: Screen captures of channel defects along the length (constriction and
expansion defects show n)... 177 Figure 10-10: Model predicted pressure drop for channel width venturi contraction from
List of Tables
Table 2-1: Summary of six scale of features based on feature 4 dimension in Figure 2-129
Table 2-2: Zygo measurement resolution for scans at different scales... 30
Table 2-3: Summary of the AFM measurements of a series of seven parts ... 33
Table 3-1: General specifications for the Instron 5869 [27]... 41
Table 3-2: Pressure drops from preliminary model used to specify pump and mixing v alv e s ... 4 7 Table 3-3: Performance parameters of the Moore 760E Positioner ... 51
Table 3-4: List of analog inputs needed in the system... 65
Table 3-5: List of current outputs needed in the system... 65
Table 3-6: Properties of the SPST reed relay... 72
Table 3-7: Properties of the 2N2222 type transistor... 73
Table 3-8: Description of the thermocouples interfaced with the TC 2190 ... 77
Table 3-9: Pin Identification for the interface between the machine frame and computer stan d ... 7 8 Table 3-10: Pin identification for the interface between the circuit board and other term in als ... 80
Table 4-1: Summary of applications and limitations on existing surface metrology techniques [43]... . . 9 1 Table 5-1: Sample input values used for preliminary FTS calculations ... 104
Table 5-2: Summary of output values from the preliminary FTS calculations ... 105
Table 5-3: Sum m ary of parts m ade to date ... 116
Table 6-1: Summary of relevant specifications for the syringe pump... 120
Table 6-2: Summary of relevant specifications for the mass scale and humidity/temp se n so r ... 12 2 Table 6-3: Summary of relevant specifications for the pressure sensor ... 123
Table 6-4: Dimensions for FTP Version 4 fluid circuit ... 132
Table 6-5: Summary of all gasket layers tried on FTP Version 4 ... 135
Table 7-1: Parameters needed to establish LabView communication with FTS co m p on en ts ... 14 1 Table 8-1: Summary of fluid circuit from the syringe pump through the FTP to the mass sc a le ... 1 5 0 Table 9-1: Summary of distilled vs. dyed water tests... 155
Table 9-2: Force conditions shown in Figure 9 5 ... 157
Table 9-3: Summary of parts used for FTP Version 4 re-registration tests... 160 Table 9-4: Summary of model predictions for change in velocity, residence time, and
Reynolds number at 1.5 ml/min for a 200 pm x 100 Am test part loaded in FTP V ersio n 4 ... 16 7
Nomenclature
Symbol Description
aYlaa Sensitivity of the output of a process model to disturbances
aY/au Sensitivity of the output of a process to changes in the input
A Area or Amps
A2 Smaller area in contraction/expansion A, Larger area in contraction/expansion AC Alternating current
ADC Analog to Digital Conversion AFM Atomic Force Microscopy
ATE Automated Testing Equipment ATPG Automatic Test Pattern Generator
C Celsius
Cv Valve coefficient cfm Cubic Feet per Minute
CFD Computational Fluid Dynamics
cm Centimeter
COM Communications port CCD Central Composite Design
CRT Cathode Ray Tube
D Diameter
d Channel depth (equivalent to channel height) DIB Device Interface Board
DIN Deutsches Institut fur Normung DIO Digital 1/0
DOE Design of Experiments DRIE Deep Reactive Ion Etching DUT Device Under Test
E Elastic modulus
ESEM Environmental Scanning Electron Microscopy FTP Functional Testing Platform
FTS Functional Testing System
g Gram
GPM Gallons Per Minute
h Channel height (equivalent to channel depth) H Fluid head (feet)
HME Hot Micro-Embossing or Hot Micro-Embossed
HP Horsepower
Hz Hertz
IC Integrated Circuit 1/0 Input/Output
kN Kilonewton
ksi Thousand pounds per square inch
kW Kilowatt L Length 1 Liter 1o Initial length if Final length lbs Pounds M Mega mA Milliamps min Minute ml Milliliter mm Millimeter msec Millisecond
NEMA National Electrical Manufacturers Association NI National Instruments
nm Nanometer
NPSH Net Positive Suction Head NPN N-P-N doped bipolar transistor
NPT National Pipe Thread
N Newton
n Number of samples
Pa Pascal
P Pressure drop PC Personal Computer
PCI Peripheral Component Interconnect PDMS Polydimethylsiloxane
PIV Particle Image Velocimetry PMMA Poly(methyl methacrylate)
psi Pounds per Square Inch
Q
Volume flow rate R Fluidic Resistance R2 Correlation coefficientr Radius
Re Reynolds number %RH % Relative Humidity
RMS Root Mean Square RPM Revolutions Per Minute
S Sample standard deviation SCR Silicon Controlled Rectifier
sec Seconds
SEM Scanning Electron Microscopy SG Specific Gravity
SPST Single Pole-Single Throw STM Scanning Tunneling Microscopy
T Temperature t/ 2,n-l Student-t statistic
t Time
T9 Glass transition temperature TEFC Totally Enclosed Fan Cooled
TTL Transistor-Transistor Logic USB Universal Serial Bus
v Flow velocity
V Volts
VAC Volts Alternating Current VDC Volts Direct Current
W Watts
w Width
- Sample mean
Aa Disturbances to a process
AP1 Pressure drop across a fully open valve
AP2 Pressure drop across the rest of the system
Au Changes to the input of a process AY Changes in the output of a process
0 Degrees
0 Diameter
F, Elastic strain
C- Stress
p. Dynamic viscosity or micro
p, Population mean
CHAPTER
1
Introduction
1.1 Micro-fluidic Systems in Emerging Technologies
1.1.1 Technology Sectors and Growth Potential
The worldwide micro-fluidics market is currently -$2 Billion USD per year [1,2]. Though speculation on the growth rate of this industry varies vastly from one source to another, most sources place the compounded adjusted growth rate between 10.3% and 27.3% [1,3]. Micro-fluidics traditional application has been in printing. This is most commonly seen in inkjet printers. However, new applications in power systems, propellant free aerosols, electronics, and most importantly the life sciences field are driving aggressive growth [1,4].
Despite the vast applications in industrial and commercial products, the dominant growth market is the life sciences field in general and the pharmaceutical industry, medical technology, and bio-technology industries in particular [5]. The cost and time savings with the use of micro-fluidic devices in drug discovery and analysis and the potential for micro-fluidics based drug delivery are emerging at the same time the cost for drug discovery and health care are reaching unprecedented heights. An analysis by the Tufts Center for the Study of Drug Development estimated the average cost of drug development at $897 million USD [6].
Micro-fluidics can be broken into several markets within life sciences industry: High throughput screening; Genomics; Proteomics; cell analysis; and drug delivery [2]. High-throughput screening is the dominant application at present, however,
developments in surface chemistry and material choice are expanding to encompass more complex analyses such as Genomics and Proteomics [2].
1.1.2 Need for Manufacturing-Related Development
There has been great emphasis within industry and academia to move toward the use of polymeric materials in micro-fluidic devices [7]. Initial work with micro-fluidics in the early 1990's focused on the use of glass because of well established fabrication methods from the semiconductor industry [7]. However, the high cost and low flexibility of glass necessitated a shift to polymer-based devices. There are a range of polymers that are disposable, low cost, and biocompatible [7].
Until this time, most micro-scale processes focused on hard materials (silicon, quartz, etc). This shift in material choice drove development and characterization of processes to handle large scale production of polymer-based micro-devices. There are many processes that have been developed to attempt to meet this need: (1) Soft Lithography; (2) UV- Embossing; (3) Injection Molding; (4) Hot Micro-embossing (micro-Micro-embossing); etc [8]. However, micro-Micro-embossing, in particular, has shown great promise to potentially meet the need of fabricating low-cost high-volume nm-/-ym scale polymer-based micro-devices.
With this new toolbox of processes, several material choices arise. The demand for low cost, chemically resistant polymers that have the flexibility of surface
modification limits these options. Poly(methyl methacrylate)-PMMA, Poly-carbonate, Poly-ester, poly-styrene, Poly vinylchrolide, and silicones are some of the major options [7]. PMMA, also known as acrylic, is one of the most commonly used thermoplastics. The low cost and well established material properties make it a natural first choice.
However, other more exotic materials with unique thermal, mechanical, and optical properties are constantly under development.
A key element to successfully addressing the hot micro-embossing (HME) manufacturing issues for micro-fluidic devices is developing methods for adequate process characterization, optimization, and control in a production environment. Prior work by Lee et al [9] and Hardt et al [10] assessed the variability of micro-embossing machines by measuring output part features of various dimensions and further work by Hardt et al [11] and Bacon et al [12] characterized the micro-embossing process by establishing relationships between equipment input parameters and output part metrics. Continued development of these quantitative models is required for HME to transition from a research to production level commercial process.
1.2 Background on HME Process Physics and Equipment
HME of thermoplastic polymers, at its most basic level, is a process where
material is heated above its glass transition temperature (Tg), uni-axially pressed by a tool (with features inverse of those desired on the part), held for a certain time (hold time), and then released. According to the process taxonomy developed by Hardt [13], HME can be considered a Deformation>Parallel> (Thermal+Mechanical) process. Figure 1-I explains the basic steps common to any HME system.
- - -
--,~, A'fin
nn
mn
Heated Platen Patterned Tool Workpiece Heated Platen Deformation & Cooling Resulting PartFigure 1-1: A schematic of the HME process [10]
Though the basic principle of the process is rather straightforward, the details (time, temperature, force, extension, etc) of the processing conditions are extremely important to the quality of the output part. Figure 1-2 shows a plot of the temperature and force profiles of a typical HNME process as a function of time. The process has five major steps: (1) the material is heated above Tg (-100 'C for PMMA) to the embossing temperature; (2) a force is applied on the tool into the part blank; (3) the force and temperature are held; (4) the temperature is brought down below Tg to the de-embossing temperature under force; and (5) the force is released and the part is removed.
Temperature Einlmssing Temiperatuire De-Enbossing Iemperature Ambient Temperature --- -- / --- - --- -- --- -- --- - -- - - --Time
Figure 1-2: Plot of the temperature and force profiles of a typical micro-embossing process [8] The details (time, temperature, force, extension, etc) of the processing conditions seen at the part are extremely important to the quality of the output part. However, given the difficulty of measuring these quantities at the part itself, the material states are often controlled indirectly by controlling the equipment states. The ability of the equipment to accurately maintain mechanical (position, force, velocity) and thermal (temperature , uniformity, etc) states is critical. Therefore, equipment that is robust to disturbances and can ensure repeatable material states for a given set of controllable equipment states is needed. The basic components of a HME system include a press, tool, platens, heating and cooling elements, and a control system. Force/position actuation is typically either through a motor-lead screw assembly or hydraulics. Heating and cooling is typically electrical or fluid based.
Force
Emlbossi ng
Force
De-Embossing
1.3 Manufacturing Cycle-to-Cycle Process Control in HME
Given the demand for micro-fluidic devices and the increased focus on polymer-based HME parts described in Section 1.1, there is a need to address the manufacturing issues that this demand will raise. Making a few parts in the laboratory is much different than implementing a full scale manufacturing process to fabricate a thousand or even a million devices. Manufacturing requires a much more precise understanding of the process physics to implement effective control strategies to maximize the effectiveness of the process. This underlies the need to develop a thorough understanding of
manufacturing control in HME to identify, isolate, and reduce sources of process variation. Process variation can be represented by Equation 1-1.
AY= Aa+ Au
aa au
Equation 1-1 [14]
The change in the output parameter is AY. The change in the output is a function of the disturbance (Aa) and change in input parameters (Au) multiplied by their respective sensitivities (aY/aa and 8Y/u). An initial strategy is to reduce the magnitude of the disturbance or the processes sensitivity to that disturbance. This can be achieved with effective equipment design. The next step is to actively vary the input parameters to negate the effect of the disturbances on the output parameter. This is feedback control. Both methods should be applied to HME in a production environment.
Under ideal circumstances it would be preferable to control the output product parameters within cycle and not the equipment or material states. However, in-situ measurement of the functional performance or dimensions of a part during processing is extremely difficult. A way around this limitation is proposed by Hardt et al [13] in
Figure 1-3. The strategy involves six steps. Step one is to establish a first order relationship between equipment input parameters and output part metrics. Step one is also used to identify and reduce sources of noise [13]. Step two is to perform a statistical analysis of outputs with all equipment inputs held constant to assess the process variation [13]. Step three is to optimize equipment input parameters to minimize output variation and maximize the number of acceptable parts [13]. Step four is to implement closed-loop control of the equipment states [13]. Step five is to implement closed-loop control of the material states to help minimize the effects of material state/property variation [13].
Step six is to implement closed-loop cycle-to-cycle control of the output part metrics to minimize output variation and maximize the number of acceptable parts [13].
Desired Actual
Product Product
CONTROL EQUIPMENT MATERIAL
Equipment loop
Material loop
Product loop
Equipment Control: Material Control Product Control:
Forces, Strains Geometry
Velocities Stresses
Temperatures, Temperatures, Properties
Pressures, .. Pressures, ..
Figure 1-3: General process control loops [13]
An important part of the cycle-to-cycle control strategy is to establish output metrics on which to assess the variation of the process and design equipment that is robust to noise factors. These two points are the central work of this thesis as described in Section 1.4.
1.4 Thesis Scope
This work was supported by the Singapore-MIT Alliance and was carried out in the Manufacturing Process Control Laboratory (MPCL). The goal is in keeping with the larger objective of the MPCL to apply novel control strategies to manufacturing
processes. Moreover, this work directly addresses Task 2 (HIMIE equipment design) and Task 3 (metrology of HME micro-fluidic parts) of the Singapore-MIT Alliance
Manufacturing Systems and Technology Research Proposal [15].
There are two objectives to the work of which this thesis is a culmination. The primary objective was to explore and develop alternative methods of characterizing micro-fluidic parts. The difficulty in extracting metrology-based measurements of parts made on the first generation HME system in the MPCL (described in Chapter 2) drove the need for an alternative characterization method. The proposed method is a Functional Testing System (FTS) which will be used to observe bulk fluid properties to determine
the effect of HME processing parameters on output parts. The testing method involves flowing fluid through HME micro-channels and monitoring the variation in pressure between channels for a fixed flow rate of water. This work is a first step toward
investigating the viability of the functional testing concept for application in
micro-fluidics manufacturing process characterization and control. The technique will be assessed on its ability to detect differences in micro-channel geometry. This testing method will serve to both determine whether the fabricated channel is capable of flowing fluid (integral to its functionality) and also provide a quantitative bulk metric that can be used to assess HME process variation. The range, resolution, testing time, and sensitivity drawbacks of existing metrology techniques outlined in Chapter 4 warrant exploration
into new characterization methods. Functional testing for micro-fluidic manufacturing process characterization and control is a new research area for which there is currently no published work. However, the idea of using a functional metric to assess a process has been used in the IC industry (outlined in Section 5.1). The proposed method has
conceptual limitations in that it can detect whether there are defects of irregularities, but cannot detect their precise location along the channel. However, despite this limitation, adequate resolution and accuracy on commercially available pumps and pressure sensors for micro-fluidic testing (discussed in Section 5.3.2) suggest sufficient repeatability in the proposed FfS method that further exploration is warranted. The emphasis will be on HME PMMA parts. However, the technique is not necessarily limited to this material or fabrication method. The secondary objective of this thesis was the design and
construction of a hot-oil heat transfer system for a second generation HME system.
1.5 Thesis Outline
The analysis to support the need for both a new characterization method and new HME system are explained in Chapter 2. Chapter 3, co-authored with Shoji [28], outlines the design of the second generation HME system designed by Dirckx [8], Shoji [28] and the author. Chapter 4 gives an overview of the proposed functional testing concept and
an assessment of metrology techniques currently used to characterize micro-fluidic parts. Chapter 5 gives an overview of characterization methods used in the integrated circuit (IC) industry and outlines the requirements, preliminary calculations, sensitivity analysis, and conceptual design for the proposed FTS. Chapter 5 also describes the tooling
developed for the second generation HME system with Shoji [28] and Wang [61]. Chapter 6 outlines the design, component selection, and integration of the FTS. Chapter
7 describes the hardware connections and LabView program developed for control and data acquisition of the FTS components. Chapter 8 discusses the fluid model developed to predict the expected fluidic performance of parts tested in the FTS. Chapter 9 outlines the preliminary, re-registration, and model-fit tests run on the new FTS. Chapter 10 outlines the HME characterization tests used to compare the results of traditional metrology techniques with the FTS. Finally, Chapter 11 draws conclusions on the design, construction, and testing of the FTS and recommends future work that may further develop the concept of functional testing.
1.6 Background on Micro-Scale Device Testing and Packaging
Currently, there is no documented research on the use of functional performance metrics for process characterization, much less control of any micro-fluidics
manufacturing process. However, other techniques using fluid flow to characterize channel geometry such as PIV (described in Section 4.2.6) are under development [16]. There is limited research on micro-fluidic testing and packaging which are essential to a designing and implementing a FTS. The need driving packaging research is the difficulty in flexibly integrating the micro-scale parts with large scale machinery and equipment. Moreover, it has been noted that packaging can account to up to 80% of the cost of a Micro-Electro-Mechanical Systems (MEMS) devices, of which micro-fluidics are a
subset [17]. Work by Valentine [17] uses a sandwiching technique to seal off open PDMS channels and provide fluid 1/0. Work by Tsai et al [18] uses Mylar polymer sealant in a layer deposition process to seal off capillary tubes connected to the fluid 1/0. Work by Fredrickson et al [19] uses a surface micro-machined locking connector that expands when a tube is inserted to seal against a support platform which in turn directs
fluid to the part. More integrated products have been designed by Han et al [20], which have both electrical and fluid 1/0. The options for macro-micro connectors range from modular to device specific and permanent (on-chip) to removable. However, the unique design of all micro-fluidic devices and the lack of any standards does not allow for a one solution fits all approach.
Most testing of micro-fluidic devices has focused on qualitative assessments of functionality. However, some groups have begun to quantify micro-fluidic performance for the purposes of validating models and determining the effect of geometry on flow
characteristics. Lee et al [21] gathered pressure and flow rate data for nitrogen run through surface micro-machined micro-fluidic parts to assess the effect of constrictions on flow separation. Work by Chang et al [22] (blood) and Eason et al [23] (water) has focused on gathering pressure and flow rate data to validate CFD and analytical micro-scale fluid flow models. This fluid testing, however, has been carried out on hard materials, not polymer-based devices. However, the techniques, testing setup, and models generated by these groups lay the ground work for further development of functional fluidic testing as a characterization tool for manufacturing control.
CHAPTER
2
Statistical Analysis of Micro-Embossed
Parts: First-Generation HME System
2.1 Description of Tool and Parts
Ganesan [24] added significant work to the body of hot micro-embossing (HME) research by designing and constructing the first generation HME system described in depth in Section 3.1. Ganesan [24] fabricated several Poly(methyl methacrylate)-PMMA parts on this system to assess HMNE process variation with constant equipment input parameters. Figure 2-1 shows a sample tool and Table 2-1 outlines the six scales of tools that are on the etched silicon die based on the width of the feature 4 dimension. The tool had recessed features (-0.9 gm), so the parts made from this tool had raised features.
Figure 2-1: Close-up of silicon MIT tool used to fabricate parts on the first generation HME system [24]
Table 2-1: Summary of six scale of features based on feature 4 dimension in Figure 2-1
Scale Feature 4 Dimension (tm)
1 170 2 89 3 44 4 24 5 13 6 4
2.2
Effect of Measurement Resolution
Ganesan [24] measured the parts on a Zygo NewView Model 5000 Optical Interferometer (theory of operation described in Section 4.2.3). Scales 1-5 were measured because it was difficult to image the very small Scale 6 features in the Zygo. He concluded that there was: (1) an increase in mean and standard deviation of the die-part difference with increasing scale size; and (2) data to support process variation. However, further inspection of the instrumentation used to gather this data with Shoji [28] revealed that the change in the mean and standard deviation of die-part difference from scale-to-scale and feature-to-feature cannot be relied upon given the inherent measurement error from the Zygo. Figure 2-2 below shows the change observed in the standard deviation of the die-part difference for varying scales and features. Table 2-2 shows the change in resolution of the Zygo with scale size. Given the resolution of the Zygo, the observed changes in standard deviation and similarly mean are washed out. The differences are just as likely to be scale dependent measurement noise as evidence of a process trend. Moreover, Figure 2-3 shows a process run for Scale I feature I
measurements with the measurement resolution error bars of ±1.1
sm
included. What appears to be process variation cannot be verified because of the large measurement error embedded in the data.4.0 -3.5 -3.0 -2.5 --2.0 -C/) - 1.5- 1.0-0.5 -0.0 ---- Feature 1 ---- Feature 2 ....A- Feature 3 -r-- Feature 4 ~-+--Feature 5 Scale 2 Scale 4 -AI --- ---- - -- - ---:Scale 5 Scale 3 A Scale 1 1 2 3 4 5 6 7 8 9 10 11 12 13
Relative Feature Scale Size (Using Smallest scale(5) as a unit) Where S dp stands for Standard Deviation Die-part difference (Left) in microns
Figure 2-2: Change in tool-part difference standard deviation with changes in scale and feature size [24]
Table 2-2: Zygo measurement resolution for scans at different scales
Scale Nominal Width (/xm) Horizontal Resolution (tm) Scan Range
1 170 2.2 1.43 mm x 1.07 mm 2 89 2.2 1.43 mm x 1.07 mm 3 44 0.85 0.45 mm x 0.34 mm 4 24 0.85 0.27 mm x 0.20 mm 5 13 0.85 0.18 mm x 0.13 mm 6 4 Not measured 0.18 mm x 0.l3mm
7
E
4 Q t 0 0-1 2 3 4 5 6 7 8 9 10 11 12 Run NumberFigure 2-3: Plot of tool-part difference for feature 1 scale 1 [10]
2.3 Re-Measurement Using Higher Resolution Imaging
In order to quantitatively establish if there is process variation (and to what extent) in the first generation HME system, a higher resolution surface imaging technique was used. Atomic Force Microscopy (AFM) measurements were taken on a Quesant
Q-Scope Model 250 (theory of operation described in Section 4.2.1). AFM scans were taken of the Scale 6 parts and ten interpolations were performed on the width of the letter "I" as seen in Figure 2-4 (with the assistance of Dan Bums). An E-SEM (theory of operation described in Section 4.2.5) scan using a Phillips/ FEI XL30 FEG-SEM was taken to corroborate that the images from the AFM were indicative of the part geometry and not an artifact of the AFM measurement technique. Three parts were not included in the analysis because they had air bubbles. The data set of seven parts was analyzed to
determine whether the variation in the measurements from part-to-part was dominated by measurement or process variation.
Figure 2-4: AFM (a) and E-SEM (b) pictures of a Scale 6 part
The resolution of the AFM for these scans was 60 nm. The RMS uncertainty was calculated by combining the bias error introduced by the AFM~1/2* measurement
resolution = 30 nm with the precision error (90% confidence student-t interval with degrees of freedom = 9) of the ten interpolations of the feature [25,26]. An interpolation is the act of re-measuring the AFM scan multiple times using the software provided by the manufacturer. This resulted in an overall RMS uncertainty error on the measurement
of 0.031-0.050 pm depending on the interpolation errors for each part. Figure 2-5 shows the high level of variation of the width of the letter "I" with run number. The RMS uncertainty is shown on the plot. Unlike the case of the Zygo data, the uncertainty is much smaller than the observed process variation.
4.8- 4.6- 4.4-E 4.2-E4. 0 3.6- 3.4-3.2 I I 1 2 3 4 5 6 7 Run Number
Figure 2-5: Scale 6 width of the middle of the "I" for seven of the ten parts fabricated [10]
The summary of the AFM measurements taken is shown in Table 2-3. The coefficient of variance of the HME process for the fabrication of these features under identical equipment input conditions is -12.6 %.
Table 2-3: Summary of the AFM measurements of a series of seven parts
I
~Standard
7Overall
RMS
Measuremen Average . Coefficient of Range Unerainty
t Location (jIm) Deviation Variance (%) (Utm)
(am) (/Lm)
There may be several causes for this high variance, however, the inability of the HME system to properly control equipment input parameters (de-embossing temperature,
cooling rate, etc), the high level of noise, and the variability in material properties are the most likely causes.
2.4 Conclusions
Based on these results, two actions were warranted. First, a second generation HME system to reduce the sensitivity of the machine to noise factors and have more precise control of process parameters was needed. Moreover, added flexibility in terms of part size and tooling could be added in this re-design. This re-design was carried out by Dirckx [8] and the design and construction of the heat transfer for this new system was completed by Shoji [28] and the author (outlined in Chapter 3). Second, an exploration of alternative techniques to reliably detect HIME process variation was needed. Given the inherent difficulty in obtaining measurements at this scale (with the precision necessary to obtain statistically significant data), alternative methods of understanding the
relationship between IME equipment input parameters and output part characteristics had to be investigated. Functional testing (outlined in Chapter 5) was one proposed method to help characterize micro-fluidic parts and provide feedback on the process performance.
CHAPTER
3
Design and Construction of the
Second-Generation Hot Micro-Embossing (HME) Heat
Transfer System
This Chapter and all associated Appendices were co-authored with Shoji [28]. A statistical analysis of parts fabricated on the first generation HIME system (described in Chapter 2) was the basis for the design of a second generation HME system described in the following subsections.
3.1 Background-First Generation HME System
The first generation HME system built in the Manufacturing Process Control Laboratory (MPCL) by Ganesan [24] has four main subsystems: (1) force and position
actuation; (2) platens; (3) temperature actuation; and (4) control. An Instron model 5869 load frame provided force and position actuation. The platens, used to hold the work piece and tool, are made of copper. The platens are heated with two 200W cartridge heaters and cooled by running city water and/or pressurized air through tubing connected to the platens. The temperature is monitored by two thermocouples (one each in the top and bottom platen) and controlled with Chromalox 2110 controllers and the Instron is controlled with a hardware controller via its proprietary FastTrack and Merlin software's. See Figure 3-1 for a close-up of the platen assembly.
Figure 3-1: Close-up of the first generation HME system platens
The maximum force capacity is 50kN and temperatures up to 300'C are possible [8]. The Instron crosshead has a resolution of 0.0625 [im and can be controlled to speeds from 0.001 mm/min to 500 mm/min [27]. Typical heating time from ambient to 130'C is
15 minutes and cooling time back to ambient is 5 minutes [8]. The largest work piece that could be embossed was on the order of 40-45 mm [8]. Both copper and silicon tools can be used with this system.
The system has three main drawbacks: (1) large thermal mass and the resulting slow thermal cycle time; (2) limited control of key processing parameters; and (3) limited to small part sizes. These drawbacks led to a second generation HME system, designed by Dirckx [8], a graduate student in the MPCL.
3.2 Second Generation HME Subsystems
3.2.1 Platen Subsystem
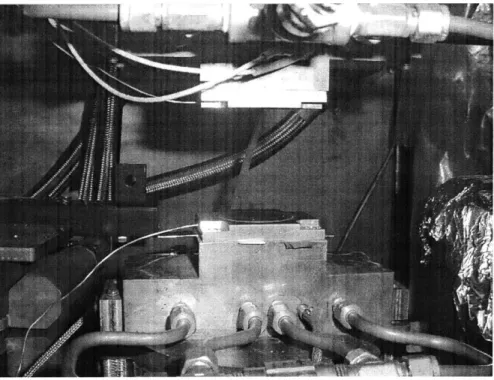
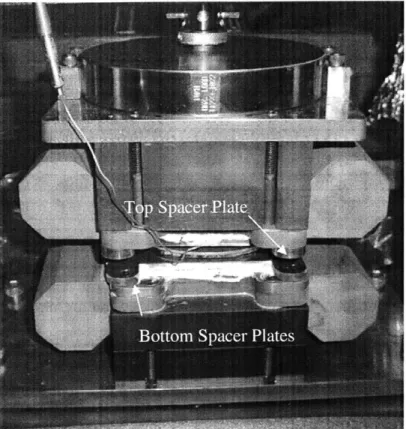
Dirckx [8] designed and machined the platen subsystem, one of the three subsystems that underwent major changes. The main objectives of this platen design were to: (1) increase the work piece area to 100mm diameter; (2) accommodate a thermal-oil heat transfer system for rapid and uniform heating; and (3) provide more reliable platen alignment and flexible tool and work piece fixturing. Figure 3-2 to Figure 3-4 shows the various pieces in the platen assembly. For further details on the platen
subsystem design and fabrication refer to Dirckx's SM thesis: Design of a Fast
Cycle-Time Hot Micro-Embossing Machine [8].
T
Figure 3-3: The full platen assembly [8]
Three major changes were made to the platen subsystem after initial construction. Omegatherm thermally conductive silicone paste Model OT-201 (Appendix B.1) was placed between the top platen and top spacer plate and between the bottom spacer plate and additional bottom spacer plate. This reduced the thermal resistance by eliminating the air gap between layers. Given difficulties with de-embossing using a silicon tool, Wang [61], a graduate student in the MPCL, designed a top spacer plate that could be used to affix copper tools. This plate is also needed when embossing a part with an unsecured silicon tool to keep the top and bottom manifolds from contacting one another prior to forming the part (see Figure 3-4). A vacuum pump to integrate with the vacuum chuck was also added.
Figure 3-4: The platen assembly without the vacuum chuck and with the top and bottom spacer plates
A vacuum pump was needed to apply a holding force on the tool in contact with the vacuum chuck. The suction force on the tool is proportional to the vacuum level of the pump. The theoretical limitation of any vacuum pump is 0 Torr (pure vacuum). No pump is capable of achieving this; however, several turbo molecular pumps can achieve 1010 Torr. The objective is to maximize holding force, thus there is no need for a high vacuum pump, which would add unreasonable cost with minimal (fractions of a Torr) benefit. Therefore, the focus was on vacuum pumps with -99% vacuum.
The important parameters to consider when specifying the vacuum pump are: (1) absolute pressure; (2) flow rate; (3) pump speed; (4) weight; (5) dimensions; (6) noise level; and (6) power requirements.
The most suitable vacuum pump for small volume evacuation is a roughing single-stage rotary vane pump. Other pumps offer higher vacuum but at much higher costs with negligible improvement in holding force. The rotary vane pump is the most common and economical mechanical pump for the transport of clean, dry, non-reactive gases, such as air. Oil lubrication, as opposed to dry lubrication, is recommended for a longer life and lower initial cost.
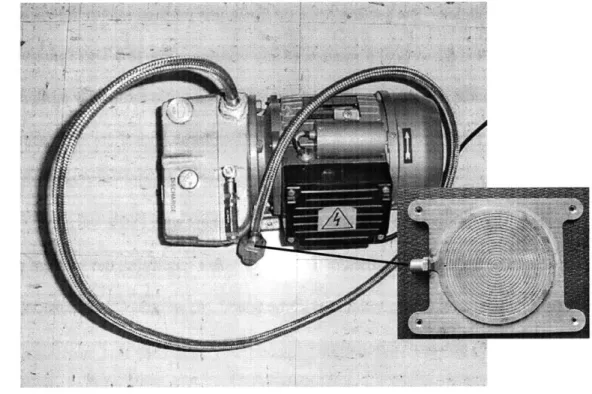
A 0.5HP Kinney-Tuthill KVO-5 capable of 3.1 cfm and an absolute pressure of
7.5 Torr was chosen because it met the aforementioned requirements at the most reasonable cost. The pump was wired to a switch mounted on the computer stand. A flexible stainless steel hose connects the vacuum pump to a brass barb epoxied with Duralco 4461 to the vacuum chuck (Figure 3-5). For further detail, see the vacuum pump user manual.
3.2.2 Force and Position Actuation Subsystem
The force and position actuation subsystem did not change from the first to the second generation HNME system. The parameters for the Instron 5869 (Figure 3-6) shown in Table 3-1 are sufficient for the demands of the new 100 mm system. Refer to the Instron 5869 manual for further detail.
Figure 3-6: Instron 5869 load frame and computer controller Table 3-1: General specifications for the Instron 5869 [27]
Load Maximum Minimum Force Force Position Position
Rating Speed Speed Accuracy Resolution Accuracy Resolution
500 0.001 0.02 mm or
50kN mm/min mm/min 0.4 -0.5% 0.001 N 0.05% 0.0625 pm
3.2.3 Temperature Actuation Subsystem
The temperature actuation subsystem is the second of three subsystems that
underwent major changes. The thermal-oil heat transfer subsystem was designed by
Dirckx [8] and integrated and constructed by the Shoji [28] and the author. This
NE ii * iiii
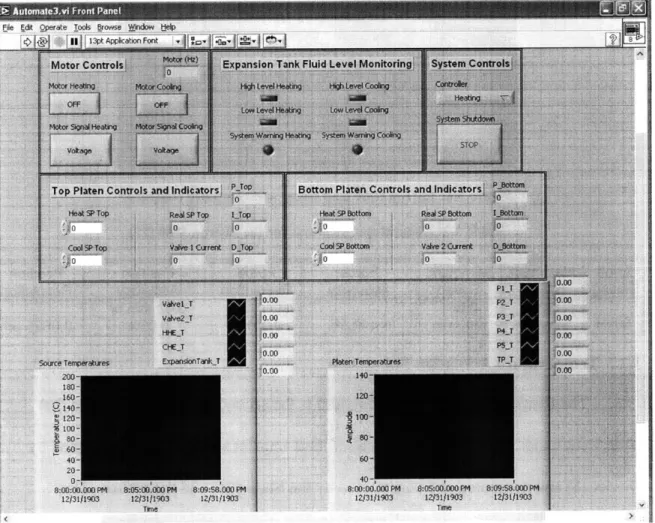
3.2.4 Software Control Subsystem
The third subsystem to undergo major changes was the control subsystem. The first generation HME system relied on hardware controllers to reach the desired platen temperature. Given the major changes in temperature actuation, Shoji [28] developed a new software program in LabView. Force and position are still controlled with the Instron hardware via its proprietary FastTrack and Merlin software's. For further details, refer to Grant Shoji's SM thesis: Modeling and Control of a Hot Micro-Embossing
Machine [28]. Figure 3-7 is a screen capture of the new user interface used to control the
system temperature.
3.3 Temperature Actuation Subsystem
3.3.1 Overview of the Temperature Actuation System
The temperature actuation system designed by Dirckx [8] utilizes heat transfer fluid flowing through mixing valves, heat exchangers, and a pump to command a certain temperature of a platen assembly. A layout of the system is shown in Figure 3-8.
Expansion
Ta nk
Top
Platen
Bottom
...-....
Platen.
Mixing.
Valves,
Heat
Source
Pump
Heat
Sink
Figure 3-8: Thermal Control System Schematic [8]
Thermal fluid is pumped through a hot and cold heat exchanger. The resulting flows out of the heat exchangers are split and the hot and cold streams of fluid combine in a mixing valve. This fluid is then circulated through a copper platen assembly, which is used to heat and cool a tool and polymer work piece. The fluid is then re-circulated and the process repeats itself.
3.3.2 Heat Transfer Fluid
A heat transfer fluid for the thermal system was selected based on good thermal properties, chemical and thermal stability in air, and non-toxicity. Dirckx [8] chose Paratherm MR, a paraffinic hydrocarbon oil, to be the working fluid. It has low
viscosity, relatively high thermal conductivity, and a boiling point much higher than the system's maximum temperature. Other favorable characteristics of the fluid are low toxicity, low odor, and stability in air. The last point enables the fluid to be used in a non-pressurized system. A complete list of Paratherm MR fluid properties can be found in Appendix B.2. Consult Dirckx [8] for a more detailed explanation of the fluid
selection.
3.3.3 Hot Heat Exchanger
The hot heat exchanger selected by Dirckx [8] is a 30 kW circulation heater from Vulcan Electric Company (Figure 3-9). Internal to the heater are 18 U-tube heater elements enclosed within a 44" long and 8" diameter chamber. There are also baffles located in the heater to induce turbulence. A thorough explanation regarding the selection of this heater can be found in Dirckx [8]. A specifications drawing of the hot heat exchanger is in Appendix C.1.
Figure 3-9: Photo of the Circulation Heater [8]
3.3.4 Cold Heat Exchanger
The cold heat exchanger selected by Dirckx [8] is a plate and frame MaxChanger model MX-22 from Tranter PHE (Figure 3-10). This is a counter-flow heat exchanger with city water flowing in one direction and oil flowing in the other direction. A more detailed explanation behind the selection of this model can be found in Dirckx [8]. A specifications drawing of the cold heat exchanger is in Appendix C.2.
Figure 3-10: Photo of the Maxchanger model MX-22 cold heat exchanger [8]
3.3.5 Fluid Flow Model
In order to specify the requirements on the major components of the system, a preliminary model was developed to approximate the thermal-fluid properties.
According to ANSYS simulations by Dirckx [8], the system requires a flow rate of 40
GPM and a temperature to T=200'C. The specified operating temperature range, however, is room temperature to 180'C. Each major component in the system was modeled in Matlab and the three key variables (pressure, flow rate, and temperature) are passed from one component to the next to find the pressure drop in the whole system for a desired platen temperature. This pressure drop was needed to select both the pump and the mixing valves. The model operates on the following assumptions:
1. Constant flow rate pump
2. The hot/cold heat exchangers and platens are the only sites for heat transfer 3. Estimated pipe length is 21 feet with a diameter of 1.5 inches
4. Pressure drop is considered in piping, cold/hot heat exchangers, and platens The pressure drop in the platens was found by curve fitting data from Dirckx's [8] ANSYS simulations. The pressure drop in the cold heat exchanger was obtained from manufacturer's data and the pressure drop in the hot heat exchanger was calculated based on dimensional specifications obtained from the manufacturer. From this model, the required pressure drop in the mixing valve was calculated and then the pump was specified. The model was run for desired platen temperatures of T=30'C and T=1790C. Table 3-2 shows the estimated pressure drop in the system for these two temperatures. As expected, the pressure drop is lower for the high temperature simulation because of the lower viscosity of the Paratherm MR and lower pressure drop through the heating subcircuit compared to the cooling subcircuit.
Table 3-2: Pressure drops from preliminary model used to specify pump and mixing valves
Temperature System pressure drop-Valves
300C 30.0 psi
1790C 13.7 psi
As construction progressed, the Matlab model was modified to include the
pressure drop in the: (1) Y-strainer; (2) an updated platen model; (3) flow meters; and (4) more accurate lengths, diameters, and fittings of pipe. This model was used to select pipe lengths and diameters to try to minimize the pressure drop of the system. Figure 3-11 shows the flowchart behind this model. Minor pipe losses and fittings between the major components were also included in the model. Appendix D outlines the subsections and equations used to generate this model.
Flow Chart of Matlab Model (Passing Pressure, Flowrate, and Temperature)
Mixing Valve 1 Flowmeter 1 Platen 1
Mixing Valve 2 N Flowmeter 2 -- lten 2
PipeTSeparate2 E o Hat - Cold Heat PipeTSeparate2 _ Exchanger PipeTCombinel PipeTSeparatel Y-Strainer Pump
3.3.6 Mixing Valve Assembly
The mixing valve assembly consists of a mixing valve, actuator, and positioner. A photo of the mixing valve assembly is shown in Figure 3-12. The selection and sizing of these components are described in the following sections. A specification chart is listed in Appendix C.2.
Figure 3-12: Photo of the mixing valve, actuator, and positioner [8]
3.3.6.1. Mixing Valve
An initial design consideration for the control element in the thermal system involved using four individual globe style valves to mix hot and cold fluid streams to heat up two individual platens. This particular design allows flexible control of the flow rates through the platens. However, simulating and controlling the system with four valves can be quite complicated. A simpler way to control the fluid temperature is to use two mixing valves. One of the downsides to using mixing valves is little to no flexibility with
![Figure 1-2: Plot of the temperature and force profiles of a typical micro-embossing process [8]](https://thumb-eu.123doks.com/thumbv2/123doknet/14684994.560011/21.918.135.771.102.440/figure-plot-temperature-force-profiles-typical-embossing-process.webp)
![Figure 2-1: Close-up of silicon MIT tool used to fabricate parts on the first generation HME system [24]](https://thumb-eu.123doks.com/thumbv2/123doknet/14684994.560011/28.918.225.729.644.1020/figure-close-silicon-mit-tool-fabricate-parts-generation.webp)
![Figure 2-2: Change in tool-part difference standard deviation with changes in scale and feature size [24]](https://thumb-eu.123doks.com/thumbv2/123doknet/14684994.560011/30.918.150.793.112.560/figure-change-difference-standard-deviation-changes-scale-feature.webp)
![Figure 2-5: Scale 6 width of the middle of the "I" for seven of the ten parts fabricated [10]](https://thumb-eu.123doks.com/thumbv2/123doknet/14684994.560011/33.918.149.753.297.701/figure-scale-width-middle-i-seven-parts-fabricated.webp)
![Figure 3-6: Instron 5869 load frame and computer controller Table 3-1: General specifications for the Instron 5869 [27]](https://thumb-eu.123doks.com/thumbv2/123doknet/14684994.560011/41.918.258.659.329.669/figure-instron-computer-controller-table-general-specifications-instron.webp)
![Figure 3-16: Picture of the motor controller in the HME System [36]](https://thumb-eu.123doks.com/thumbv2/123doknet/14684994.560011/58.918.199.797.106.538/figure-picture-motor-controller-hme.webp)
