HAL Id: hal-01524099
https://hal.archives-ouvertes.fr/hal-01524099
Submitted on 17 May 2017HAL is a multi-disciplinary open access archive for the deposit and dissemination of sci-entific research documents, whether they are pub-lished or not. The documents may come from teaching and research institutions in France or abroad, or from public or private research centers.
L’archive ouverte pluridisciplinaire HAL, est destinée au dépôt et à la diffusion de documents scientifiques de niveau recherche, publiés ou non, émanant des établissements d’enseignement et de recherche français ou étrangers, des laboratoires publics ou privés.
What stoichiometries determined by mass spectrometry
reveal about the ligand binding mode to G-quadruplex
nucleic acids
Michael Lecours, Adrien Marchand, Ahdia Anwar, Corinne Guetta, W.
Hopkins, Valérie Gabelica
To cite this version:
Michael Lecours, Adrien Marchand, Ahdia Anwar, Corinne Guetta, W. Hopkins, et al.. What stoichiometries determined by mass spectrometry reveal about the ligand binding mode to G-quadruplex nucleic acids. Biochimica et Biophysica Acta (BBA) - General Subjects, Elsevier, 2017, �10.1016/j.bbagen.2017.01.010�. �hal-01524099�
This is the final author version (accepted manuscript) of an article published in Biochimica et Biophysica Acta (BBA) - General Subjects (http://dx.doi.org/10.1016/j.bbagen.2017.01.010). © 2017. This manuscript version is made available under the CC-BY-NC-ND 4.0 license http://creativecommons.org/licenses/by-nc-nd/4.0/
What stoichiometries determined by mass spectrometry reveal about
the ligand binding mode to G-quadruplex nucleic acids
Michael J. Lecours,1 Adrien Marchand,2 Ahdia Anwar,1 Corinne Guetta,3 W. Scott Hopkins,1 and
Valérie Gabelica2,*
1 Department of Chemistry, University of Waterloo, Waterloo, ON, Canada, N2L 3G1 2 INSERM, CNRS, Université de Bordeaux, Laboratoire Acides Nucléiques : Régulations
Naturelle et Artificielle (ARNA, U1212, UMR5320), IECB, 2 rue Robert Escarpit, 33607 Pessac, France.
3 Institut Curie, CNRS, INSERM, Univ. Paris Sud, Laboratoire de Chimie, modélisation et
imagerie pour la biologie (CMIB, U1196, UMR9187), Orsay, France.
ABSTRACT: G-quadruplexes (G4s) have become important drug targets to regulate gene
expression and telomere maintenance. Many studies on G4 ligand binding focus on determining the ligand binding affinities and selectivities. Ligands, however, can also affect the G4 conformation. Here we explain how to use electrospray ionization mass spectrometry (ESI-MS) to monitor simultaneously ligand binding and cation binding stoichiometries. The changes in potassium binding stoichiometry upon ligand binding hint at ligand-induced conformational changes involving a modification of the number of G-quartets. We investigated the interaction of three quadruplex ligands (PhenDC3, 360A and Pyridostatin) with a variety of G4s. Electrospray mass spectrometry makes it easy to detect K+ displacement (interpreted as quartet disruption) upon
ligand binding, and to determine how many ligand molecules must be bound for the quartet opening to occur. The reasons for ligand-induced conversion to antiparallel structures with fewer quartets are discussed. Conversely, K+ intake (hence quartet formation) was detected upon ligand
binding to G-rich sequences that did not form quadruplexes in 1 mM K+ alone. This demonstrates
the value of mass spectrometry for assessing not only ligand binding, but also ligand-induced rearrangements in the target sequence.
KEYWORDS: G-quadruplex, mass spectrometry, ligand, structural changes, PhenDC3, 360A, Pyridostatin, Conformation, ligand-induced isomerization
1. INTRODUCTION
Guanine-rich nucleic acids can form G-quadruplex (G4s) structures by the stacking of two or more G-quartets (tetrads).1 G-quadruplex structures are stabilized by hydrogen bonds between the
guanines of a G-quartet, and by the intercalation of cations such as potassium (K+) between the
stacked G-quartets. G4 structures prevail in important regions of the human genome such as telomeres, oncogene promoters and transcription start sites,2 and have become potential
anti-cancer drug targets.3
G4s exhibit diverse structures. The topologies depend on many factors: the number of strands (intramolecular, bimolecular or tetramolecular G4s), the number of nucleobases in the strand, nucleobase orientation (syn or anti) in the G-quadruplex core, and the way the loops connect the G-tracts. Moreover, some sequences are polymorphic: they can form multiple topologies depending on the environmental conditions. For example, human telomeric sequences,4 consisting
of TAGGGT repeats, can form antiparallel G4s in sodium-containing solution conditions, and hybrid G4s in potassium-containing solutions.5,6,7 Owing to their high of degree structural
polymorphism, G4s can also be used in switchable nanodevices.1,8,9
At least four potential G4 ligand binding modes can be distinguished: intercalation, groove binding, loop binding, and stacking on external G-quartets. But although in principle one could design ligands that would be selective for a specific G4 structure, most ligands reported to date comprise large aromatic planes and hence bind mainly to external G-quartets.10,11 As a result,
ligand inter-G4 selectivity has not been well explored. Only a few examples G4-selective ligands have been reported, e.g., the ligand NMM, which binds preferentially to parallel structures.12
Ligand binding can also induce conformational switching in polymorphic sequences. For example, the human telomeric G4 structures convert to more hybrid G-quadruplexes when bound to the TMPyP4 ligand,13 or to antiparallel structures when bound to Cu-tolylterpyridine.14 We have
previously shown that the human telomeric G4 structures change to antiparallel geometries with one K+, therefore containing presumably two G-quartets,15 upon binding of ligands 360A16,17,
dichroism, and the cation binding stoichiometry was determined by electrospray ionization mass spectrometry (ESI-MS). Because these first results revealed intriguing properties for these three ligands, which are among the most widely used in the community, we decided to expand our ESI-MS study of PhenDC3, 360A and PDS to many more G-rich sequences. We report here several types of conformational changes that can be easily inferred from the mass spectra, based on the detected changes in K+ stoichiometries upon ligand binding. The existence of these structural
changes in solution is validated by circular dichroism (CD) spectroscopy.
2. Materials and Methods 2.1 Materials
Oligonucleotides were purchased from Eurogentec (Seraing, Belgium) in reverse-phase purified lyophilized form (RP cartridge-Gold quality). Solutions were prepared in nuclease-free water (Ambion, Life technologies SAS, Saint-Aubin, France). Table 1 includes the short name and sequence for the oligonucleotides used in this work.
2.2 Solution Preparation
Concentrations of stock solutions in H2O were measured by UV absorption at 260 nm on a Uvikon
XS. Molar absorption coefficients were obtained from the IDT Website using the Cavaluzzi-Borer correction.33 Stock solutions were then diluted to 50-200 µM of single-stranded DNA in 100 mM
trimethylammonium acetate (TMAA, Ultra for HPLC, Fluka analytical), and 1 mM of potassium chloride was added (>99.999%, Sigma). Intramolecular G4s were allowed to fold for at least 18 hours. Bimolecular and tetramolecular G4s were allowed one week to fold at 200 µM single strand. Solutions of intramolecular and bimolecular quadruplexes were prepared at 10 µM quadruplex concentrations in a 1:1 ligand to G4 equivalents, while [TG4T]4 was prepared at 5 µM of G4 (20
µM single strand) and analyzed at 2:1 ligand to G4 concentrations. Solutions were stored in a fridge at 4°C for the duration of the screening preparation, and were allowed to remain overnight with the ligand before injection. Solutions for CD were prepared at 5 µM of G4 and up to 15 µM of ligand.
Table 1. Oligonucleotide sequences used in this screening, where available articles containing
NMR structures of these sequences have been referenced.
Anticipated Structure Short Name DNA Sequence 5' to 3' Intramolecular
Parallel G4s
222T8 TGGGTTGGGTTGGGTTGGGT
Pu2420 TGAG3TG3GAG3TG4A2G2
26CEB21 A2G3TG3TGTA2GTGTG3TG3T Bulge-TB122 TTGTGGTGGGTGGGTGGGT Intramolecular Telomeric G4s 22GT23 (GGGTTA)3GGGT 22CTA24 A(GGGCTA) 3GGG 22AG A(GGGTTA)3GGG 23TAG25 TA(GGGTTA)3GGG 23AG26 A(GGGTTA) 3GGGT 24TTG27 TT(GGGTTA)3GGGA 25TAG25 TA(GGGTTA)3GGGTT Bimolecular G4s [G3T4G4]228 2 × GGGTTTTGGGG [G4T4G3]228 2 × GGGGTTTTGGG [G4T4G4]229,30 2 × GGGGTTTTGGGG [G4T3G4]230 2 × GGGGTTTGGGG [12TAG]231 2 × TAGGGTTAGGGT Tetra-molecular G4 [TG4T]432 4 × TGGGGT Artificial sequences classified by G4Hunter scores 22non10515 G3ATGCGACAGAGAGGACG3
23non10015 TG3ATGCGACAGAGAG2ACG3
24non09615 TG3ATGCGACAGAGAG2ACG3A
26non08815 T2G3ATGCGACAGAGAG2ACG3AT
22non059 TGCGAGCGAGAGAGGAGCGAGG 22non068 TGGCGAGCGAGAGAGGACGAGG 22non077 TGCGAGCAGGAGAGGACGGAGG 22non086 TGGCGAGACAGAGAGGAGCGGG 22non095 TGCGACAGGAGGAGGGACGAGG 22non105b TGCGACGAAGAGGAGGGACGGG 22non114 TGCGACAGGGAGGGAGGACGGG 22non123 TGCGGGACAAGAGAGGGACGGG 22non132 TGGCACAGAGGGAGGGAACGGG
Ligands 360A (iodide salt) and PhenDC3 (trifluoromethyl sulfonate salt) were donated by Marie-Paule Teulade-Fichou,18 and Pyridostatin (trifluoroacetate salt) was purchased from
Sigma-Aldrich. The concentrations were determined using molar ellipticity coefficients of 40000 cm-1 M-1 at 260 nm for 360A, 62400 cm-1 M-1 at 320 nm for PhenDC3 and 67500 cm-1 M-1
-20 °C at 2 mM concentration in H2O) and 360A (stored at 4 °C at 200 µM concentration in H2O)
were analyzed, G4 binding of partially degraded ligands was observed (see Figure S1). All results reported here were carried out with solutions prepared less than a month before analysis.
2.3 Circular Dichroism (CD)
CD experiments were performed with a JASCO J-815 spectropolarimeter equipped with a JASCO CDF 426S Peltier temperature controller, using quartz cells with a 1 cm path length. Reported spectra are a sum of 3 accumulations at 20°C with a scan speed of 50 nm/min and integration time of 0.5 s in the range of 220 nm to 350 nm. Data were normalized to molar circular-dichroic absorption ∆ε based on DNA concentrations using Δ θ/ 32980 where θ is the CD ellipticity in milidegrees, is the DNA concentration in mol/L and is the pathlength in cm (here,
l = 0.2 cm). Baselines were subtracted using a 100 mM TMAA and 1 mM KCl solution.
2.4 Electrospray Mass Spectrometry (ESI-MS)
ESI-MS spectra were obtained using a Thermo-Exactive Orbitrap mass spectrometer in the negative ion mode. We used the standard ESI source, and the samples were injected by a syringe pump at 4 µL/min. The full scan mass range was [500-4000]. The Exactive was tuned to “soft” conditions using the bimolecular quadruplex [G4T4G4]2 in 100 mM ammonium acetate.30
Conditions are considered “soft” when the dominating stoichiometry detected is [(G4T4G4)2+3(NH4)-8H]5- at m/z = 1524.6. Figure S2 in the supporting information depicts mass
spectra for “soft” conditions conditions, which can be tuned mainly by setting the HCD off, and adjusting MP_0 offset parameter to –8 V. Annotated mass spectra recorded under “soft” conditions are available in the supporting information for all of the oligonucleotides studied in this screening.
2.5 Methodology to infer conformational changes from ESI-MS data
A 10 µM solution of DNA sequence is prepared in a buffer that needs to be electrospray-compatible, have close to physiological ionic strength, and in which canonical 3-quartet G-quadruplexes are folded. We used a buffer solution consisting of 100 mM trimethylammonium acetate (TMAA) to fix the ionic strength of the solution, and 1 mM of KCl to supply the K+ ions
needed to fold the G4s.34 The KCl concentration is limited because if higher than 1 mM, the mass
spectrum is dominated by peaks that correspond to (KCl)nCl− clusters. The solution is injected into
the mass spectrometer and the ion intensity is measured for each mass-to-charge ratio (m/z). An example of full scan mass spectrum is shown in Supporting Figure S3, and example zooms on a charge state are shown in Figure 1 to illustrate the discussion. One can then unambiguously assign stoichiometries to each m/z peak.
Figure 1. ESI mass spectrum displaying ion intensity and mass to charge ratio (m/z) for 10
µM sequence 24non096 (A) and the sequence 24TTG (B) in 100 mM TMAA and 1 mM KCl. (C) A zoom of the region highlighted (in green) in A, showing the isotopic distribution.
To assign the peaks in the mass spectrum, we must first determine the charge state (z) of the ion signal. To do this, we zoom in on the isotopic distribution for the peak of interest, which arises predominantly from the naturally occurring abundance of 13C isotopologues (see inset C in Figure
1). The charge can be determined from the apparent separation between the isotopologue peaks; for a singly-charged ion, the separation between isotopologue peaks is 1 amu, whereas multiply-charged species exhibit peak separations of 1/z. Thus, the charge state z is:
| |
(1)
Where m/z) is the difference in the measured mass-to-charge ratio between the isotopologue peaks. In the example shown in Figure 1C, | | = 5. As we are operating in the negative ion mode,
z = −5.
By multiplying the m/z value for a given peak by the charge, we can then determine the mass of the complex, and hence unambiguously assign stoichiometries. The stoichiometries are obtained from the linear combination of the masses of the species in solution. The charges brought by the cations and ligands have to be properly accounted for. In negative mode, the complex is deprotonated to obtain the total charge. Therefore, complexes that differ in stoichiometry by one K+ are separated by the mass of the potassium ion minus the mass of a proton (i.e., m
K+ − mH+ =
38 amu), divided by z. For clarity, one can explicitly label the ionic complex, i.e. [24TTG]5- should
be explicated as [24TTG−5H]5−, and [24TTG+1K]5- should be explicated as [24TTG+1K−6H]5−.
We will however use the abbreviated forms, to keep figure labels concise.
The cation stoichiometry informs us on the number of stable quartets in the G4. Given that potassium cations intercalate between adjacent G-quartets, the number of quartets is one more than the number of specific K+ cations.30,35 However, care should be taken since, owing to the
electrospray process (which de-solvates ions to transfer species from solution to the gas phase), additional non-specific cation adducts are common. Non-specific cations in G4s are all those that bind to the exterior of the quadruplex.
Supporting information of reference15 describes how to determine the fraction of signal due to
nonspecific adducts. Briefly, this requires separate ESI-MS experiments on control sequences that cannot form G-quadruplexes (e.g., Figure 1A). The control sequence does not have inter-quartet specific sites, so all adducts are considered “non-G4 specific” (without presumption of whether these correspond to additional weak binding sites existing in solution, or to counterion condensation occurring during the electrospray process).
In up to 1 mM KCl, the first peak of the adduct distribution on the control sequences is always the 0-K+ adduct. Therefore, in the G-quadruplex forming sequences, the first peak of the adduct
distribution tells us the minimum number of specific potassium binding sites. For example, in Figure 1B, the first peak of the distribution corresponds to two potassium ions bound. The intensity distribution of extra adducts (3, 4, 5 K+) resembles the intensity distribution of the first adducts on
the control sequence (1, 2, 3 K+). The 2-K+ specific stoichiometry therefore predominates for that
sequence 24TTG. If the adduct distribution is broader, a quantitative treatment like in reference 15 is necessary to delineate the relative abundance of each specific complex. However the first peak of the adduct distribution is already offering important insight into changes of potassium binding stoichiometry between free and ligand-bound oligonucleotides.
The first K+ stoichiometry for the free oligonucleotide and its ligand complexes informs us of the
presence or absence of G4s in the DNA complex. For example, if the first peak of the adduct distribution corresponds to zero cations bound, the DNA does not possess stacked quartets (Figure 1A). If, instead, the first signal contains two cations bound, this is interpreted as three quartets being present in the structure (for example, see Figure 1B). Conformational changes are detected by comparing the cation distribution of the free G4 and that of the G4-ligand complex; disruption of a tetrad results in the loss of a cation, whereas formation of a tetrad is concomitant with the addition of a cation.
3. Results
3.1 Parallel Quadruplexes
The G-quadruplexes formed by the sequences Pu24, 26CEB, 222T, Budge-TB1 and [TG4T]4 are
all parallel-stranded. Pu24, a variant of the c-myc promoter nuclear hypersensitivity element,20 and
26CEB,20,36 which contains a very long loop, are parallel-stranded genomic quadruplexes.
Synthetic quadruplexes such as 222T, which can act as a switch system,8,20 Buldge-TB1,20 which
contains an unconventional loop, and [TG4T]4, a rigid tetramolecular parallel quadruplex, were
also studied. When these G4s are injected into the mass spectrometer without ligand, the predominant stoichiometry contains 2-K+ for Pu24, 26CEB, 222T, Budge-TB1 and 3-K+ for
has four quartets. This is expected based on their respective structures in potassium as determined by NMR spectroscopy.8,20,21,22
Figure 2A shows the mass spectrum for 222T in a 100 mM TMAA / 1 mM KCl solution without ligand, and Figures 2B-D show the resulting mass spectra following the addition of one equivalent of 360A, PDS, and PhenDC3, respectively. The results for all parallel-stranded sequences are shown in the supporting information (Figure S4). The K+ distributions in Figure 2 are identical for
the free G4 species and the G4 ligand complexes, indicating no conformational changes associated with ligand binding. This was the case for all parallel quadruplexes with these ligands.
The major ligand binding stoichiometries indicate the number of high-affinity ligand binding sites. Mass spectrometry easily allows to detect 2:1 ligand binding stoichiometries (with 360A and, to a lesser extent, PhenDC3) even though the ligand:G4 concentration ratio is 1:1. In contrast, only a single PDS ligand binds to the DNA, and does so to a lesser extent than 360A or PhenDC3. This general trend for all parallel G4s screened herein suggests that PDS has a lower binding affinity to parallel G4s than 360A or PhenDC3. For more quantitative estimates, accurate molar extinction coefficients and response factors must be obtained.37 Here we noticed that simply assuming equal
response factors is not valid (in some instances this assumption would lead to negative free ligand concentrations). We didn’t undertake quantitative KD determination in the present study, which
focuses on the stoichiometry determination. In summary, although the ligands bind with different affinities and stoichiometries (number of ligands bound), none of the ligands did alter the potassium adduct distribution of the oligonucleotide. So, the ligands are not able to change parallel-type structures.
Figure 2. (A) Mass spectrum of the parallel quadruplex 222T (10 µM) in a 100 mM TMAA
and 1 mM KCl buffer solution. (B) Mass spectrum of 222T following the addition of 1 equivalent (10 µM) of 360A, (C) PDS, and (D) PhenDC3. The number of K+ ions are
reported in red. The number of ligands (L) is reported in green.
3.2 Intramolecular Telomeric Quadruplexes
Human telomeric sequences contain the repeat (TAGGGT), and form antiparallel (2-quartet or 3-quartet) and/or hybrid structures depending on the sequence and KCl concentration.23,24,25,26,27 In
100 mM TMAA/1 mM KCl, quadruplexes 22AG, 22GT and 22CTA predominantly adopt 1-K+
stoichiometries38 and hence the 2-quartet G4s predominate. The 23TAG, 23AG, 24TTG, and
25TAG sequences all contain 2-K+ ions, in line with the 3-quartet structures determined by NMR
spectroscopy. We showed previously15 that for 24TTG, 23TAG and 22GT, the binding of 360A,
PhenDC3 and PDS is accompanied by the removal of a K+ ion, the preferential binding
stoichiometry being 1:1:1 (G4:K+:L). In the present work, we find that all additional variants tested
Figure 3(A-C) illustrates the ejection of a K+ ion from 23AG, 24TTG, and 25TAG, respectively,
indicating a conformational change from a 3-quartet structure to a 2-quartet structure upon binding of PhenDC3. For the 22CTA sequence, which is purely a 2-quartet structure without ligand, the K+ distribution is unchanged for the complex with PhenDC3 compared to the bare G4 structure
(Figure 3D). For the CD spectra of 22CTA with 360A, see Figure S5. Similarly to the parallel G4s, PhenDC3 and 360A bind strongly (almost completely) to the human telomeric G4s, while PDS binds to a lesser extent (see additional spectra in supporting Figure S6). 360A is the only ligand for which a stoichiometry of 1:2 (G4:L) is observed.
Figure 3. Mass spectra acquired from 10 µM of the quadruplexes (A) 23AG, (B) 24TTG,
(C) 25TAG, and (D) 22CTA following mixing with 1 equivalent (10 M) of the ligand, L = PhenDC3. The number of K+ ions are given in red.
3.3 Bimolecular Quadruplexes
Sequences containing two tracts of guanines typically form bimolecular G-quadruplexes.39 Mass
spectrometry reveals the strand molecularity: G-quadruplexes are detected as dimers containing K+ ions. The 12TAG sequence (two repeats of the human telomeric sequence), can form parallel
or antiparallel bimolecular G4s.31 The bimolecular [G4T4G4]
229,30 and [G4T3G4]230 G4s are both
antiparallel with four G-quartets. [G4T4G3]228 and [G3T4G4]228 G4s are guanine deficient and
adopt distinct 3-quartet bimolecular folds. NMR characterization of the structures for these quadruplexes had been carried out under relatively high potassium concentrations (15-100 mM). In our 1 mM KCl solutions, the G4s [G4T4G4]2 and [G4T3G4]2 form 3-K+ stoichiometries while
[G3T4G4]2 forms 2-K+ stoichiometries, in line with their respective NMR structures. However,
the quadruplexes [12TAG]2 and [G4T4G3]2 could not form in only 1 mM K+ and instead the
sequences were detected by mass spectrometry only as single strands. All mass spectra of bimolecular G4s are shown in Figure S7.
All three ligands bind relatively weakly to [G4T3G4]2 and no significant K+ change is observed
(see Figure 4A). This behavior, similar to that exhibited by the parallel quadruplexes discussed section 3.1, also holds for [G4T4G4]2 when combined with PhenDC3 (Figure S8) and PDS.
However, [G4T4G4]2 behaves differently in the presence of 360A (Figure 4B, Figure S9): it ejects
a K+ ion, similarly to the telomeric sequences (section 3.2). The [G3T4G4]2 quadruplex is
interesting as well: here two 360A (see Figure 4C) or PhenDC3 (see Figure S10) ligand molecules are required to start ejecting a K+ (whereas a single ligand suffices to eject a potassium ion from
[G4T4G4]2, and this only occurred for 360A). Cation ejection is not observed when [G3T4G4]2 is
mixed with PDS. With that sequence, each ligand has a distinct effect.
We explored the [G3T4G4]2/360A system further by circular dichroism (CD) spectroscopy (Figure
5, along with mass spectra at increasing concentration equivalents of 360A—see Figure S10 for PhenDC3). At one equivalent of 360A, G4 complexes with one and two ligands are observed. The binding of the second ligand is accompanied by a reduction in the number of K+ ions from two to
one. The CD spectrum of the ligand-free solution is unusual as well, and could indicate a mixture of parallel/antiparallel stacking arrangements. Compared to the ligand-free solution, the CD signal
of the solution with one equivalent of 360A increases at 295 nm and decreases at 270 nm. This indicates a transition to more antiparallel G4 structures in solution, wherein the alternate stacking predominates. As the ligand concentration is increased further, ligand-free and 1:1 complexes are completely depleted, in favor of stoichiometries containing two or three 360A molecules. At these ligand stoichiometries, the 1-K+ complex leads the adduct distribution. The CD spectra for these
more concentrated 360A solutions indicate predominantly antiparallel G4s. In summary, 360A interacts strongly with [G3T4G4]2, and two ligand molecules are necessary to induce isomerization
to an antiparallel structure containing 2 G-quartets.
Figure 4. Mass spectra of the 5 µM (bimolecular quadruplex concentration) solutions of (A)
[G4T3G4]2, for which no change in stoichiometry is observed upon binding of 360A, (B)
[G4T4G4]2, for which K+ is ejected upon binding of one 360A ligand, (C) [G3T4G4]2, for
which two 360A ligands are required to eject one K+, and (D) [12TAG]2 for which the
oligonucleotide folds into a bimolecular G4 with 1-K+ only when bound to at least one 360A
Figure 5. (A) Mass spectra of 5 µM [G3T4G4]2 (bimolecular quadruplex concentration) in the presence of 0, 1, 2 and 3 concentration equivalents of 360A. Binding of at least two 360A molecules is required to induce the loss of a K+ ion. (B) The circular dichroism (CD) spectra
acquired for the same solutions, showing the transition to an antiparallel structure requiring two ligand equivalents.
Ligands were also found to promote the formation of bimolecular G-quadruplexes. Indeed, although G4T4G3 and 12TAG did not fold into G4s in the 100mM-TMAA/1mM-KCl, two-stranded assemblies containing one K+ ion and one or more ligand molecules were observed in the
case of PhenDC3 and 360A. For example, Figure 4D shows the mass spectrum for 12TAG in the presence of 360A, where bimolecular G4s are observed with one or two ligands attached. G4T4G3
behaves similarly, except that a single PhenDC3 (Figure S11) molecule suffices to induce the formation of the G4, while two 360A molecules are needed (Figure S12). Again the induced G4s contain a single K+ ion, hence presumably two G-quartets. Introducing PDS, on the other hand,
produced only very small amounts of bimolecular [G4T4G3]2 (with 1-K+) and did not chaperone
the formation of (12TAG)2. To our knowledge, this is the first report of ligand-induced folding of
DNA into bimolecular G4s in an antiparallel structure containing only one cation and two G-quartets.
3.4 Ligand-Induced Formation of Intramolecular Quadruplexes
To further investigate ligand-induced G4 formation, longer non-G4 forming G-rich DNA sequences were selected. These sequences do not contain four perfect tracts of three guanine nucleotides. To rank the likelihood of forming a G4 (in the absence of ligand), we used the G4Hunter algorithm.40 Briefly, the algorithm gives G-quadruplex propensity scores based on the
number of contiguous guanines (favorable to G-quadruplexes) and cytosines (unfavorable). Sequences with a score above 1.0 are more likely to form G-quadruplexes. The ‘short names’ (given in Table 1) reflect their respective G4Hunter scores. For example, 22non105, is a non-G4-forming 22-mer (in 1 mM KCl), which has a G4Hunter score of 1.05. The lowest score of all the preformed G4s in this study is 1.44 (for 25TAG). Solutions containing the 22non105, 23non100, 24non096, and 26non088 sequences all predominantly yield mass spectral peaks corresponding to the deprotonated oligonucleotide (no K+), and to CD spectra that are representative of unfolded
oligonucleotides.
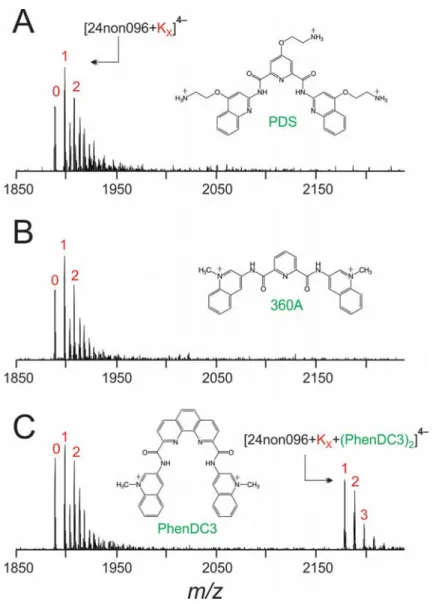
For most sequences, adding 360A or PDS to the DNA solutions resulted in negligible differences to the mass and CD spectra; 360A and PDS ligands bind very weakly to these non-G4 sequences. This is expected if the sequences remain single stranded, since the ligands are reputed for being highly selective for the G4s over other structures. Interestingly, for the three sequences 23non100, 24non096, and 26non088, adding PhenDC3 promotes the formation of assemblies with a distinct stoichiometry: the complexes contain exclusively two PhenDC3 molecules and a single K+ ion
Figure 6. Mass spectra of the 24non096 sequence with 1 equivalent of (A) PDS, (B) 360A,
and (C) PhenDC3. Two PhenDC3 ligands are required to stabilize a quadruplex with 1-K+
ion.
To gain insight into how the two quartets are stacked in the PhenDC3-induced intramolecular G4, we recorded CD spectra for 24non096 solutions containing at 0, 1, 2, and 3 equivalents PhenDC3 (Figure S13). Without ligand, the CD spectrum of 24non096 is typical of unfolded DNA. When up to two equivalents of PhenDC3 are added to the solution, the CD spectrum shifts to a profile typical of antiparallel quadruplexes (i.e., a large positive peak at ca. 290 nm and a smaller negative peak at ca. 260 nm). Two ligands are needed to induce the folding of an antiparallel G4 with two G-quartets. The addition of a third equivalent of PhenDC3 to the 24non096 solution however
results in a depletion of the positive peak at ca. 290 and loss of signal for the intramolecular G4 in the mass spectrum. Higher-order stoichiometries, e.g., [(24non096)2•(PhenDC3)6•(K+)2]9- are
observed in the mass spectrum of the solution containing three equivalents of PhenDC3 (Figure S14). This multimerization provides a reasonable explanation the unusual CD profile.
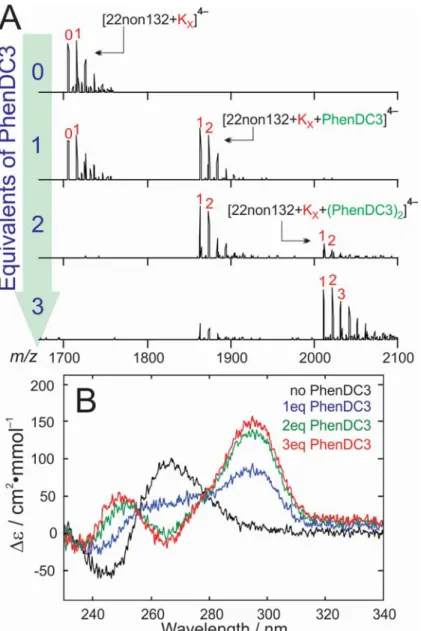
To test whether G4Hunter is able to predict ligand-induced G4 formation, the 22non105 sequence was scrambled to make new sequences of varying G4-formation potential. To avoid higher-order structures, we imposed 5’-TG and 3’-GG termini, and G-tracts of maximum three consecutive guanines. Nine sequences, with scores ranging from 0.59 to 1.32, were generated (see Table 1). None of them folded into a quadruplex when alone in our TMAA/KCl solution. In the mass spectrometry tests with the ligands, the highest-scoring sequence (22non132) was observed to bind 1-K+ upon complexation with PhenDC3, so PhenDC3 induces the folding of 22non132 into a
two-quartet G4 (Figure 7). In contrast to 24non096, the 22non132 sequence requires only one PhenDC3 ligand to fold, and there was no sign of multimerization at higher ligand concentration. CD spectra show that the structure of the PhenDC3-induced 22non132 G4 is antiparallel, and isoelliptic points (at ca. 255 nm and 280 nm) imply the presence of only two conformations (folded and unfolded). Two sequences with intermediate G4Hunter scores (0.68 and 1.14) produced weak amounts of 1:2 (G4:L) complex with 1 K+, whereas all other sequences (G4Hunter scores of 0.59, 0.77, 0.86, 0.95,
1.05b and 1.23) did not form G4s under any conditions (see Figure S15 for the full dataset). These results highlight that, in the presence of ligands, the rules predicting the G4 formation propensity still needs to be refined. It would be particularly interesting to know which sequences form ligand-induced G4 structures at physiological temperature.
Figure 7. (A) Mass spectra of 5 M 22non132 in the presence of 0, 1, 2 and 3 concentration equivalents of the ligand L = PhenDC3. Binding of one PhenDC3 ligand results in loss of a K+
ion. (B) The circular dichroism (CD) spectra acquired for 5 M 22non132 when combined with 0 – 3 equivalents of PhenDC3. The CD spectrum evolves from being representative of an unfolded oligonucleotide at low PhenDC3 concentration to being representative of an antiparallel G4 structure at high PhenDC3 concentration.
4. Discussion
Through screening a variety of DNA sequences, we show that ligands 360A, PhenDC3, and PDS can significantly change G-quadruplex structures: telomeric sequences or bimolecular antiparallel structures can undergo G-quartet disruption upon ligand binding. Correlating mass spectrometric results with CD spectra confirms that this binding mode involves conformational rearrangement to an antiparallel G4 structure containing a single K+ ion. However, ligands did not alter parallel
G-quadruplex conformations upon binding. Why is that so?
Finding the structural reason for this thermodynamic behavior ideally requires high-resolution atomic information on diverse configurations of complexes. Meanwhile, we can reason based on our screening with diverse structures. One hypothesis is that pre-formed parallel structures are more stable than pre-formed hybrid structures, and as a result the ligand can alter only the latter. We carried out CD melting experiments on quadruplexes 222T (parallel), 24TTG (hybrid 2) and 22AG (polymorphic), without and with 1 equivalent of PhenDC3 (supporting information Figure S16). These sequences were selected because the amounts of complex formed with PhenDC3 are similar, yet a conformational change is observed for 24TTG and 22AG but not 222T. In TMAA/1 mM KCl conditions, all three quadruplexes had similar melting temperatures (Tm = 39±1°C for
22AG, 39.5±1°C for 24TTG and 40±1°C for 222T). In presence of PhenDC3, the transitions are broad and likely multiphasic, and the apparent Tm is similar (Tm = 47±2°C for all sequences).
The thermal stability, which represents the apparent equilibrium between the folded and unfolded state, is therefore not correlated with the ligand ability to induce conformational changes. Instead, we must consider the entire network of equilibria. Our ligands are selective: they do not bind to unfolded DNA, and bind only to pre-formed G-quadruplexes. G-quadruplex folding pathways are branched pathways (parallel reactions), and inter-conversion between different ensembles proceeds through unfolding.38,41This leads us to the simplified mechanism depicted in Figure 8.
If, in our buffer and temperature conditions, (1) the sequence is fully folded (the unfolded population is insignificant) (2) into one single conformational ensemble (for example, parallel), and if (3) the ligand does not change the conformation, then the apparent binding constant Kapp is
conformation (Khyb1 and Khyb3), and the individual folding equilibria from unfolded to hybrid 1 and
hybrid 3. A ligand can induce a conformational change (e.g., from hybrid 1 to hybrid 3) only with the proper balance for binding constants (here, a higher binding constant for hybrid 3 than hybrid 1) and folding constants (hybrid 1 more stable than hybrid 3, but not too much otherwise there would be no population shift). If the parallel quadruplexes do not change conformation, it is not because they are intrinsically more stable, but because alternative conformations are not sufficiently stable compared to them.
Figure 8. Folding and binding equilibria hidden behind an apparent ligand binding affinity
constant (Kapp) for a polymorphic G-quadruplex forming sequence. By detecting separate signals
for individual K+ binding stoichiometries, mass spectrometry provides insight into the underlying
equilibria.
Now what can we deduce from the ligand binding preferences? Ligands favor conformations with one fewer G-quartet than the original ensemble. Conformational switching happens with telomeric sequences as described previously,15 but also for some antiparallel bimolecular G-quadruplexes,
or when starting from unfolded G-rich sequences. The preference for hybrid 3 structures (antiparallel structures with one fewer quartet) suggests favorable interactions between the ligand and loop guanines. Interestingly, the same preference is observed among parallel quadruplexes. [TG4T]4, 222T and Bulge-TB1 have all their guanines engaged in G-quartets, and the PhenDC3
and 360A binding affinities are moderate (there is still significant amount of free quadruplex when 1 equivalent ligand is added, see Figure S4). In contrast, the ligands have a much higher affinity for Pu24 and 26CEB (the complex is almost fully formed). Pu24 and 26CEB all have extra
guanines that are not engaged in G-quartets. The nature of this interaction is not yet known, and not apparent in the NMR structure of PhenDC3 complexed with Pu24.42 Exploring the hypothesis
of complex stabilization by ligand interactions with loop guanines will be an interesting line of study, to understand the binding affinity and selectivity of some of the best ligands reported to date.
5. Conclusions
Mass spectrometry is a useful biophysical characterization technique, because it helps partitioning the different folding and binding equilibria hidden behind an apparent ligand binding affinity. Monitoring cation binding by ESI-MS provides novel insight into quadruplex ligand binding modes, using low amounts of sample. By monitoring the number of bound K+ ions in the free and
ligand-bound forms of DNA, we can deduce the number of G-quartets in the main conformational ensemble for each ligand binding stoichiometry. K+ uptake upon ligand binding indicates
G-quartet formation: this enabled us to detect ligand-induced quadruplex formation. These results suggest that, while algorithms such as G4Hunter can provide insight regarding the propensity for DNA sequences to form G4s, more work will be required to be able to predict DNA folding into G4s in the presence of specific ligands. We also find instances where ligand-induced structural changes require the binding of more than one ligand, and mass spectrometry is very effective at detecting such occurrences. K+ ejection from pre-formed structures upon ligand binding indicates
G-quartet disruption. This suggests that ligand binding modes are more complex than just end-stacking. Stacking to a G-quartet core is mandatory (ligands do not bind to unfolded strands), but favorable interaction between the ligands and guanines of the loops may contribute to reach the highest ligand binding affinities, and to ligand structural specificity.
Acknowledgments
This work was financially supported by the University of Waterloo (Bordeaux-Waterloo research grants), the Inserm [ATIP-Avenir Grant no. R12086GS], the Conseil Régional Aquitaine [Grant no. 20121304005], the EU Seventh Framework Programme [FP7-PEOPLE-2012-CIG-333611] and NSERC. M.L. benefited from a CGS-MSFSS scholarship and a fellowship from the Michael Smith Foundation for Health Research to fund his research stay in Bordeaux.
REFERENCES
1. Davis, J. T. G-Quartets 40 Years Later: From 5'-GMP to Molecular Biology and Supramolecular Chemistry. Angew. Chemie - Int. Ed. 43, 668–698 (2004).
2. Maizels, N. & Gray, L. T. The G4 Genome. PLoS Genet. 9, e1003468 (2013).
3. Ou, T. M. et al. G-quadruplexes: Targets in anticancer drug design. ChemMedChem 3, 690– 713 (2008).
4. Wang, Y. & Patel, D. J. Solution structure of the human telomeric repeat d[AG3(T2AG3)3] G-tetraplex. Structure 1, 263–82 (1993).
5. Buscaglia, R., Gray, R. D. & Chaires, J. B. Thermodynamic characterization of human telomere quadruplex unfolding. Biopolymers 99, 1006–1018 (2013).
6. Gray, R. D., Petraccone, L., Trent, J. O. & Chaires, J. B. Characterization of a K+-induced conformational switch in a human telomeric DNA oligonucleotide using 2-aminopurine fluorescence. Biochemistry 49, 179–194 (2010).
7. Miller, M. C., Buscaglia, R., Chaires, J. B., Lane, A. N. & Trent, J. O. Hydration is a major determinant of the G-quadruplex stability and conformation of the human telomere 3’ sequence of d(AG3(TTAG3)3). J. Am. Chem. Soc. 3, 17105–17107 (2010).
8. Largy, E., Marchand, A., Amrane, S., Gabelica, V. & Mergny, J. L. Quadruplex Turncoats: Cation-Dependent Folding and Stability of Quadruplex-DNA Double Switches. J. Am.
Chem. Soc. 138, 2780–2792 (2016).
9. Zhou, J. et al. Combination of i-motif and G-quadruplex structures within the same strand: Formation and application. Angew. Chemie - Int. Ed. 52, 7742–7746 (2013).
10. Neidle, S. Quadruplex Nucleic Acids as Novel Therapeutic Targets. J. Med. Chem. 16, 5987-6011 (2016).
11. Monchaud, D. & Teulade-Fichou, M.-P. A hitchhiker’s guide to G-quadruplex ligands. Org.
Biomol. Chem. 6, 627–636 (2008).
12. Nicoludis, J. M., Barrett, S. P., Mergny, J. L. & Yatsunyk, L. A. Interaction of human telomeric DNA with N-methyl mesoporphyrin IX. Nucleic Acids Res. 40, 5432–5447 (2012).
13. Robert D. Gray, J. L. and J. B. C. Kinetics and mechanism of G-quadruplex formation and conformational switch in a G-quadruplex of PS2.M induced by Pb2+. J. Phys. Chem. B 133, 2676–2683 (2009).
14. Marchand, A., Strzelecka, D. & Gabelica, V. Selective and Cooperative Ligand Binding to Antiparallel Human Telomeric DNA G-Quadruplexes. Chem. - A Eur. J. 22, 9551–9555 (2016).
15. Marchand, A. et al. Ligand-induced conformational changes with cation ejection upon binding to human telomeric DNA G-quadruplexes. J. Am. Chem. Soc. 137, 750–756 (2015). 16. Cian, A. D. & Mergny, J. L. Quadruplex ligands may act as molecular chaperones for
tetramolecular quadruplex formation. Nucleic Acids Res. 35, 2483–2493 (2007).
17. Granotier, C. et al. Preferential binding of a G-quadruplex ligand to human chromosome ends. Nucleic Acids Res. 33, 4182–4190 (2005).
18. De Cian, A., DeLemos, E., Mergny, J. L., Teulade-Fichou, M. P. & Monchaud, D. Highly efficient G-quadruplex recognition by bisquinolinium compounds. J. Am. Chem. Soc. 129, 1856–1857 (2007).
19. Koirala, D. et al. A single-molecule platform for investigation of interactions between G-quadruplexes and small-molecule ligands. Nat. Chem. 3, 782–787 (2011).
20. Phan, A. T., Kuryavyi, V., Gaw, H. Y. & Patel, D. J. Small-molecule interaction with a five-guanine-tract G-quadruplex structure from the human MYC promoter. Nat. Chem. Biol. 1, 167–173 (2005).
21. Amrane, S. et al. Formation of Pearl-Necklace Monomorphic G-Quadruplexes in the Human CEB25 Minisatellite. J. Am. Chem. Soc. 134, 5807–5816 (2012).
22. Mukundan, V. T. & Phan, A. T. Bulges in G-Quadruplexes: Broadening the Definition of G-Quadruplex-Forming Sequences. J. Am. Chem. Soc. 135, 5017–5028 (2013).
23. Lim, K. W. et al. Structure of the human telomere in K + solution: A stable basket-type G-quadruplex with only two G-tetrad layers. J. Am. Chem. Soc. 131, 4301–4309 (2009). 24. Lim, K. W. et al. Sequence variant (CTAGGG)n in the human telomere favors a
G-quadruplex structure containing a G∙C∙G∙C tetrad. Nucleic Acids Res. 37, 6239–6248 (2009).
25. Phan, A. T., Kuryavyi, V., Luu, K. N. & Patel, D. J. Structure of two intramolecular G-quadruplexes formed by natural human telomere sequences in K+ solution. Nucleic Acids
Res. 35, 6517–6525 (2007).
26. Zhang, Z., Dai, J., Veliath, E., Jones, R. A. & Yang, D. Structure of a two-G-tetrad intramolecular G-quadruplex formed by variant human telomeric sequence in K+ solution: Insights into the interconversion of human telomeric G-quadruplex structures. Nucleic
Acids Res. 38, 1009–1021 (2009).
27. Luu, K. N., Phan, A. T., Kuryavyi, V., Lacroix, L. & Patel, D. J. Structure of the human telomere in K+ solution: An intramolecular (3+1) G-quadruplex scaffold. J. Am. Chem. Soc. 128, 9963–9970 (2006).
28. Šket, P., Črnugelj, M. & Plavec, J. D(G3T4G4) forms unusual dimeric G-quadruplex
structure with the same general fold in the presence of K+, Na+ or NH
Med. Chem. 12, 5735–5744 (2004).
29. Schultze, P., Smith, F. W. & Feigon, J. Refined solution structure of the dimeric quadruplex formed from the Oxytricha telomeric oligonucleotide d(GGGGTTTTGGGG). Structure 2, 221–233 (1994).
30. Balthasart, F., Plavec, J. & Gabelica, V. Ammonium ion binding to DNA G-quadruplexes: Do electrospray mass spectra faithfully reflect the solution-phase species? J. Am. Soc. Mass
Spectrom. 24, 1–8 (2013).
31. Phan, A. T. & Patel, D. J. Two-Repeat Human Telomeric d(TAGGGTTAGGGT) Sequence Forms Interconverting Parallel and Antiparallel G-Quadruplexes in Solution: Distinct Topologies, Thermodynamic Properties, and Folding/Unfolding Kinetics. J. Am. Chem.
Soc. 125, 15021–15027 (2003).
32. Phillips, K., Dauter, Z., Murchie, a I., Lilley, D. M. & Luisi, B. The crystal structure of a parallel-stranded guanine tetraplex at 0.95 A resolution. J. Mol. Biol. 273, 171–182 (1997). 33. Cavaluzzi, M. J. & Borer, P. N. Revised UV extinction coefficients for
nucleoside-5’-monophosphates and unpaired DNA and RNA. Nucleic Acids Res. 32, e13 (2004).
34. Marchand, A. & Gabelica, V. Native electrospray mass spectrometry of DNA G-quadruplexes in potassium solution. J. Am. Soc. Mass Spectrom. 25, 1146–1154 (2014). 35. Gros, J. et al. Guanines are a quartet’s best friend: Impact of base substitutions on the
kinetics and stability of tetramolecular quadruplexes. Nucleic Acids Res. 35, 3064–3075 (2007).
36. Amrane, S. et al. Formation of Pearl-Necklace Monomorphic G-Quadruplexes in the Human CEB25 Minisatellite. J. Am. Chem. Soc. 134, 5807–5816 (2012).
37. Gabelica, V., Rosu, F. & De Pauw, E. A simple method to determine electrospray response factors of noncovalent complexes. Anal. Chem. 81, 6708–6715 (2009).
Nucleic Acids Res., accepted 10-Oct-2016 (manuscript ID: gkw970)
39. Burge, S., Parkinson, G. N., Hazel, P., Todd, A. K. & Neidle, S. Quadruplex DNA: Sequence, topology and structure. Nucleic Acids Res. 34, 5402–5415 (2006).
40. Bedrat, A., Lacroix, L. & Mergny, J. L. Re-evaluation of G-quadruplex propensity with G4Hunter. Nucleic Acids Res. 44, 1746–1759 (2016).
41. Stadlbauer, P., Krelp, M., Cheatham, T.E., 3rd, Koca, J. & Sponer J. Structural Dynamics of Possible Late-Stage Intermediates in Folding of Quadruplex DNA Studied by Molecular Simulations. Nucleic Acids Res. 41, 7128–7143 (2013).
42. Chung, W.J., Heddi, B., Hamon, F. Teulade-Fichou, M.P. & Phan, A.T. Solution Structure of a G-Quadruplex Bound to the Bisquinolinium Compound Phen-Dc3. Angew. Chemie -


![Figure 4. Mass spectra of the 5 µM (bimolecular quadruplex concentration) solutions of (A) [G4T3G4] 2 , for which no change in stoichiometry is observed upon binding of 360A, (B) [G4T4G4] 2 , for which K + is ejected upon binding of one 360A ligand, (C)](https://thumb-eu.123doks.com/thumbv2/123doknet/14616486.546405/14.918.113.786.196.820/figure-spectra-bimolecular-quadruplex-concentration-solutions-stoichiometry-observed.webp)
![Figure 5. (A) Mass spectra of 5 µM [G3T4G4] 2 (bimolecular quadruplex concentration) in the presence of 0, 1, 2 and 3 concentration equivalents of 360A](https://thumb-eu.123doks.com/thumbv2/123doknet/14616486.546405/15.918.264.668.106.748/figure-spectra-bimolecular-quadruplex-concentration-presence-concentration-equivalents.webp)