HAL Id: hal-00299328
https://hal.archives-ouvertes.fr/hal-00299328
Submitted on 15 Jun 2006
HAL is a multi-disciplinary open access
archive for the deposit and dissemination of
sci-entific research documents, whether they are
pub-lished or not. The documents may come from
teaching and research institutions in France or
abroad, or from public or private research centers.
L’archive ouverte pluridisciplinaire HAL, est
destinée au dépôt et à la diffusion de documents
scientifiques de niveau recherche, publiés ou non,
émanant des établissements d’enseignement et de
recherche français ou étrangers, des laboratoires
publics ou privés.
as a basis for a comparative risk assessment in Germany
L. Kleist, A. H. Thieken, P. Köhler, M. Müller, I. Seifert, D. Borst, U. Werner
To cite this version:
L. Kleist, A. H. Thieken, P. Köhler, M. Müller, I. Seifert, et al.. Estimation of the regional stock of
residential buildings as a basis for a comparative risk assessment in Germany. Natural Hazards and
Earth System Science, Copernicus Publications on behalf of the European Geosciences Union, 2006,
6 (4), pp.541-552. �hal-00299328�
© Author(s) 2006. This work is licensed under a Creative Commons License.
and Earth
System Sciences
Estimation of the regional stock of residential buildings as a basis
for a comparative risk assessment in Germany
L. Kleist1,4, A. H. Thieken2, P. K¨ohler2, M. M ¨uller2,4, I. Seifert2,3, D. Borst3,4, and U. Werner3 1University of Karlsruhe (TH), Institute for Economic Policy Research, 76128 Karlsruhe, Germany
2GeoForschungsZentrum Potsdam (GFZ), Section Engineering Hydrology and Data Center, Telegrafenberg, 14473 Potsdam,
Germany
3University of Karlsruhe (TH), Institute for Finance Banking and Insurance, 76128 Karlsruhe, Germany 4Center for Disaster Management and Risk Reduction Technology (CEDIM), 76128 Karlsruhe, Germany
Received: 12 January 2006 – Revised: 20 April 2006 – Accepted: 21 April 2006 – Published: 15 June 2006
Abstract. One important prerequisite for a comparable quantitative risk assessment for different types of hazards (e.g., earthquakes, windstorms and floods) is the use of a common database about and financial appraisal of the assets at risk. For damage assessments it is necessary to represent the values at risk on a regional disaggregated scale and to intersect them with hazard scenarios. This paper presents a methodology and results of a financial appraisal of residen-tial buildings for all communities in Germany. The calcu-lated values are defined as replacement values for the refer-ence year 2000. The resulting average replacement costs for residential buildings per inhabitant amount to EUR 46 600, with considerable differences between communities. The in-ventory can be used for the calculations of direct losses from various natural disasters within the project “Risk Map Ger-many”.
1 Introduction
One aim of the project “Risk Map Germany”, which was launched by the Center for Disaster Management and Risk Reduction Technology (CEDIM), is to compare risks due to different types of natural disasters such as windstorms, earth-quakes and floods. For this task a consistent framework is needed. Such a framework includes common definitions of essential terms in risk analyses, such as hazard, vulnerabil-ity, exposure and risk, and a consensus about the indicators that are used to quantify the risk. Since it is a further aim of the CEDIM-project “Risk Map Germany” to perform quan-titative risk assessments in terms of a financial appraisal, es-timates of direct, tangible losses were chosen as risk indica-tor. Although it is acknowledged that social and ecological factors play an important role in risk assessments, it was
ob-Correspondence to: L. Kleist
served that most of the engineering and technical risk assess-ments are restricted to the quantification of direct, tangible losses as a measure for technical vulnerability (for flood risk assessments cf. Merz and Thieken, 2004).
Since it is known from other investigations (e.g. Gr¨unthal et al., 2006) that a uniform database and financial assessment of assets at risk is essential for a consistent quantitative com-parison of different risks, a working group was established with the objective to provide a spatially-distributed inventory and financial appraisal of asset values for different economic sectors in Germany. As one result of the working group, this paper describes a new method how to estimate the asset val-ues of residential buildings at the municipal level (communi-ties) in Germany.
The paper is organized as follows: First, an introduction of the framework for risk analysis in CEDIM and a short lit-erature review of the estimation of building values are given. Then, the data used and the method developed for the esti-mation of asset values of residential buildings are described. Furthermore it is shown how the method can be applied to the whole of Germany so that an inventory and financial ap-praisal of assets of residential buildings in Germany can be provided. Finally, possible applications of the data set are discussed.
1.1 Framework of the risk analysis and definitions In engineering or technical risk assessments, the term risk is often used to describe the probability that a given loss will occur (e.g. Kaplan and Garrick, 1981; Crichton, 1999; CEDIM, 2005; Gr¨unthal et al., 2006). This definition is also used in the CEDIM project “Risk Map Germany” with direct, tangible losses as risk indicator. Therefore, risk encompasses three aspects: hazard, vulnerability (in terms of susceptibil-ity of the affected element) and the asset of exposed elements at risk.
Whereas hazard assessments are performed separately for each type of hazard, it is essential for a comparison of differ-ent risks for all loss estimates to be based on the same cost concept (e.g. replacement costs or current values, see below). To ensure this, it was decided to develop a uniform inventory of assets together with a financial appraisal that have to be used as input to all damage estimations.
This concept implies that the specific damage models cal-culate damage ratios indicating the cost of the damage or re-pair works as a percentage of the total monetary value of the affected element at risk. The total monetary loss is achieved by multiplying the calculated damage ratio by the asset value of the affected elements in the hazard scenario under study. See Blong (2003a) for other concepts that have been used in damage modelling.
A further agreement has to be made concerning the ele-ments at risk that are chosen for the analysis. Therefore, a list of asset categories and features was developed taking into account the following aspects: Elements at risk can be classified by their assignment to an economic sector, such as private households, manufacturing, services sector, transport, agriculture etc. as done e.g. in general classification of eco-nomic activities within the European Community (NACE). In each sector different objects can be identified, e.g. build-ings, contents/fixtures, vehicles, networks or land area. The objects, e.g. buildings, can be further characterised by their age, type, quality etc. For the estimation of assets in a coun-trywide approach scaling and correction factors, e.g. depend-ing on the size of the cities or the number of inhabitants per community, are needed. On the basis of these considerations the asset estimation for residential buildings was performed first. The assessment approach developed as well as its main results are the subject of this paper and outlined in Sects. 2 and 3.
A central question in the assessment process is the under-lying cost concept, i.e. whether replacement/reconstruction costs, current values or market values (as sale prices) of the residential buildings should be calculated. While one can rightfully argue, that the economic loss connected with the destruction of property is expressed by the current values of the damaged elements, it was decided that the values of the assets are quantified as replacement or reconstruction costs. The reason is the assumption that in the case of a natural dis-aster, all destroyed property will be reconstructed. As out-lined by van der Veen and Logtmeijer (2005) replacement costs should be used for financial appraisals, e.g. for inves-tigating the sum of claims that an insurance company has to deal with in case of a disaster. Since this kind of financial appraisal is intended in this paper, the reconstruction costs are an adequate indicator for assessing the value of the resi-dential building stock. It provides useful information about the disaster relief funds needed to finance the reconstruction process. Therefore, the monetary values of residential build-ings were estimated as replacement costs for the reference year 2000.
1.2 Literature review: approaches to estimate building val-ues
Only a few risk assessment studies were found in which an approach to estimate building values is explicitly explained. This might be due to the fact that in many risk analyses no quantitative risk indicators are used and/or that damage mod-elling is done with damage scales that directly estimate mon-etary losses (e.g. Parker et al., 1987; Blong, 2003a; Penning-Rowsell et al., 2006). In the latter cases an estimation of building values is not necessary.
There are a few risk assessment studies that give some ex-amples for the estimation of building values. In many risk assessment studies in Germany, particularly in meso-scale flood damage estimations, data on the gross stock of fixed assets in combination with land use data were used to calcu-late unit values for different economic sectors (e.g. MURL, 2000; IKSR, 2001; Gr¨unthal et al., 2006). The values of res-idential buildings, however, were estimated by another ap-proach (see MURL, 2000; Gr¨unthal et al., 2006): The total value of residential buildings was estimated by multiplying the number of buildings by the mean insurance value for the buildings, which in general also represent the replacement costs of the buildings. This estimate was then transformed into a unit value per m2by relating it to the total settlement area in the area under study. This approach is rather rough and has the major drawback that differences in building types are not considered.
In a few other studies more detailed concepts were intro-duced. Dutta et al. (2003) used unit economic values of the elements analysed. The elements at risk are classified into residential and non-residential buildings, farmhouses, agri-cultural products, farm infrastructure and several types of public infrastructure. To estimate the monetary value of res-idential buildings the replacement costs per unit floor area are multiplied by the floor areas throughout the investigation area on a grid cell basis. The floor area per grid cell is de-termined considering land cover type, building ratios (that is the percentage of area covered by buildings in a given area) and floor area fractions (that is the total area of all storeys of a building divided by the ground surface area of the building; thus for a one-storey building the floor area fraction amounts to 1). The latter two parameters were derived from aerial photographs; building types are classified into wooden and concrete buildings for which different unit replacement val-ues are assumed (Dutta et al., 2003). This approach is fea-sible for small and medium areas, but not for a countrywide approach, since the analysis of aerial photographs for a huge area is too time-consuming.
In a risk analysis for Australia, Blong (2003b) also used construction costs (replacement costs) per square meter that are published by Australian authorities. The basic idea of the approach of Blong (2003b) is not to estimate the total value of all structures by using different unit values for each building type, but to relate all different building types to a
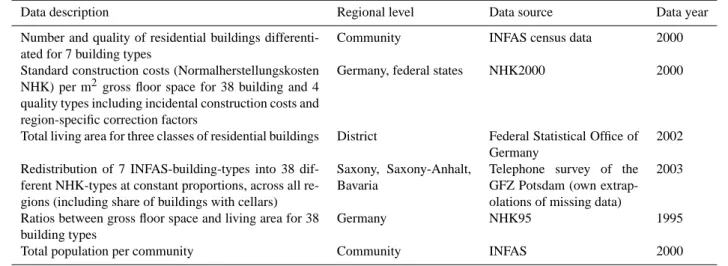
Table 1. Main data sources.
Data description Regional level Data source Data year Number and quality of residential buildings
differenti-ated for 7 building types
Community INFAS census data 2000 Standard construction costs (Normalherstellungskosten
NHK) per m2gross floor space for 38 building and 4 quality types including incidental construction costs and region-specific correction factors
Germany, federal states NHK2000 2000
Total living area for three classes of residential buildings District Federal Statistical Office of Germany
2002 Redistribution of 7 INFAS-building-types into 38
dif-ferent NHK-types at constant proportions, across all re-gions (including share of buildings with cellars)
Saxony, Saxony-Anhalt, Bavaria
Telephone survey of the GFZ Potsdam (own extrap-olations of missing data)
2003
Ratios between gross floor space and living area for 38 building types
Germany NHK95 1995
Total population per community Community INFAS 2000
medium-sized family house. To do this, he introduces cost and replacement ratios. The cost ratios are derived by relat-ing the standardized construction costs of all other buildrelat-ings to the construction costs of a medium-sized family house. Further, a replacement ratio RR considers differences in the building size (floor area) and is defined as RR = [(Cost Ratio
×Floor area)/Flood area of a medium-sized family house]. The replacement ratios are then used in the damage model of Blong (2003b), which calculates damage as house equiv-alents. Monetary loss can be achieved by multiplying the house equivalents by the value of a medium-sized family house. The advantage is that the method can be easily up-dated and that the damage model can be used for different hazard types. However, the transferability of the approach to other countries and the applicability with other damage mod-els have not been shown yet.
The challenge in the CEDIM-Project “Risk Map Ger-many” was to develop a methodology for the estimation of building values that is more detailed than the approach cur-rently used in Germany. Like in the approaches of Dutta et al. (2003) or Blong (2003b), differences in building types should be considered. On the other hand, the approach should be based on countrywide available data sets that al-low an application to all 13 415 German communities.
2 Data and methods
2.1 Outline of the methodology
As outlined above, the challenge was to develop a method-ology for the asset estimation of residential buildings that is detailed enough to reflect both the differences of the specific construction costs per building type and the regional differ-ences of the building stock while simultaneously being easily applicable to all of Germany.
To bridge this gap, it was decided to use available informa-tion on standardized construcinforma-tion costs for residential build-ings in Germany that could then be linked with census data about the building stock and the living area per community. In so doing, the total as well as the per-capita replacement costs for residential buildings, differentiated by types, could be calculated for all German communities. The results of the calculation also include information on the communal living area per inhabitant and the specific construction costs per m2 living area.
2.2 Input data
To better understand the methodology, the key data sources (Table 1) are presented first.
2.2.1 Census data for residential buildings (INFAS GEO-Daten)
Several data sets of INFAS GEOdaten (2001) are used. The data are provided in two spatial resolutions: the administra-tive boundaries of communities and postcodes, respecadministra-tively. Both topologies are incompatible with each other. This in-consistency raises a problem when transferring the results from one level to the other. Since data on the community level is easier to connect with official data from the statisti-cal offices in Germany, the community level was determined as the level of regionalisation for the asset assessment.
The INFAS data comprise the number of buildings for seven residential building types per community. Further-more, the communal building stock is classified into four age and quality classes respectively. The residential build-ing types include, amongst others, 1- and 2 family-homes, multifamily houses, blocks of flats or multi-storey houses.
Table 2. Assignment of NHK building types to the INFAS building type 1- and 2-family homes on the basis of a survey among 1697 private
households in Saxony, Saxony-Anhalt and Bavaria.
NHK-type number Description of NHK building type Share of NHK-type in INFAS-type (in %) 101 cellar (CE), ground floor (GF), fully developed attic storey (FDA) 15.3
102 CE, GF, regular attic storey (RA) 7.4
103 CE, GF, flat roof 2.8
111 CE, GF, first floor (FF), FDA 21.7
112 CE, GF, FF, RA 22.8
113 CE, GF, FF, flat roof 5.5
121 GF, FDA 3.4 122 GF, RA 2.1 123 GF, flat roof 0.7 131 GF, FF, FDA 7.4 132 GF, FF, RA 8.8 133 GF, FF, flat roof 2.0
2.2.2 Data on reconstruction costs
Since the objective was to perform the assessment for the residential buildings of all communities in Germany, a col-lection of individual cost data per building was not feasi-ble. Instead, it was decided to use mean construction costs per building type. The so-called “Normalherstellungskosten” are standardized construction costs, will be further referred to as “NHK2000” and were published by the German Fed-eral Ministry of Transport, Building and Urban Development (BMVBW, 2001). Cost data of NHK2000 are given in Euro per square meter gross floor space. They are differentiated for a fairly high number of building types, considering the number of storeys, the existence of a cellar and the type of the attic storey. In addition, information on incidental construc-tion costs, influences of the age and the quality standard of a building as well as conversion factors between living area and gross floor space are provided per building type. Further distinctions can be introduced by considering regional cor-rection factors for the different German federal states and for the size of a community.
Owing to the objective to provide a sound financial ap-praisal of the stock of residential buildings by assessing the reconstruction costs, the replacement cost approach (Sachw-ertverfahren) stipulated in the German evaluation guidelines was applied (BMVBW, 2002).
2.2.3 Data on total regional living area
The calculation of costs using NHK2000 does not lead to any results without data on the gross floor area per both building type and region. Since such data is not publicly available on the community level, data on the living area per district – which is the regional administrative entity above the commu-nities – are used. The data are provided by the Federal Sta-tistical Office of Germany (Statistisches Bundesamt, 2004)
and the Federal Office of for Building and Regional Planning (BBR, 2003).
2.3 Data mapping and data coherence
The following main challenges were connected with the use of heterogeneous data in the estimation approach:
First, the above-mentioned data sources provide differ-ent classifications for residdiffer-ential buildings that have to be mapped. While the INFAS data on the number of residential buildings at the municipal level differentiates between seven building types, the data of the Federal Statistical Office of Germany on the total living area on the superordinated level of districts only distinguishes between three types of build-ings, according to the number of flats per building. On the other hand, the classification of building types used to deter-mine the specific construction costs per unit of gross floor area presented in BMVBW (2001) is much more detailed: There, 38 different building types are identified, thereof 12 different types of one-family houses.
In order to achieve a mapping of these different classifi-cations, it was necessary to estimate the percentage of each NHK2000 building type within the more aggregated INFAS building types. Since official data about the number of NHK-building types per region is not available, the linkage was done with the help of results from computer-aided telephone interviews among 1697 private households that had experi-enced damages during the August 2002 flood in Germany (Thieken et al., 2005; Kreibich et al., 2005). The survey contains detailed information about the affected buildings (number of storeys, type of attic storey, cellar etc.), which was used to assign a NHK-building type to each interview. A frequency analysis revealed the share of buildings among these types (Table 2). The survey contains data from Saxony, Saxony-Anhalt and Bavaria. It was assumed that the percent-ages are representative for all of Germany.
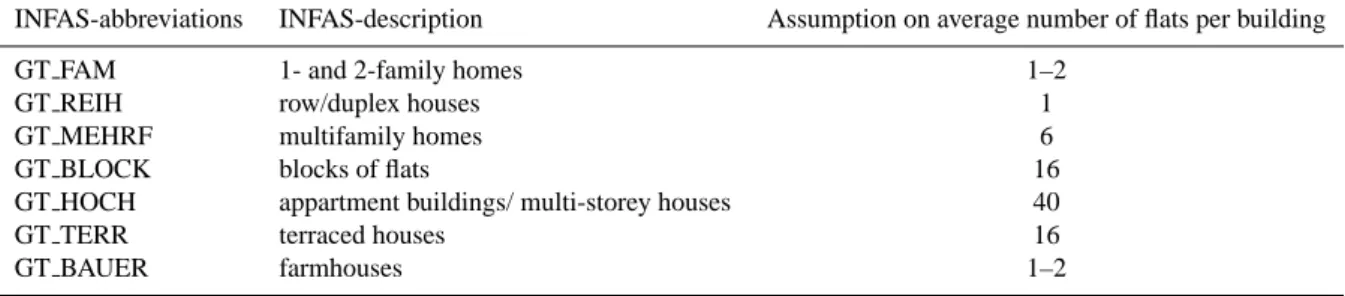
Table 3. Assumptions on the relative size of multi-flat-buildings in the communities.
INFAS-abbreviations INFAS-description Assumption on average number of flats per building GT FAM 1- and 2-family homes 1–2
GT REIH row/duplex houses 1
GT MEHRF multifamily homes 6
GT BLOCK blocks of flats 16
GT HOCH appartment buildings/ multi-storey houses 40
GT TERR terraced houses 16
GT BAUER farmhouses 1–2
The data on the total living area per district was available for three building types (buildings with one flat, buildings with two flats and buildings with three or more flats). To map this data with the INFAS classification of the buildings in the communities the share of the buildings with more than two flats (e.g. multi-storey buildings, apartment buildings) with respect to their living area had to be estimated. This task is necessary for the calculation of the total construction costs of these buildings. This was done with help of some assumptions (see Table 3). It has to be noted that the total living area for each of the three building types on the district level was fixed by the official data of the Federal Statistical Office; only the relative size of the multi-flat buildings within a district depends on this assumption. Thus, the average size of a multi-flat building of a certain INFAS type is constant in each district but differs between the districts in Germany. Nonetheless, systematic variations of the average size of a multi-flat building between the communities of a district, as well as variations in the average size of the family houses, may lead to discrepancies between the real and the estimated living area in some communities. As stated above, this prob-lem does not occur on the level of districts, since the total living area is known from the statistical data.
Another mapping process was necessary with regard to building qualities. The construction costs per square meter provided by BMVBW (2001) depend not only on the build-ing type, but also on the quality of the respective buildbuild-ing. Since BMVBW (2001) differentiates between four quality types while the INFAS data on the number of buildings per community discriminates six quality types, it was necessary to aggregate the latter into four types. Unfortunately, the differentiation into quality types in the INFAS data was not available for each of the seven types of residential buildings, but only for all buildings of a community together. Thus, the percentage of buildings with a certain quality is constant for all buildings types in a community. However, it varies between the communities.
2.4 The calculation process
The process for the estimation of the reconstruction costs of residential buildings in the communities of Germany is sub-divided in two main stages, each consisting of a number of sub-steps. The data processing is depicted in Fig. 1 and con-sists of the following steps:
In the first stage, the statistical data about the living area per district is linked with information on the number of res-idential buildings and their qualities in the communities. As an intermediate result, the living area per community, INFAS building type and quality class is obtained.
In the second stage the results of the first stage are linked with data on specific reconstruction costs provided by BMVBW (2001) with the help of the information on the share of NHK-subtypes for each INFAS building type shown in Table 2. In doing so, the total reconstruction costs for residential buildings for each community as well as for the different INFAS building types are calculated. By dividing these values with the total population per community the specific reconstruction costs per inhabitant and community are determined.
Stage 1: Calculation of the living area per commu-nity and INFAS building type
First, the number of buildings per community is aggre-gated to the district level for each building type. This information is transformed into the number of flats per building type and district with the help of supplementary data (Table 3). These intermediate results are then used to subdivide the total living area per district, which is available for three classes of buildings, into the total living area per district and INFAS building type. By division with the number of buildings per type and district the average living area per residential building per type and district is calculated. The intermediate result of the living area per community, differentiated for INFAS building type and quality class, follows from the multiplication of these values with the number of buildings per INFAS-type and community, with provision for the share of the quality classes in the communities.
D22 Number of buildings per district and
INFAS-type INFAS
Building type (INFAS)-specific living area in district R5
Living area in district per INFAS-type R4
Ratio of living area per district and DESTATIS-class 2)
Federal Office of Statistics
D20
Total living area per district BBR (INKAR) D21 R3 * D20 * D21 R1 / R2 R3
Ratio of flats in district per INFAS-type INFAS, Stat. Bundesamt (DESTATIS) and
assumptions Number of flats per district and INFAS-type 1)
INFAS and assumptions
Number of flats in district 2) INFAS and assumptions
R1 R2
R7 Intermediate result: Living area per community, INFAS-type and INFAS-quality-class D24 Allocation from D24 to R6
under assumption of equal distribution Aggregated INFAS-quality-classes 3)
INFAS
Living area per community and INFAS-type R6
Number of buildings per community and INFAS-type INFAS D23 R4 / D22 R5 * D23 D22
Number of buildings per district and INFAS-type
INFAS
Number of buildings per district and INFAS-type
INFAS
Building type (INFAS)-specific living area in district R5 Building type (INFAS)-specific living area in district R5
Living area in district per INFAS-type R4 Living area in district per INFAS-typeLiving area in district per INFAS-type R4
Ratio of living area per district and DESTATIS-class 2)
Federal Office of Statistics Ratio of living area per district and DESTATIS-class 2)
Federal Office of Statistics
D20
Total living area per district BBR (INKAR) Total living area per district
BBR (INKAR) D21 R3 * D20 * D21 R3 * D20 * D21 R1 / R2 R1 / R2 R3
Ratio of flats in district per INFAS-type INFAS, Stat. Bundesamt (DESTATIS) and
assumptions R3
Ratio of flats in district per INFAS-type INFAS, Stat. Bundesamt (DESTATIS) and
assumptions
Ratio of flats in district per INFAS-type INFAS, Stat. Bundesamt (DESTATIS) and
assumptions Number of flats per district and INFAS-type 1)
INFAS and assumptions Number of flats per district and INFAS-type 1)
INFAS and assumptions
Number of flats in district 2) INFAS and assumptions
R1 R2
R7 Intermediate result: Living area per community, INFAS-type and INFAS-quality-class R7 Intermediate result: Living area per community, Intermediate result: Living area per community, INFAS-type and INFAS-quality-classINFAS-type and INFAS-quality-class
D24 Allocation from D24 to R6 under assumption of equal distribution Allocation from D24 to R6 under assumption of equal distribution Aggregated INFAS-quality-classes 3) INFAS Aggregated INFAS-quality-classes 3) INFAS
Living area per community and INFAS-type Living area per community and INFAS-type R6
Number of buildings per community and INFAS-type
INFAS
Number of buildings per community and INFAS-type INFAS D23 R4 / D22 R4 / D22 R5 * D23 R5 * D23
Living area in community per INFAS-type, INFAS-quality-class, NHK-subtype and NHK-quality-type
R8
Replacement costs per community (without correction-factor for community size and state)
R9 Standard construction costs per NHK-subtype
and NHK-quality-type NHK 2000
D27
Share of additional costs per subtype
NHK 2000 D28 R8 * D27 * (1+D28) * D29 D25 NHK-types, NHK-quality-types NHK 2000 Allocation from D25 and D24 to R7
Final result: Replacement costs per community and inhabitant D31
INFAS
Number of inhabitants per community
R9 * D30 / D31 R10 D26 Share of NHK-subtype per INFAS-type
Inquiry of the GFZ Potsdam
D29 Correction of gross floor area / living area
NHK 1995
D30 Correction-factor for the state of
Baden-Württemberg NHK 2000
Living area in community per INFAS-type, INFAS-quality-class, NHK-subtype and NHK-quality-type
R8 Living area in community per INFAS-type, INFAS-quality-class, NHK-subtype and NHK-quality-type
Living area in community per INFAS-type, INFAS-quality-class, NHK-subtype and NHK-quality-type
R8
Replacement costs per community (without correction-factor for community size and state)
R9 Replacement costs per community (without correction-factorfor community size and state) R9
R9 Standard construction costs per NHK-subtype
and NHK-quality-type NHK 2000
Standard construction costs per NHK-subtype and NHK-quality-type
NHK 2000
D27
Share of additional costs per subtype NHK 2000
Share of additional costs per subtype
NHK 2000 D28 R8 * D27 * (1+D28) * D29 R8 * D27 * (1+D28) * D29 D25 NHK-types, NHK-quality-types NHK 2000 NHK-types, NHK-quality-types NHK 2000 Allocation from D25 and D24 to R7 Allocation from D25 and D24 to R7
Final result: Replacement costs per community and inhabitant Final result: Replacement costs per community and inhabitant
D31 INFAS
Number of inhabitants per community
INFAS
Number of inhabitants per community
R9 * D30 / D31 R9 * D30 / D31 R10 D26 Share of NHK-subtype per INFAS-type
Inquiry of the GFZ Potsdam Share of NHK-subtype per INFAS-type Inquiry of the GFZ Potsdam
D29 Correction of gross floor area / living area
NHK 1995
Correction of gross floor area / living area NHK 1995
D30 Correction-factor for the state of
Baden-Württemberg NHK 2000
Correction-factor for the state of Baden-Württemberg
NHK 2000
Table 4. Results for replacement costs and living area per inhabitant for Germany and some major cities and rural communities. Region/city Inhabitants according to (INFAS) Average re-placement costs per inhabitant [EUR] Average re-placement costs per living area [EUR/m2]
Average liv-ing area per inhabitant [m2] Average number of inhabitants per residential building Germany 82 440 307 46 601 1180 39.5 4.2 Berlin 3 388 434 66 665 1745 38.2 9.8 Munich 1 227 958 60 433 1550 39.0 8.9 Hamburg 1 726 363 57 574 1622 35.5 6.8 Stuttgart 587 152 49 000 1339 36.6 7.4 Cologne 967 940 49 176 1318 37.3 6.8 Dresden 478 631 54 039 1415 38.2 9.0 Rural communities Aldenhoven 13 911 33 683 1053 32.0 3.9 Templin 13 843 35 309 1169 30.2 5.2 Timmendorfer Strand 8956 56 646 1037 54.6 2.8 Lichtenstein 9460 46 390 1180 39.3 3.6 Offenau 2734 48 755 1172 41.6 3.7
Stage 2: Calculation of the specific reconstruction costs per community and per inhabitant
The living areas per INFAS building type, quality and community are now subdivided into living areas per NHK-type with the help of the sample data mentioned above. By using specific correction factors for the conversion of living area into gross floor area stemming from BMBRS (1997) and by taking into consideration incidental construction costs as well as correction factors for the federal states and for the community size as presented in BMVBW (2001), the standardized (re-)construction costs per NHK-type and community are calculated. These values are then re-aggregated to INFAS-building types. By summing up the reconstruction costs for all residential buildings of a community we obtain the total reconstruction costs per community. The formula for the total reconstruction costs per community is as follows:
RCc=
X
i,j
LAc,i,j×GF Si×N H Ki,j ×(1 + Anci) (1)
with
RC: Reconstruction costs
c: Community Index c ∈ {1, ..., 13415} i: Index of NHK building types i ∈ {1, ..., 38} j: Index of NHK quality class j ∈ {1, ..., 4}
LA: Living area in m2stemming from stage 1 of the estima-tion process
GFS: Type-specific conversion factor between living area and gross floor space
NHK: Type-specific construction costs per m2 gross floor space
Anc: Incidental construction costs
Specific reconstruction costs per region are obtained by dividing the total costs by the number of inhabitants and the total living area per community, respectively.
3 Results and discussion
The results of the asset estimation of residential buildings in Germany yield an average value of EUR 46 600 per in-habitant (Table 4), which seems to be a realistic value ac-cording to expert judgements. Total replacement costs for all residential buildings in Germany are estimated to be some EUR 3842 billion. For validation purposes, this figure can be compared with the official data on the “gross asset value of residential properties at replacement costs” published by the Federal Statistical Agency of Germany, which is derived from the gross asset investments by an accumulation method. For the reference year 2000, the official value amounts to EUR 4485 billion. Thus, the estimated replacement costs add up to 86% of the value from official statistics for Germany. Considering the differences in the calculation process and the data involved, this seems to be a reasonably good achieve-ment, especially since the value from official statistics also includes the cumulated costs associated with the conveyance of real estate and is therefore a little too high.
The average living area per inhabitant is 39.5 m2. In con-trary to the estimation of the reconstruction costs, this value can be deducted directly from the official statistics on popula-tion and living areas. The number of inhabitants per residen-tial building, stemming from the INFAS data, averages 4.2 for Germany as a whole. This value is significantly higher in the bigger cities and generally lower in rural areas. In line with these data, the average living area per inhabitant in the bigger cities is lower than the average values while
0 500 1000 1500 2000 2500 3000 3500 500 0 100 00 150 00 200 00 250 00 300 00 350 00 400 00 450 00 500 00 550 00 600 00 650 00 700 00 750 00 800 00 850 00 900 00 950 00 100 000 max upper limit per class [per capita value in Euro]
Number of communities
Fig. 2. Frequency distribution of the reconstruction costs of residential buildings per community and inhabitant for Germany.
their replacement costs per capita are above average. This is mainly due to higher construction costs in the cities and a higher share of the more expensive building types. On the other hand, for relatively wealthy villages or small communi-ties that dispose a significant tourism industry like e.g. Tim-mendorfer Strand (Table 4), the calculation yields per-capita costs that are also well above the average, which is a plausi-ble result.
In Fig. 2 the frequency distribution of the replacement costs per capita is given. The values follow roughly a normal distribution, but feature a slightly positive skewness. This can partly be traced back to the existence of few big cities, which count as one single community with accordingly high replacement costs compared to a relatively high number of small cities and villages with generally lower building val-ues per capita (see also Table 4).
However, this asymmetry between the number of small and the number of big communities alone cannot explain all extreme values that occur at community level. Rather, they have to be traced back at least partly to errors in the data sources. In fact, a closer examination of the databases shows that a couple of small communities with low popula-tion contain, according to the input data, a very low number of residential buildings. Since it can be expected that the in-formation on municipal population is more reliable than the data on the number of buildings, it must be concluded that there are some errors in the INFAS database. Because of
the method of calculation, the total living area as well as the per-capita living area per building is fixed for each district. Consequently, extremely low numbers of buildings for some communities lead to an overestimation of the living areas in other communities of the same district. To a certain degree, this linkage explains the existence of some small communi-ties with very high replacement costs per inhabitant. In a few other cases, data inconsistencies lead to a relative high num-ber of buildings in communities with a very low numnum-ber of inhabitants.
Another reason for the relative high amplitude of diver-gence in the specific costs are some inconsistencies of the INFAS data with the official statistics with regard to the num-ber of buildings for the various building types. In order to achieve high data quality, official statistical data were used where possible throughout the estimation process. This data is supplemented by the commercial census data of INFAS, sample data (Thieken et al., 2005, Kreibich et al., 2005) and own assumptions. Although every data source contributes information that does not conflict with the information pro-vided by the other sources, one important coherence issue could be identified. While the approach chosen uses data from the Federal Statistical Office of Germany only with re-spect to the total living area per district, the same source also provides data on the number of buildings per district in a dif-ferentiation of three building types. Since the INFAS data on the number of buildings is much more detailed and available
on the disaggregated municipal level, this data from the Fed-eral Statistical Office was not used in the calculation. How-ever, a comparison of the number of residential buildings for each of the data sources reveals significant differences, when applied to the whole of Germany. While the total number of residential buildings according to INFAS census data ex-ceeds the respective number according to the official statis-tics by some 13.5%, the number of residential buildings with more than two flats in this data set is approximately 14% be-low the values presented by the official statistics. Thus, the assessment approach applied assigns a smaller amount of the total living area to multi-flat buildings compared to a hypo-thetical alternative approach using only the official statistics. Unfortunately, such approach would loose the information included in the more detailed and disaggregated INFAS data set. Thus, this inconsistency is a potential source for errors that cannot be easily overcome. As a consequence, the total living area assigned to a community with a significant higher share of multi-flat buildings than the other communities of the same district may be too low. The data incoherence is well known by the data provider of the census data but up to now its source could not be identified. Thus, there is no way of coping with it than by loosing other information.
Finally, it should be mentioned that another source for overestimating the variability of specific replacement costs lies in the fact that average flat sizes per building type as well as the average number of flats per multi-family/apartment buildings may, contrary to the assumptions made in the es-timation process, vary between the communities of a given district.
A possible future strategy to reduce the effects of obvious errors in the data sources could include the identification of upper and lower limits for the allowed living area per capita that is then used to recalculate the distribution of living area between the building types and the communities of each dis-trict accordingly.
In Fig. 3, the individual share of each building type of the total living area is presented for Germany. It shows that 1-and 2-family homes account with more than 45% for the highest share of the overall living area. Multi-apartment buildings as family dwellings, multi-storey buildings and apartment buildings account for approximately 42% of the total volume. This result is in line with the findings of other studies stating that small buildings usually comprise more than half of the capital value of all buildings and are occu-pied by more people than large buildings for most of the time (Walker, 1987, in Blong, 2003a).
While the geographical distribution of the total building values per community (see Fig. 4) reproduces to a great ex-tent the distribution of population in Germany, the infor-mation provided on per-capita replacement costs (Fig. 5) in the communities reveals significant differences across the re-gions. Most notably, high per-capita values are located in the bigger cities. Furthermore, there are striking differences between the southern and northern parts as well as between
share of resendential building types of total living area in Germany 45,1% 11,5% 16,8% 22,5% 2,5% 0,3% 1,3% 1/2-family homes row/duplex houses multi-family-homes blocks of flats appartment buildings/ multi-storey houses terrace houses farmhouses
Fig. 3. Share of residential building types of total living area in
Germany.
the western and eastern regions of Germany. The replace-ment costs per inhabitant are higher in the southwestern and southern parts of Germany and significantly lower in north-ern Germany and in the new federal states, except for Berlin and, to a lower degree, Hamburg. This observation is in line with the higher economic potential of the southern and south-western regions of Germany.
4 Conclusions and outlook
The work performed provides a uniform database on the reconstruction costs of potentially risk-exposed residential buildings in Germany on the community level. This is es-sential for consistent comparisons of different risks on a re-gional scale. For loss estimations the presented assets have to be intersected with hazard maps and loss modelling has to be applied. For this task, often a more detailed spatial dis-tribution of the assets is necessary. As shown by Thieken et al. (2006) this is done on the basis of the CORINE land cover data set and a dasymetric mapping approach.
Since official data sets, which will be adjusted on a regu-lar basis, were used in this study, keeping the estimations of building values up to date is easily possible. The estimates for the reference year 2000 can be transferred to other years by means of construction price indices.
The results of the calculation process shed light on the quantitative differences of the per-capita-value of residential buildings between rural and metropolitan areas, wealthy and poor communities as well as on systematic differences be-tween the larger regions of Germany. The results also in-clude community-specific information on the reconstruction costs per square meter living area and on the living area per inhabitant. The approach chosen ensures that the total living area per district matches the values from the official statistics.
Per-capita value of residential
building asset [Euro/Inhabitant]
0 - 20000
20001 - 40000
40001 - 60000
60001 - 80000
80001 - 100000
100001 - 247462
100 0 100 kmFig. 4. Total values (reconstruction costs) of residential buildings for the communities in Germany.
In order to validate the found results, the total reconstruc-tion costs calculated for Germany were compared with of-ficial data on the gross asset value of residential properties provided by the Federal Statistical Office of Germany in the framework of national accounting. The calculated costs for the reference year 2000 average EUR 3842 billion, which is 86% of the official amount published, which seems to be a satisfying achievement considering that the official number is, because of the applied method of calculation, probably a little too high. Nonetheless, there are still some sources of errors. Most notably, these include the lacking information about the size of the multi-storey buildings in the census data and a certain data incoherency between the census data and the official data set that could not be overcome completely.
However, a possible future strategy for the reduction of the negative effects resulting from these error sources has been drafted above.
With regard to risk management the presented results can be used for several purposes:
The inventory can be linked to risk management via information technology such as the “CEDIM Risk Explorer” (cf. M¨uller et al., 20061) or deNIS, the German emergency preparedness information system
1M¨uller, M., Vorogushyn, S., Maier, P., Thieken, A. H., Petrow,
Th., Kron, A., B¨uchele, B., and W¨achter, J.: “CEDIM Risk Ex-plorer” – A Map Server Solution in the Project ,,Risk Map Ger-many”, Nat. Hazards Earth Syst. Sci., submitted, 2006.
Per-capita value of residential
building asset [Euro/Inhabitant]
0 - 20000
20001 - 40000
40001 - 60000
60001 - 80000
80001 - 100000
100001 - 247462
100 0 100 kmFig. 5. Per-capita values (reconstruction costs) of residential buildings for the communities in Germany.
(deutsches Notfallvorsorge-Informationssystem, cf. http://www.denis.bund.de/). The estimation of building values as part of total loss potential is an important input for mitigation planning, whether for individual households or for authorities: It fills the existing information gaps on the community level by indicating the cost of reconstruction after disastrous events. This information can be aggregated for a specific regional focus of analysis, or for statewide or federal planning necessities. It facilitates financial risk management, including insurance considerations. At the same time, it might foster a dialogue between different stakeholders from the public and private sectors in order to develop new strategies for reducing losses from future
disasters. Moreover, estimating building values is a first step in the assessment of further economic and social effects of catastrophes.
It is conceivable that professional risk managers in (re)insurance companies can take advantage of building value estimations like the one presented here. Data on in-sured values is sometimes incomplete, especially on the com-munity level, and even more on the individual address level. Our estimations might be used for the assessment of accumu-lations of exposure regarding damages to residential build-ings.
Acknowledgements. This work is part of the project “Risk Map
Reduction Technology (http://www.cedim.de), a joint venture between the GeoForschungszentrum Potsdam (GFZ) and the Tech-nical University of Karlsruhe (TH). We thank the GFZ Potsdam and the TH Karlsruhe for financial support. We are indebted to T. L¨utzkendorf, D. Lorenz (Chair of Sustainable Management of Housing & Real Estate) and C. Ferrara (Institute for Industrial Building Production) for providing us with first-hand knowledge on the advantages and disadvantages of various ways to assess building values. The paper has benefited from the comments of three referees.
Edited by: H. Kreibich Reviewed by: three referees
References
BBR (Bundesamt f¨ur Bauwesen und Raumordnung): INKAR 2003 – Indikatoren und Karten zur Raumentwicklung 2003, CD-ROM, Bonn, 2003.
Blong, R.: A review of damage intensity scales, Nat. Hazards, 29, 57–76, 2003a.
Blong, R.: A new damage index, Nat. Hazards, 30(1), 1–23, 2003b. BMBRS (Bundesministerium f¨ur Bauwesen, Raumordnung und St¨adtebau): Normalherstellungskosten 1995 (NHK 1995), Bonn, 1997.
BMVBW (Bundesministerium f¨ur Verkehr, Bau und Wohnungswe-sen): Normalherstellungskosten 2000 (NHK 2000), Berlin, 2001.
BMVBW (Bundesministerium f¨ur Verkehr, Bau und Wohnungswe-sen): Wertermittlungsrichtlinien 2002 (WertR 2002), Berlin, 2002.
CEDIM: Terms and definitions in risk science, available at: http://www.rz.uni-karlsruhe.de/∼gd202/www.cedim/english/
seite 16.php, 2005.
Crichton, D.: The Risk Triangle, in: Natural Disaster Management, edited by: Ingleton, J., Tudor Rose, London, 102–103, 1999. Dutta, D., Herath, S., and Musiake, K.: A mathematical model for
flood loss estimation, J. Hydrol., 277, 24–49, 2003.
Gr¨unthal, G., Thieken, A. H,, Schwarz, J., Radtke, K., Smolka, A., and Merz, B.: Comparative risk assessment for the city of Cologne, Germany – storms, floods, earthquakes, Nat. Hazards, 38(1–2), 21–44, 2006.
ICPR (International Commission for the Protection of the Rhine): Rhine Atlas 2001, Koblenz, 2001.
INFAS GEOdaten GmbH: Das DataWherehouse, Bonn, December 2001.
Kaplan, S. and Garrick, B. J.: On the quantitative definition of risk, Risk Analysis, 1(1), 11–27, 1981.
Kreibich, H., Thieken, A. H., Petrow, Th., M¨uller, M., and Merz, B.: Flood loss reduction of private households due to building retrofitting – Lessons learned from the Elbe floods in August 2002, Nat. Hazards Earth Syst. Sci., 5, 117–126, 2005.
Merz, B. and Thieken, A. H.: Flood risk analysis: Concepts and challenges, ¨Osterreichische Wasser- und Abfallwirtschaft, 56(3– 4), 27–34, 2004.
MURL (Ministerium f¨ur Umwelt, Raumordnung und Land-wirtschaft des Landes Nordrhein-Westfalen): Potentielle Hochwassersch¨aden am Rhein in Nordrhein-Westfalen, Final Report, 2000.
Parker, D. J., Thompson, P. M., and Green, C.: Urban flood protec-tion benefits: A project appraisal guide, 1987.
Penning-Rowsell, E., Johnson, C., Tunstall, S., Tapsell, S., Mor-ris, J., Chatterton, J., and Green, C.: The Benefits of Flood and Coastal Risk Management: A Handbook of Assesment Tech-niques, Middlesex University Press, 2006.
Federal Statistical Agency: GENESIS online, 3. Wohnen, Umwelt, https://www-genesis.destatis.de, Wiesbaden, 2005.
Thieken, A. H., M¨uller, M., Kreibich, H., and Merz, B.: Flood damage and influencing factors: New insights from the August 2002 flood in Germany, Water Resour. Res., 41(12), W12430, doi:101029/2005WR004177, 2005.
Thieken, A. H., M¨uller, M., Kleist, L., Seifert, I., Borst, D., and Werner, U.: Regionalisation of asset values for risk analyses, Nat. Hazards Earth Syst. Sci., 6, 167–178, 2006.
Van der Veen, A. and Logtmeijer, Ch.: Economis hotspots: Visual-izing Vulnerability to Flooding, Nat. Hazards, 36, 65–80, 2005.