Publisher’s version / Version de l'éditeur:
Canadian Geotechnical Journal, 23, 3, pp. 334-340, 1986-08
READ THESE TERMS AND CONDITIONS CAREFULLY BEFORE USING THIS WEBSITE. https://nrc-publications.canada.ca/eng/copyright
Vous avez des questions? Nous pouvons vous aider. Pour communiquer directement avec un auteur, consultez la première page de la revue dans laquelle son article a été publié afin de trouver ses coordonnées. Si vous n’arrivez pas à les repérer, communiquez avec nous à PublicationsArchive-ArchivesPublications@nrc-cnrc.gc.ca.
Questions? Contact the NRC Publications Archive team at
PublicationsArchive-ArchivesPublications@nrc-cnrc.gc.ca. If you wish to email the authors directly, please see the first page of the publication for their contact information.
NRC Publications Archive
Archives des publications du CNRC
This publication could be one of several versions: author’s original, accepted manuscript or the publisher’s version. / La version de cette publication peut être l’une des suivantes : la version prépublication de l’auteur, la version acceptée du manuscrit ou la version de l’éditeur.
Access and use of this website and the material on it are subject to the Terms and Conditions set forth at
Ice lensing in layered soils
Penner, E.
https://publications-cnrc.canada.ca/fra/droits
L’accès à ce site Web et l’utilisation de son contenu sont assujettis aux conditions présentées dans le site LISEZ CES CONDITIONS ATTENTIVEMENT AVANT D’UTILISER CE SITE WEB.
NRC Publications Record / Notice d'Archives des publications de CNRC:
https://nrc-publications.canada.ca/eng/view/object/?id=6127e783-7cf3-41c1-9ada-932e583fd299 https://publications-cnrc.canada.ca/fra/voir/objet/?id=6127e783-7cf3-41c1-9ada-932e583fd299-
National Research
Consell national
ser
St
council Canada
TH1
de
reGherches
Canada
PJ2ld
Institute for
lnstitut de
no.
142.9
Research in
recherche en
c. 2
Construction
construction
BWll
Ice Lensing in Layered Soils
by E. Penner
Reprinted from
Canadian Geotechnical Journal
Vol. 23, No. 3, August 1986
p. 334
-
340
(IRC Paper No. 1419)
Price $2.00
NRCC 26642
NRC
-
CISTIT h i s p a p e r i s b e i n g d i s t r i b u t e d i n r e p r i n t form by t h e I n s t i t u t e f o r R e s e a r c h i n C o n s t r u c t i o n . A l i s t of b u i l d i n g p r a c t i c e and r e s e a r c h p u b l i c a t i o n s a v a i l a b l e from t h e I n s t i t u t e may be o b t a i n e d by w r i t i n g t o t h e ~ u b l i c a t i b n s S e c t i o n , I n s t i t u t e f o r R e s e a r c h i n C o n s t r u c t i o n , N a t i o n a l Research C o u n c i l of C a n a d a , O t t a w a , O n t a r i o , K1A 0R6. Ce document e s t d i s t r i b u 6 s o u s forme de t i r 6 - 8 - p a r t p a r 1 ' I n s t i t u t de r e c h e r c h e e n c o n s t r u c t i o n . On p e u t o b t e n i r une l i s t e d e s p u b l i c a t i o n s d e l ' l n s t i t u t p o r t a n t s u r les t e c h n i q u e s ou l e s r e c h e r c h e s e n m a t i e r e d e b h t i m e n t e n 6 c r i v a n t 3 l a S e c t i o n d e s p u b l i c a t i o - - z - - a c o n s t r f r e c h e r c KlA OR6
Ice lensing in layered soils
EDWARD PENNER
Division of Building Research, National Research Council of Canada, Ottawa, Ont., Canada K I A OR6 Received September 23, 1985
Accepted March 5, 1986
The ice lensing phenomenon in layered soils, a condition that simulates the process of ice growth in varved soils, has been studied experimentally. Under the limited conditions of layer thicknesses, soils used, freezing rates, and moisture conditions, ice lenses formed at the face of the fine-textured (clay) layer when it was encountered by the freezing plane. Only minor heaving occurred in the coarse-textured (silt) layer when its thickness,was increased.
Key words: frost action, ice lensing, frost heaving, varved soils, layered soils.
Le phCnomkne de formation de lentilles de glace a CtC CtudiC dans des sols multi-couches, condition qui favorise le processus de croissance de glace dans les sols varvts. Sous les conditions IimitCes des Cpaisseurs de couches, des sols utilists, des vitesses de pknetration de gel, et des conditions d'humiditC, des lentilles de glace se sont formCes a la surface de la couche de sol a grains fins (agile) lorsqu'elle ttait traversCe par le front de gel. Seulement un soul&vement mineur se produisait dans la couche grains grossiers (silt) lorsque son Cpaissew Ctait augmentCe.
Mots clis : action du gel, formation de lentilles de glace, soultvement dii au gel, sols varvCs, sols multi-couches. [Traduit par la revue]
Can. Geotech. J . 23. 334-340 (1986)
Introduction
During previous permafrost investigations in northern Manit- oba, a number of profiles consisting of ice-rich varved sediments were examined (Johnston et al. 1963). The conclusion from this study was that "there was no apparent relation between the location of ice lenses and the soil varves." Russian papers reviewed on the subject of varved clays in permafrost regions (Zhestkova 1963; Shpolyanskaya 1965) refer to the extensive horizontal ice lensing between soil layers and the crystal orientation of the ice, but do not give information about any preferred positioning of the ice in relation to the layers.
Soil samples of alternating silt and clay layers were prepared for a laboratory study of ice lens formation in layered soil. The samples were intended to simulate the annual structure of varved clays, a well-known glacial soil deposit found extensively in Canada.
The complexity of the geological history of varved sediments (Eden 1955) and the postdepositional freezing and moisture regime make any attempt at simulation somewhat tenuous. The results of these simulation studies are however, not only of interest in attempting to unravel the ice lensing phenomenon in varved soil deposits but are also helpful in elucidating the behaviour of ice lensing in soils generally. These studies became possible because of recent improvements in equipment and techniques for freezing soils in the laboratory (Penner
1985).
Materials and methods
Soil sample preparation
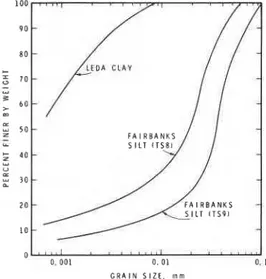
The two soil types used in the preparation of the layered samples were Leda clay for the clay layers and a 50150 mix of two samples of Fairbanks silt for the coarser silt layers. The grain size curves are given in Fig. 1. The method of preparation was to add sufficient water to the soil so that the moisture content would be well above the liquid limit-72% for the clay and 52% for the silty soil. The soils were then placed in alternating layers in the frost cell using a large medical syringe. Sample 1 was prepared by using about 60cm3 of the coarse- grained soil (silt layer) and 27 cm3 of the fine-grained soil (clay layer) for each composite layer. For sample 2 the volume of coarse-grained soil was increased to 142 cm3; the fine-grained soil volume was kept at 27 cm3.
F A I R B A N K S 2 0 F A I R B A N K S 1 0 O L , " ' I I I 0 , 0 0 1 0. 0 1 0. I G R A I N S I Z E . m m
FIG. 1. Grain size analyses of soils used.
Small metal markers ( 1 1 mm diameter brass washers, 0.82 mm in thickness) were aboverand below each clay layer so that the layers could be easily identified in the X-ray photographs. In sample 1 a total of 12 composite layers was I
used, resulting in a height of about 96.0 mm after consolidation under a stress of 500 kPa (in stages). The after-consolidation I thickness of the clay layers was about 2.5 mm and of the silt
~
layers, about 5.5 mm. In the second sample the clay layers were the same thickness as in the first sample but the silt layers werei
made much thicker (after-consolidation thickness of 13 mm). Because of the added thickness of the silt layers, the number ofI
layers of each type was reduced to six, giving a total height of 93.0 mm after consolidation.Frost cell andfreezing technique
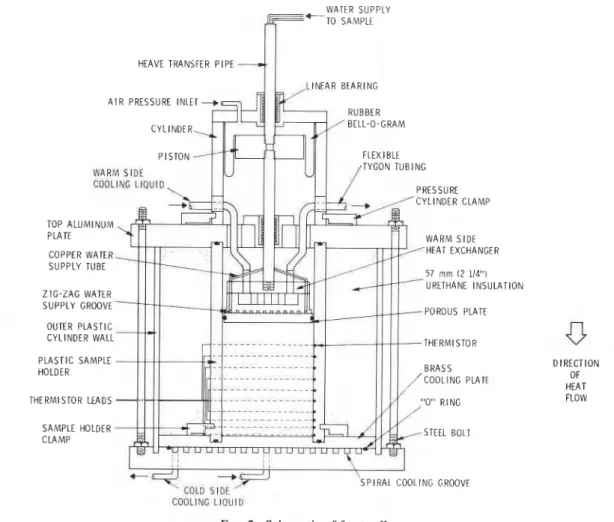
The frost cell used (Fig. 2) and the temperature control of the ramp freezing process of the sample, along with the X-ray technique, have been described in detail elsewhere (Penner 1986). The design of the frost cell used in these experiments is similar to the model designed by W. Slusarchuk at Northern Engineering Services in Calgary, Alberta; it has been modified ( P e ~ e r and Ueda 1977) by a basic change in the application of overburden pressure and by the addition of temperature-
PENNER
WATER SUPPLY -TO SAMPLE
HEAVE TRANSFER P I P E
-ti
L I N E A R BEARING A I R PRESSURE INLET RUBBER CYLINDER BELL-0-GRAM P I S T O N FLEXIBLE WGRM SIDE /TYGON D I R E C T I O N OF HEAT FLOW I + S P I R A L COOLING GROOVE
FIG. 2. Schematic of frost cell. controlled exchangers at both ends of the lOcm long sample.
The external water supply in all cases was held level with the porous plate inside the cell. The vertical stress on the sample was 50 kPa and the frictional component during heaving was estimated at 25 kPa. The initial thermal condition to which the sample was equilibrated overnight was -0.25"C at the cold end (bottom of sample) and +0.6"C at the warm end (top of sample). After crystallization was induced to start the heaving of the sample, the latent heat of freezing increased to some extent the temperature of the cold side but this was quickly , brought down to the starting temperature by the circulating fluid. Water intake and heaving measurements were estimated to be accurate to
+
0.0 1 mm (in terms of heave) and k0.002 mm I displacement, respectively.,
Freezing in all cases was from the bottom of the sample. It is important to appreciate this when interpreting the location of the ice lens formation with respect to the position of the different soil layers in the X-ray photographs. From measured temperat- ure gradients in the sample and the position of the ice lens (determined by X-rays), it was possible to determine the temperature of the growing face of the ice lens as heaving was taking place.The temperature ramp freezing rate1 used for sample 1 was reduced from 0.05 to 0 .Ol°C/d midway through the experiment (Fig. 3). For sample 2 the freezing rates were changed more frequently, ranging again from 0.01 to 0.05"C/d, but in four equal steps. A final ramping rate of 0.015"C/d completed the freezing program for sample 2 (Fig. 4). The different ramping
h he temperature ramp freezing technique involves lowering the
temperature at both ends of the sample at a uniform rate.
WARM E N D
w
TIME, h
FIG. 3. End temperatures during the freezing of sample No. 1, as a function of time.
rates and soil layer thicknesses selected were intended to provide a range of conditions for ice lenses to form in different parts of the system. The frost penetration rates achieved by the imposed ramping rates ranged from 2 to 5 rnm/d. The similarity of these rates to actual field conditions would depend on the weather, the depth below ground surface that freezing was taking place, soil type, and geographic location.
Results and discussion
Sample 1
336 CAN. GEOTECH. 1. VOL. 23, 1986
I , ,
1 . 'anirod
FIG. 4. End temperatures during the freezing of sample No. 2, as a
function of time. .. .
0 . 8 1 . 0 .
WARM 1 2 0 I I 1 ' I '
END TEMPERATURE R A M P I N G RATE
0. 05"Cld 0, OI"C/d / -
-
nmnc(d . L ~ A R M t H P-
' 1 . I . I . I . 1 0 0 200 300 400 500 6 0 0 E c COLD END - L \-
amsc/d -w!cL-
TIMPERCUR-
- RAMPING R A E-
@. UZ0G/d-
0.01 cld I-
h - L ~ I I L O END--
T I M E , h T I M E , h-
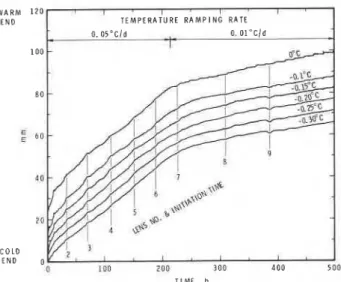
/FIG. 6 . Isotherms between 0 and -0.3"C as a function of time, sample No. 1.
- WATER INTAKE HEAVE
T I M E , h
FIG. 5. Total heave and water intake heave as a function of time, sample No. 1.
given in Fig. 5 for sample 1, including the number of the ice lens, the time of its formation, the X-ray number, and the ramping rate. The time associated with each lens formed can be seen from the length of the humps on the heave curves. Figure 6 gives the isotherms in the sample in steps ranging from 0.0 to -0.30°C for the complete run. The time at which each lens started growing is given by the deflection of the isotherm, and its position is indicated on the graph by the assigned number of the lens. Lens initiation caused a temporary deflection in the isotherm curves since there was a short period of rapid latent heat release when a new lens was initiated.
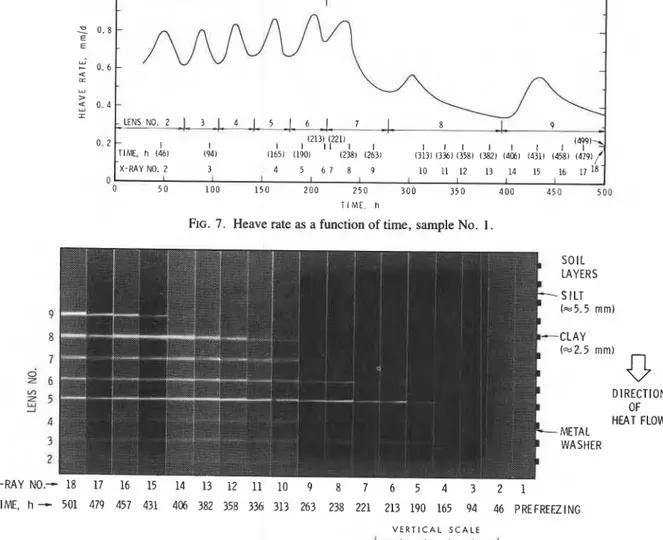
Figure 7 shows the changing total heave rate during the experiment resulting from the lensing phenomenon; these rates correspond to the humps in the curves of Fig. 5 and the deflections in the curves of Fig. 6. Finally, Fig. 8 contains the
although it can be seen clearly in the X-ray negatives. All the remaining lenses are fairly clear. In the lighter prints, e.g., X-ray Nos. 10- 14, the thickness of the clay layers can be clearly seen, although on close examination the clay layers are discernible on all the prints. In all cases, the ice lens formed as the freezing plane encountered the dark (clay) soil layer. As freezing was from the bottom of the sample upwards, the ice lenses are in contact with the bottom of the dark layer. The direction of heat flow is indicated in the figure.
Sample 2
The structural difference between samples 1 and 2 was in the thickness of the silt layers. As stated previously, this difference in thickness plus the additional freezing rates used provided a wider range of conditions for variations in ice lens positioning in the layered soil systems.
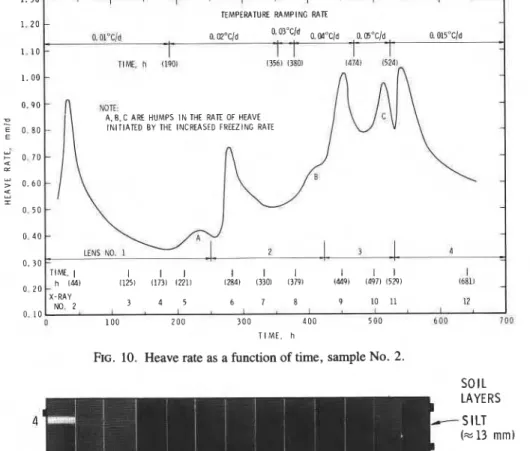
The total heave and water intake heave curves, as a function of time, are shown in Fig. 9 for sample 2. The ramping rate changes, the location of the lenses, and times of the X-rays are all given on the graph. The increases and decreases of heave rate during the formation of the ice lenses are seen as humps on the curves of Fig. 9. Characteristic of the growth rate curves, shown in Fig. 10, are the relatively rapid growth rate increases to a maximum after the lens was initiated and a slow tailing off on the decrease side of the maximum. The small bumps at locations, A, B, and C were induced by ramp rate increases and, of course, coincide as shown with the times of the ramping rate changes.
Finally, Fig. 11 contains the positive prints of the 12 X-rays taken and all verify that the major portion of the heave can be identified with the ice lenses interfacing with the clay layers as in sample 1. Some minute lenses could be observed in the thick layers of silt in the X-ray negatives of sample 2 but the main movement could be attributed to the extensive lenses that developed when the active freezing plane, proceeding from the bottom of the sample upwards, encountered the clay layers.
I
. -
positive prints of the X-rays taken while heaving was in progress Ice lensing process in layered samples
to show the location of the lenses with respect to the soil layers. The experimental results obtained in this study are not X-ray No. 1 is a portion of the prefreezing X-ray, where the sufficiently encompassing to apply to all the freezing and metal markers were located in the sample to show clearly the moisture conditions that might occur in the field for all types of location of the layers with respect to the ice features. The ice layered deposits. The results do give insight, however, into the lens marked No. 2 does not show up well in the positive prints, nature of ice lensing in simple layered soil systems and, together
PENNER X-RAY T I ME, 1. 2 , 4 I I I I ! I I I TEMPERATURE R A M P I N G RATE X-RAY NO. 2 3 4 5 6 7 8 9 10 11 12 13 14 6 16 17 0 I I I I I 0 5 0 1 0 0 1 5 0 2 0 0 2 5 0 3 0 0 35 0 4 0 0 4 5 0 500 T I M E , h
FIG. 7. Heave rate as a function of time, sample No. 1
SOIL LAYERS - S I L T k 5 . 5 mr
-
METAL WASHER - 1 8 17 16 15 14 13 12 11 10 9 8 7 6 5 4 3 2 1 501 479 457 431 406 382 358 336 313 263 238 221 213 190 165 94 46 PREFRI V E R T I C A L S C A L E IRECTION OF EAT FLOWFIG. 8. Positive prints of X-rays for sample No. 1, containing closely spaced clay layers.
-
WATER INTAKE HEAVE--- TOTAL HEAVE
l b
-
C 100 200 300 400 500 600 700 TIME, h
FIG. 9. Total heave and water intake heave as a function of time,
sample No. 2.
with other information found in the literature, enable a preliminary scenario to be developed based on experimental evidence.
It is now known that in frost-susceptible soils, when heave is produced by substantial rhythmic ice lens development, there is an ice lens initiation temperature (LIT) and an ice lens
termination temperature (LTT) (Penner 1986). Both these temperatures are known to be freezing rate dependent, i.e., the faster the rate of freezing the lower the temperature for both LIT and LTT. This trend can be seen both in the previous paper (Penner 1986) and in the results shown here for sample 1 at two rates (Table 1). Unfortunately, in experiment 1, the time of the X-ray did not necessarily coincide exactly with lens initiation or termination because the importance of the timing was not realized. The pattern of the temperature changes, however, is well documented in Table 1.
The suction and (or) pressure developed by the lensing process is also dependent on the porelgrain size of the soil at similar moisture and freezing conditions (Everett 1961; Penner 1967); hence the temperature of ice lens growth is also dependent, on the porelgrain size.
To summarize what is known from previous work:
(a) Comparison of the ice lens LIT and LTT for two layers must be made at the same temperature ramping rate or other external freezing conditions because both are freezing rate dependent. The overburden pressure must also be the same as it was in these experiments.
(b) Fine-grained soils have lower ice lens growth temperatures (LIT and LTT) than coarse-grained soils.
CAN. GEOTECH. J . VOL. 23, 1986 1 . 3 0 1 I I I T - 1 1 TIME, I I I l I l l I I ) 11251 (1731 12711 1284) (3301 13791 (449) 1497) 15291 I 0 . 2 0 - I4'l) fall
-
X-RAY NO. 2 3 4 5 6 7 8 9 10 11 12 0. LO I 1 I 1 I I 1 0 0 200 3 0 0 400 5 0 0 6 0 0 1 0 0 T I M E , hFIG. 10. Heave rate as a function of time, sample No. 2.
SOIL
X-RAY NO.- 12 11 10 9 8 7 6 5 4 3 2 l ( b ) l ( a ) OF
TIME, h
--
641 529 497 449 379 330 284 221 173 125 44 PREFREEZ l NG HEAT FLOWV E R T I C A L S C A L E
FIG. 11. Positive prints of X-rays for sample No. 2, containing widely spaced clay layers.
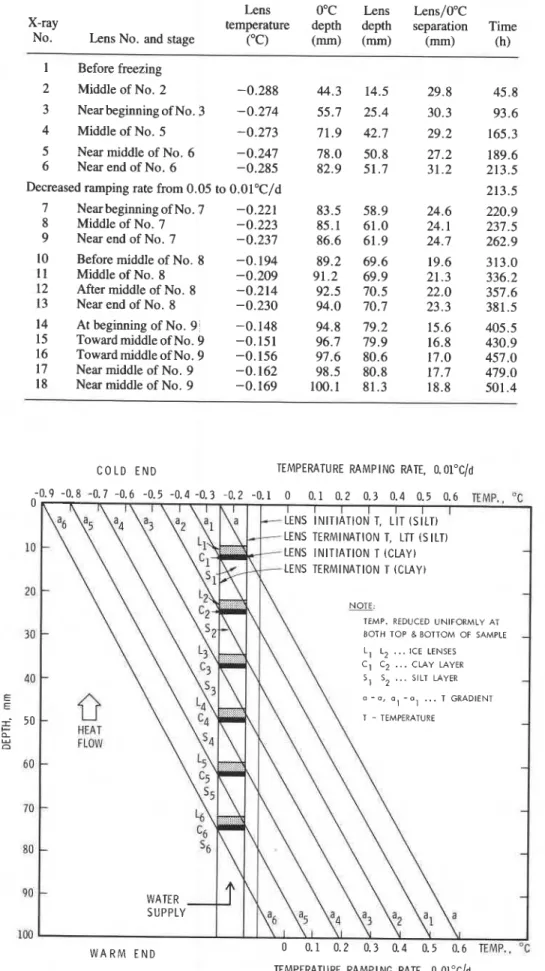
A lensing model illustrated in Fig. 12 has been developed on the basis of measured LIT and LTT for Leda clay at the ramping rate of O.Ol°C/d when it is part of a layered system with a coarse-grained soil such as is shown in Fig. 1. The LIT and the LTT are not available for the silty soil but the lens growth temperature has been measured in the one-step freezing mode at about the same overburden pressure as used here (Penner and Goodrich 1981) and found to be around -0.13"C. On this basis a value of -O.lO°C has been assigned to it for the LIT and -0.15"C for the LTT.
The LTT for Leda clay in the layered system configuration has been taken from the end of lens Nos. 7 and 8, Table 1, and is about -0.25"C; the LIT is taken from the start of lens No. 9, at -0.15"C, for illustration purposes.
The temperature gradients, a-a, al-al, etc. in Fig. 12, are from the experiments. The clay/silt layers are shown in vertical section, as are the ice lens locations. As in the experiments, the ice lenses lie above the dark layer when freezing is from the top downwards.
Starting with the location of the temperature gradient a-a, the temperature at the top of the clay layer is -0.15"C. An ice lens grows at this location until the temperature has dropped to -0.25"C, owing to the continual decrease of temperature at both ends of the sample. The gradient is now at the position marked as al-al. The heat released as a result of the phase change is not sufficient to hold the temperature at -0.25OC at that ice lens, and hence that temperature becomes the L'IT. During the growth of the lens just terminated, the growth rate has risen to a maximum and decreased to a low rate at the end. The decreasing heave rate, which follows the theory of Miller (1977), is due to the continuously decreasing permeability as the temperature drops in the frozen fringe.
As the temperature decreases, the "freezing front" passes through the silt since the temperature is now well below the LTT of the silt; hence only the in situ water freezes. As the position of the temperature gradient al-al is established, the temperature at the claylice front is at -0.15OC once more; this is the LIT for the clay layer, and lens L2 starts to grow at an increasing rate
PENNER
TABLE 1 . Ice lens data, sample No. 1
Lens 0°C Lens Lens/O"C
X-ray temperature depth depth separation Time
No. Lens No. and stage ("c) (mm) (mm) (mm) (h)
1 Before freezing
2 Middle of No. 2 -0.288 44.3 14.5 29.8 45.8
3 Near beginning of No. 3 - 0.274
4 Middle of No. 5 -0.273
5 Near middle of No. 6 -0.247
6 Near end of No. 6 -0.285
Decreased ramping rate from 0.05 to O.Ol0C/d
7 Near beginning of No. 7 -0.221
8 Middle of No. 7 -0.223
9 Near end of No. 7 -0.237
Before middle of No. 8
Middle of No. 8 After middle of No. 8 Near end of No. 8 At beginning of No. 9 Toward middle of No. 9
Toward middle of No. 9
Near middle of No. 9 Near middle of No. 9
C O L D E N D TEMPERATURE RAMPING RATE, 0. Ol0C/d
TEMPERATURE RAMPING RATE, 0. 0l0c/d FIG. 12. Ice lensing process in two-layered sample of different grain sizes.
340 CAN. GEOTECH. J. VOL. 23, 1986
until a maximum is reached. In this way the pattern of growth and temperature changes is repeated for each lens as each clay layer is encountered. In the scenario presented here, after the ice lens starts to grow at the surface of the clay layer there is a period when temperatures in the silt layer are favourable for ice lenses to form (between -0.10 and -0.15"C). During this period, however, the silt layer is not only a part of the frozen fringe but also is in the active moisture transmission zone and at a high moisture suction level. This combination of conditions apparently impedes any significant ice lensing in the silt layers while the ice lens is actively growing on the clay layer. When the claylice interface temperature drops to -0.25OC, the complete silt layer is below the LTT for this particular silt. As shown previously (Penner 1986), when interlens water freezes this rapid heat release can be seen in the isotherm plot (Fig. 6). Ice crystals are assumed to be present at the initiation of ice lenses (i.e. in the frozen fringe), and hence there is no need for spontaneous nucleation. Ice crystals will not exist all the way down to O"C, for a number of reasons, the most important being the electrolyte content in the soil pore water.
Summary and conclusions
The ice lensing phenomenon has been simulated in layered soils such as varved soils. Under the limited conditions in the investigation (structure of varved soils, materials used, moisture regime, and rate of freezing), ice lenses formed at the face of the clay layer as the freezing plane approached the interface. Some minor heaving occurred in the silt when its thickness was increased.
Growth rates of the lenses formed rose to a maximum quickly and tailed off slowly to a much lower rate before the next lens was initiated. This pattern was repeated at the slower ramp rates used. At higher ramp freezing rates, and with more closely spaced soil layers, there was a similar rise to maximum but a more rapid falloff as heaving rates decreased.
A model showing the ice lensing process in layered soil has been put forward but the extent of its applicability to the wide range of conditions possible in the field is not known.
The experimental studies reported here were very consistent with respect to the location of the growing ice lens. Ice lensing
was always initiated as the freezing plane approached the clay layer. Field observations carried out by Johnson et al. (1963) do not support this consistency; the simple laboratory conditions may not properly simulate the complex conditions that occur in nature.
Acknowledgements
This paper is a contribution from the Division of Building Research, National Research Council of Canada. The author wishes to acknowledge the assistance of his associates in the Geotechnical Section, in particular the full-time assistance of his colleague Mr. Dave Eldred.
EDEN, W. J. 1955. A laboratory study of varved clay from Steep Rock Lake, Ontario. American Journal of Science, 253, pp. 659-674.
EVERETT, D. H. 1961. The thermodynamics of frost action in porous solids. Transactions of the Faraday Society, 57, pp. 1541-1551.
JOHNSTON, G. H., BROWN, R. J. E., and PICKERSGILL, D. N. 1963. Permafrost investigations at Thompson, Manitoba, terrain studies. Division of Building Research, National Research Council of Canada, Ottawa, Ont., Technical Paper No. 158, NRC 7568,105 p.
MILLER, R. D. 1977. Lens initiation in secondary heaving. Proceedings of International Symposium on Frost Action in Soils, Lulea, Vol. 2, pp. 68-74.
PENNER, E. 1967. Heaving pressures in soils during unidirectional
freezing. Canadian Geotechnical Journal, 4, pp. 398-408. 1986. Aspects of ice lens growth in soils. Cold Regions Science and.Technology , 10, in press.
PENNER, E., and GOODRICH, L. E. 1981. Location of segregated ice in frost susceptible soil. Engineering Geology (Amsterdam), 18, pp. 231-244.
PENNER, E., and UEDA, T. 1977. The dependence of frost heaving on load application in preliminary results. Proceedings of International Symposium on Frost Action in Soils, Lulea, Vol. 1, pp. 92- 101.
SHPOLYANSKAYA, N. A. 1965. Characteristics of ice formation in quaternary varved clays in Igarka Region (based on textural and structural analyses of frozen strata). Podzemnyy Led (Underground Ice), 1, pp. 141-156.
ZHESTKOVA, T. N. 1963. Composition and cryogenic structure of Vorkuta varved clays. Merzlotnyi Issledovaniya (Permafrost Inves- tigations), No. 3, pp. 91-102.