Publisher’s version / Version de l'éditeur:
Cement, Concrete and Aggregates, 17, 2, pp. 113-118, 1995
READ THESE TERMS AND CONDITIONS CAREFULLY BEFORE USING THIS WEBSITE. https://nrc-publications.canada.ca/eng/copyright
Vous avez des questions? Nous pouvons vous aider. Pour communiquer directement avec un auteur, consultez la première page de la revue dans laquelle son article a été publié afin de trouver ses coordonnées. Si vous n’arrivez pas à les repérer, communiquez avec nous à [email protected].
Questions? Contact the NRC Publications Archive team at
[email protected]. If you wish to email the authors directly, please see the first page of the publication for their contact information.
NRC Publications Archive
Archives des publications du CNRC
This publication could be one of several versions: author’s original, accepted manuscript or the publisher’s version. / La version de cette publication peut être l’une des suivantes : la version prépublication de l’auteur, la version acceptée du manuscrit ou la version de l’éditeur.
Access and use of this website and the material on it are subject to the Terms and Conditions set forth at
Some applications of AC impedance spectroscopy in cement research
Gu, P.; Xie, P.; Beaudoin, J. J.
https://publications-cnrc.canada.ca/fra/droits
L’accès à ce site Web et l’utilisation de son contenu sont assujettis aux conditions présentées dans le site LISEZ CES CONDITIONS ATTENTIVEMENT AVANT D’UTILISER CE SITE WEB.
NRC Publications Record / Notice d'Archives des publications de CNRC:
https://nrc-publications.canada.ca/eng/view/object/?id=1902e29e-3253-4eec-8ed0-601eb01de44d
https://publications-cnrc.canada.ca/fra/voir/objet/?id=1902e29e-3253-4eec-8ed0-601eb01de44d
http://www.nrc-cnrc.gc.ca/irc
Som e a pplic a t ions of AC im pe da nc e spe c t rosc opy in c e m e nt
re se a rc h
N R C C - 3 9 8 4 0
G u , P . ; X i e , P . ; B e a u d o i n , J . J .
J a n u a r y 1 9 9 5
A version of this document is published in / Une version de ce document se trouve dans:
Cement, Concrete and Aggregates, 17, (2), pp. 113-118, 1995
The material in this document is covered by the provisions of the Copyright Act, by Canadian laws, policies, regulations and international agreements. Such provisions serve to identify the information source and, in specific instances, to prohibit reproduction of materials without written permission. For more information visit http://laws.justice.gc.ca/en/showtdm/cs/C-42
Les renseignements dans ce document sont protégés par la Loi sur le droit d'auteur, par les lois, les politiques et les règlements du Canada et des accords internationaux. Ces dispositions permettent d'identifier la source de l'information et, dans certains cas, d'interdire la copie de documents sans permission écrite. Pour obtenir de plus amples renseignements : http://lois.justice.gc.ca/fr/showtdm/cs/C-42
Ping
yu,l'
Ping Xie,
2
and
J J.
Beaudoin
l
Some Applications of AC Impedance Spectroscopy in
Cement Research
possible applications of ACIS in cement research; relevant
diffi-culties and limitations will bediscussed.
(1b)
Reat(ohms) R2
electrode effect Bulk cement paste effect Real(ohms) electrode effect., ..., , DHFA=R2/COS(8) (tel R1 R1+R2 (1a)
I
Bulk cement paste effecti
I
ACISin Cement Systems
Impedance spectra are generally recorded over a wide range of frequencies from MHz to Hz. A schematic impedance spectrum for a cement paste (two-point measuremenf configuration) plotted in the real versus imaginary plane (Cole-Cole plot) is illustrated in Fig. lao A single arc in the high-frequency range and a small part of a second arc in a relatively low-frequency region are depicted. The high frequency arc (HFA) is attributed to the bulk paste impedance behavior and the second arc is due to the cement paste-electrode surface capacitance. The intercepts R1(at the high frequency end) andRI
+
R2(at the minimum between the electrode arc and bulk arc) are important parameters providing information related to the cement paste and concrete microstructure. The HFA diameter DHFA, is determined from equivalent circuit modeling(Fig. Ib).Ideally, the value ofR2should be equivalent to DHFAif
the HFA is a perfect semicircle. However, an ideal response is rarely observed. Most materials exhibit an inclined semicircle with
FIG. l-(a)Schematic plot of a high-!requency aJ't' in the impedance complex plane obtained for cement paste or concrete systems; (b) the corresponding electrical equivalent ciJ't'uit; and(c)an inclined semiciJ't'le w/wse center is depressed below the real axis by an angle
a.
113 REFERENCE: Gu, P.• Xie, P., and Beaudoin,J.J.• "Some Applica-tions of AC Impedancesーセ」エイッウ」ッーケ In CementResearcb," Cement,
Concrete, andAggregates, CCAGDP, Vol. 17, No.2, Dec. 1995, pp.
113-118. '
aセstセctZ ACゥューセ、。ョ」・ techniques have been recently applied to I.nvestlgale the・ャ・セャョセ。ャ properties of hydrating cement pastes. A revIew of recent apphcatlons of AC impedance spectroscopy (ACIS)
in」・セ・ョエゥエゥッオウ materials studies including some relevant applications
to mIcrostructural characterization, silica fume content estimation
W-C ratio detennination and microcracking of cement paste 。イセ presented.
IResearch associate and principal research officer, respectively, Institute for Research in Construction, Materials Laboratory, Ottawa. Ontario, Can-ada, KIA OR6.
2Research scientist. University of Ottawa, Department of Civil Engi-neering, Ottawa, Ontario, Canada, KIN 6N5.
©1995 bythe American Society for Testing and Materials KEYWORDS: AC impedance spectroscopy, cement paste, silica fume, microcracking behavior
The application of AC impedance spectroscopy (ACIS) in cement research is relatively recent although this method has been widely used in electrochemistry (Bonanos et al. 1987).The signifi-cance of ACIS for characterizing cement paste systems is depen-dent on the occurrence of a semicircle in the complex plane at high-frequency range (Fig. la). This was first identified for hard-ened cement paste by McCarter et at. (1988) and McCarter and Brousseau (1990). and studied by Brantervick and Niklasson (1991), Scuderi et a1. (1991), Christensen et a1. (1992), and the authors (Gu et
aI.
1992. 1993a, and 1993b). Information related to hydration processes and microstructural development of cement pastes was obtained. These studies indicated that certain parameters obtained from ACIS are very sensitive to microstructural character-istics of cement paste.Analysis of ACIS uses a simple equivalent electrical circuit model. The corresponding elements are intended to have a clear physical meaning with respect to the microstructure or properties of the system (Xie et at 1993, Gu et al. 1993c, Xu et a1. 1993). A model developed at the National Research Council, Canada reveals that the occurrence of the high-frequency arc results primar-ily from the presence of solid-liquid interfaces. It can be used to characterize the structural changes in cement-paste systems. A brief review of published work by the authors related to applications of ACIS to microstructural characterization, silica fume content determination, and microcracking of cement paste is presented. The purpose of this review is to introduce and critically evaluate
m ? swsrw';=rmr=eeeo; r
114 CEMENT, CONCRETE, AND AGGREGATES
[C] =
8"
""
k] and k2 = a""
P
""
ro=
the center depressed below the real axis by an angle 6 (Fig. Ie). DHFA is then equal to R2/cos(6).
Impedance spectra for cement paste with
w-e
=
0.35, at hydra-tion times from 48 to 380 hare
plotted in Fig. 2. Only the electrode arc is visible at early hydration times. The HFA appears at a certain time and continues to grow in diameter with hydration time. The detectability of the HFA is dependent on microstructure, ion con-centration of pore solution, and equipment limitations (Xie et al. 1994).Microstructural Characterization of Cement-Based Materials
Previous investigations (Xie et al. 1993, Gu et al. 1993c, Xu et a1. 1993) led to the development of the follOWing expressions for the high-frequency resistance (HFR) RI>and the high-frequency arc diameter
D
HFA (orR
2):the concentration of ions in the bulk pore solution, the thickness of the Stern layer,
constants related to pore geometry and ionic strength of pore solution and temperature, respectively,
the area fraction-volume fraction ratio of the pores, the pore volume fraction of the cement paste matrix, and
mean pore size, determined from a pore-size distri-bution curve obtained by mercury intrusion porosimetry.
It is noted that(1)RIis an inverse function of both pore volume
fraction and ionic concentration in the pore solution;(2) DHFA(or
R
2) is an inverse function of pore volume fraction. mean pore size. and ionic concentration of the pore solution. The validation of Eqs1and 2 were examined by a series of experiments.
and
where
(1)
(2)
R[ Pore Structure Relationships
Asimple relation between the HFR and pore volume is evident from Eq 1. A plot of l/RI versus P gives a straight line if the
concentration term remains relatively unchanged.Itmay be appli· cable to hydrated cement systems particularly at advanced hydra-tion times when the conductivity of the pore soluhydra-tion has reached a relatively constant value. Experimental plots of lIR[ versus P for hydrating cement paste systems with W-C ratios 0.25 and 0.45 are provided in Figs. 3a and 3b, respectively.
FIG.2-Real versus imaginary component ofimpedance of a hydrating cement paste, W·C "" 0.35, hydrated from 48 to 380h.
10Q-r---r
MMMMセMMMMMMMMMMLDHFA(orR2) Pore Structure Relationships
The relationship between DHFA (or
R
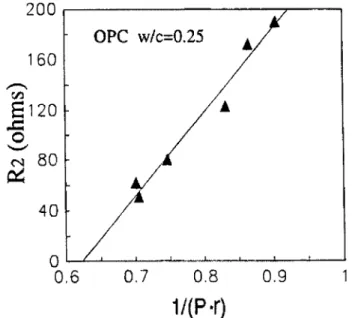
2 ) and pore volume frac-tion as well as pore size distribufrac-tion of the normal portland cement paste system is demonstrated in Fig. 5. A plot ofR2versusl/(P . fa) (ro in micrometers) is linear. A correlation coefficient of 0.99 was determined by regression analysis. The pore volume of the specimens varied from 24% at 3 days to 19% at 28 days age and mean pore size ranged from 0.066 to 0.054 IJ.m;
P .
favaried from 0.65 to 0.95.
Silica fume content in hardened concrete can be obtained from estimates of the high-frequency arc diameter DHFA•The DHFAterm
reaches a relatively constant value at advanced hydration times because both ionic concentration of the pore solution and the microstructure approach a certain degree of stability. This "final stage" depends on many propenies (for example, mineral content and W-C ratio, and so fonh) of the cement paste or concrete. Therefore, ACIS may be used in the determination of those factors DHFA(or R2) Jonic Concentration of Pore Solution Relationship
The relation betweenDHFA (or
R
2) and the ionic concentration term is examined for mature portland cement pastes immersed in various concentrations of Na(OH)+
saturated Ca(OHh solution for several hours. It is assumed that the samples are saturated with the solution so that the concentration of Na(OH) may be used to represent the pore solution concentration. A linear relationship between DHFA(orR
2)and lI(C]0.sas described by Eq 2 is illustratedin Fig. 4.
Determination of Silica Fume Contentin Hardened Concrete
.
48 hrst
.A t:. 68 hiSr
"
I
169hrs ,I
I , I 194 hrs,
•
284 hrs/
i fa 380 IusI
.i..
I
, I A..
A , t...
e.
a constant related to cell geometry, ionic conductivity of the interface,
the equivalent conductivity of the pore solution at infinite dilution,
セ "" an experimental constant associated with ionic interactions and viscosity of the pore solution, and so forth,
Real (ohms)
I K20
•
A
<I. .. b. A t· A " A0-,))-
BMZ[セ\ZゥNMエQセ[vセMBM⦅
70 90 110 130 150 17040-80
60
-
I-
en
E
..c:
o
-GU ET AL. ON APPLICATIONS OF AC IMPEDANCE SPECTROSCOPY 115
4
-.
•
'"73
8
w/c:::O.45 ..Q0
•
' - '2
....
セ
•
...
•
•
0
25
29
33
37
41
Porosity (%)
(3)o.g
0.8
1/(P
·r)
0.7
olNMlセ⦅NNNiNNMMNNjN⦅NNNNNjNNNNNN⦅GMMM⦅⦅lNN⦅NNNャ⦅⦅⦅⦅j0.6
ope
w/c=O.25
40
160
200
. - - - r - - - - ,
that affect both pore solution conductivity and microstructure, especiallyatadvanced hydration times (assuming the ionic concen-tration of the pore solution is relatively constant). Plots of DHFA
versus silica fume content at advanced hydration times (71 and
81
days) are given in Figs.6a and6b. Exponential relations are apparent. The correlation coefficients range from 0.97 to 0.99. The relevant empirical equation has the general form:FIG.5-Plot ofRz versus lIP· fofor ordinary portland cement paste
system.
w-e '"
0.25.24
20
22
Porosity (%)
18
w/c=O.250.8
-.
0.6
'"78
..Q0
0.4
---
....
セ
...
0.2
0
16
FIG. 3-Plots ofURI versus pore volume fraction for cement paste systems at hydration times from31027days with initialW-Cratios 0.25 or
and 0.45.
logDHFA
=
log C+
10g(Ko)13s/ (4)6000 , - - - ; - - - ,
where 13if is the silica fume content in percentage, Koand C are constants related to hydration rate and W-C ratio, and so forth. Straight lines are obtained from plots of log DHFAversus 13sf(Fig. 7).4500
-
en
E
.c
03000
-
Na:
1S00
A:&
0
0
2
3
4
1/J[C]
I(rf.5)
FIG. 4-Plot of Rz versus II
j[CJ,
where [C]is the concentration of NaOH in saturated Ca(OHh solution for mature hardened portland cement pastes.Determination of WaC Ratio in Hardened Concrete
Water-cement ratio of hardened cemen( paste can be estimated by ACIS if the pore solution concentration remains relatively constant. A plot ofDHFAversus
w·e
ratio for cement pastes withdifferent initial W·C ratios is provided in Fig. 8. These specimens were immersed in saturated Ca(OH)2 solution for 72 h in order to obtain a similar pore solution concentration condition before the impedance measurements. It is apparent that data obtained at hydra-tion times greater than 6 months lie on a single curve described by an exponential relationship. This is because the change of pore volume is insignificant at advanced ages and similar pore solution concentration. The value of DHFAincreases slightly as W-C ratio
decreases from 0.8 to 0.4. It increases dramatically as W-C ratio decreases further (ca. 10 times as キセ・ ratio decreases from 0.80 to 0.25). A threshold appears to occur at about W-C = 0.3. In a conductor (pore solution) insulator (cement hydration products) composite system, the conductivity If can be described by the percolation equation (McLachlan et al. 1990)
7 p
116
CEMENT, CONCRETE, AND AGGREGATES150
10
"iil
-... 1:1:1•
1:1.!:L1.5(0)
71
days
E
120 • 1:2:28
.c
1:2.5:2.5"iil
セ
E
6
...
...
90.s::.
0
CD セ-
CDセ
4
E
60 J:111
0
2
is
30it
0
:I:
00
0 4 8 12 16 20 ... 6 month o 8 month • 25 yeor0.2
0.4
0,6
0.8
Water/Cement Ratio
FIG.8-A plot of DHFAversus
w-e
ratio for cement pastes hydrated6. 8months, and25years.
wherejandfc are volume fraction and critical volume fraction of the low conductivity phase (cement hydration products), k is a constant, andt is a coefficient related to dispersion of hydration products. The quantity 11' is the liquid phase volume fraction or the pore volume fraction. The original pore volume fraction Po is simply the volume of water divided by the volume of the water and cement, for example,Po
=
W-CIW-C+
0.32. If it is assumed that 11' is proportional toPo, Eq 5 can be expressed as follows(5)
(6a)
or
Silica Fume Content,
I3sf,
%
150"iil
-..- 1:1: 1(b)
E
o 1:1.5:1.581 days
.c
120 • 1:2:2セ
1:2.5:2.5...
...
90 CDQj
E
60111
is
it
30•
:I:
0 0 4 8 12 16 20Silica Fume Content,
I3st,
%
FIG. 6-Plots of DHFA (kO) versus silica fume content at advancedhydration times:(a)7J(b) 81days. The solid lines represent the simulation. Cement-sand-aggregate ratio is indicated.
log(cr)
=
t10g(Po)+
C (6b)wherek' is a constant and C
=
log(k') - t log(f,). A linear curve5
-6- 6 month4
0 8 month • 25 yeor0'
3
セ.9
2
FIG. 7-A sample plot of logDHFA versus
I3sf.
for hydrated concretecontaining silica/ume at 71 days hydration. Cement-saNd-aggregate ratio is indicated,
Log(Po)
FIG. 9-Plot of log((]') versus log(Po} for cement pastes described in
GU ET AL. ON APPUCATIONS OF AC IMPEDANCE SPECTROSCOPY 117
. is obtained from a plot of 10g(lT) versus 10g(P
o)
(Fig. 9), witht = 9.62 and C
=
0.52.Microcracking in Cement Paste During Compressive Loading
seems tobe operative in the cement-silica fume paste systems but large crack propagation occurs at a higher load ratio (that is, 0.9). Addition of silica fume appears to make the initiation of microcracks more difficult. The dramatic decrease of arc diameter reflects the more brittle behavior that results from silica fume addition.
0.3
0.6
FIG. II-Plot ofDHFAIDHFAo versus P/plmfor data shown inFig. 10.
Acknowledgments
The authors wish to acknowledge Messeurs.
B.
Myers,Ed
Quinn, and Gordon Chan for their help with the experimentai apparatus. This work is financially supported by NSERC and the Network of Centers of Excellence on High-Performance Concrete.
References Discussion
The potential of using the ACIS technique in concrete practice is apparent. However, further research is required before this method can be used successfully in field applications. Cement paste is a complex system and
its
microstructure is randomly formed. The impedance behavior of such a system is determined by both nticrostructural characteristics and the liquid phase in the pores. It is a difficult challenge to develop ways of deterntining the conductivity of the liquid phasein-situ in order to accurately determine thein-situmicrostructural contribution to impedance.Bonanos, N., Steele, B. C. H.• Butler, E. P., Johnson, W. B., Worrell, W. L.. MacDonald. D. D., and McKubre, M. C. H., 1987, Application of
Impedance Spectroscopy, Chapter 4, 1. R., McDonald, Ed., Wiley &
Sons, NY.
Brantervik, K. and Niklasson, G. A., 1991, "Circuit Models for Cement Based Materials Obtained from Impedance Spectroscopy,"Cement and Concrete Research, Vol. 21. pp. 469-508.
Christensen, B. J .• Mason. T.0.,and Jennings, H. M., 1992. "Influence of Silica Fume on the Early Hydration of Portland Cements Using Impedance Spectroscopy," Journal of the American Ceramic Society,
Vol. 75, No.4, pp. 939-945.
Gu, P., Xie, P.,.Beaudoin, J.J.,and Brousseau, R., 1992. "A.C. Impedance Spectroscopy (I): A New Equivalent Circuit Model for Hydrated Port-land Cement Paste."Cement and Concrete Research, Vol. 22, No.5,
pp. 833-840.
Gu, P., Xie, P., Beaudoin,J.J.,and Brousseau, R., 1993a, "A.C. Impedance Spectroscopy (II): Microstructural Characterization Hydrating Cement-Silica Fume Systems,"Cement and Concrete Research, Vol. 23, No. I,
pp. 157-168.
Gu, P., Xie. P.• and Beaudoin, J. J., 1993b, "Microstructural Characteriza-tion of the TransiCharacteriza-tion Zone in Cement System by Means of A.C. Imped-ance Spectroscopy;' Cement and Concrete Research. Vol. 23, No.3,
pp.581-591. - _
Gu, P., Xie, P.,Xu,Z.,and Beaudoin, J. J., 1993c, "Application ofA.e. Impedance Techniques in Studies of Porous Cementitious Materials, (I). Influence of Solid Phase and Pore Solution on High Frequency Resistance," Cement and Concrete Research, Vol. 23, No.3, pp.
531-540.
Gu,P.,Xu, Z., Xie. P., and Beaudoin, 1. J., 1993d, "An A.C. Impedance Spectroscopic Study ofmゥ」イッセcイ。」ォゥョァ in Cement-Based Composites during Compressive Loading;'Cement and Concrete Research. Vol.
23, No.3, pp. 675-682.
McCarter, W. J., Gearing, S., and Buzzed, N.• 1988, "Impedance Measure-ments on Cement Paste."Journal of Material Science Letters, Vol. 7.
No. 10, pp. 1056-1057.
McCarter, W.J.and Brousseau, R., 1990, ''The A.C. Response of Hardened Cement Paste," Cement and Concrete Research, Vol. 20, No.6, pp.
891-900.
McLachlan, D. S.• Blaszkiewicz, M., and Newnham,R.E., 1990, "Electri-cal Resistivity of Composites,"Journal of the American Ceramic
Soci-ety, Vol. 73, No.8, pp. 2187-2203.
o
GMMセMセMセセセMセセMMGo
0.3 06 0.9 1.2 Load Ratlo,Pi/Plmg
15
1 . 2 , - - - . . . , - - - ,?
.-
ope Iセ]e]セセセ]M]セNLNセNNL
.,:6".Uセ
SFC.
0.9' . 0
10"SF,g
tl
j
i1:
J: 6000 1-> 500 5%SF "iii"i
0 -E 400•
10% SF .<: .<: .g. 4000<
.g.セ
D 300<f
Dope
::I: J: '0 200 '0 セ 2000 セセ
<-
100 1iセ
0 0Nセ
0 30 60 90 120 150 C Compressive load*1000 (N)Microstructure of cement paste changes as applied load increases
during a compressive test. Changes in microstructure alter the
impedance spectrum. Analysis ofthe impedance behaviortherefore may provide information from which inferences of microcrack formation and propagation can be made (Gu et aJ. 1993d).
DHPA
versus
applied loadPicurves for pure cement paste andpastes containing 5 and
10%
silica fume addition at a hydration time of 15 days are plotted in Fig. 10. The curves contain two distinct regions. Initially, theD HFAdecreases slowly with compres-sive load until a critical point; then its value decreases dramatically until failure takes place.The normalized data,DHFAIDHFAOversusP,IP,m (the HFA
diame-ters were divided by the initial HFA diameter for example,DHFAI D HFAO' and values of applied loads divided by the maximum load
P,lPim) are given in Fig. II. The arc diameter ratio decreases slightly for all three dhfaOセfao versus PJPimcurves indicating that microcrack formation may be the controlling process in the
initial stage. Dramatic decreases of the diameter ratio may be
attributed to subsequent crack propagation. Microcrack propaga-tion becomes large at a load ratio of approximately 0.6 and the decrease of diameter is significant. The microcracking process also
FIG. to-Plots of DHFA versus compressive loadPifor pure cement paste and pastes containing 5and 10% silica fume addition. The W-C
ratio is 0.35 and hydration time is15days.
I
I
I
I
I
I
i
I
f
I
•
_---IIIIIIIIIIIIIIIIIIIIII---....:-118
CEMENT, CONCRETE, AND AGGREGATESScuderi. C. A" Mason. T. 0., and Jennings. H. M., 1991,"Impedance Spectra of Hydrating Cement Pastes,"Journal ofMaterial Science,VoL
26,pp.349-353,
Xie. p" Ou, P.• Xu. Z.• and Beaudoin, J.1., 1993, "A Rationalized A.C. Impedance Model for Microstructural Characterization of Hydrating Cement Systems," Cement and Concrete Research, Vol. 23, No.2,
pp.359-367,
Xie, P., Gu, P.• Fu, Y.• and Beaudoin,1.1.. 1994, .. A.C.lmpedance Phenom· eDa in Hydrating Cement Systems: Origin of the High Frequency Arc,"
Cement andCOllcreteResearch, Vol. 24. No.4,pp.704-706. Xu, Z.t Gu. P.• Xie. P.• and Beaudoin.1.J" 1993. "Application of A.C.
Impedance Techniques in Studies ofPorons Cementitious Materials. (11).
Relationship Between ACIS Behavior and the Porous Microstructure,"