HAL Id: hal-02309296
https://hal.archives-ouvertes.fr/hal-02309296
Submitted on 9 Oct 2019
HAL is a multi-disciplinary open access
archive for the deposit and dissemination of
sci-entific research documents, whether they are
pub-lished or not. The documents may come from
teaching and research institutions in France or
abroad, or from public or private research centers.
L’archive ouverte pluridisciplinaire HAL, est
destinée au dépôt et à la diffusion de documents
scientifiques de niveau recherche, publiés ou non,
émanant des établissements d’enseignement et de
recherche français ou étrangers, des laboratoires
publics ou privés.
To cite this version:
Maxime Di Folco, Patrick Clarysse, Pamela Moceri, Nicolas Duchateau. Learning interactions between
cardiac shape and deformation: application to pulmonary hypertension. 10th International Statistical
Atlases and Computational Modeling of the Heart (STACOM) Workshop, Held in Conjunction with
MICCAI 2019, 2019, Shenzen, China. �hal-02309296�
Learning interactions between cardiac shape and
deformation: application to pulmonary
hypertension
Maxime Di Folco1, Patrick Clarysse1, Pamela Moceri2, and Nicolas Duchateau1
1 Creatis, CNRS UMR5220, INSERM U1206, Universit´e Lyon 1, INSA Lyon, France 2 Centre Hospitalier Universitaire de Nice, Service de Cardiologie, Nice, France
-Universit´e Cˆote d’Azur, Facult´e de m´edecine, Nice, France
Abstract. Cardiac shape and deformation are two relevant descriptors for the characterization of cardiovascular diseases. It is also known that strong interactions exist between them depending on the disease. In clin-ical routine, these high dimensional descriptors are reduced to scalar values (ventricular ejection fraction, volumes, global strains...), leading to a substantial loss of information. Methods exist to better integrate these high-dimensional data by reducing the dimension and mixing het-erogeneous descriptors. Nevertheless, they usually do not consider the interactions between the descriptors. In this paper, we propose to apply dimensionality reduction on high dimensional cardiac shape and defor-mation descriptors and take into account their interactions. We investi-gated two unsupervised linear approaches, an individual analysis of each feature (Principal Component Analysis), and a joint analysis of both features (Partial Least Squares) and related their output to the main characteristics of the studied pathology. We experimented both methods on right ventricular meshes from a population of 254 cases tracked along the cycle (154 with pulmonary hypertension, 100 controls). Despite sim-ilarities in the output space obtained by the two methods, substantial di↵erences are observed in the reconstructed shape and deformation pat-terns along the principal modes of variation, in particular in regions of interest for the studied disease.
1
Introduction
Clinical routine mainly uses simplified measurements of the cardiac function to characterize cardiovascular diseases, among which scalars such as ejection fraction or volumes, and myocardial strain. These scalars summarize high di-mensional information about the cardiac shape and its deformation, and may therefore represent a substantial loss of information for complex pathologies.
Dimensionality Reduction Methods (DRM) have been used in cardiac imag-ing applications to better consider high-dimensional descriptors encodimag-ing shape and deformation, either individually [1–4] or jointly [5]. Very recently, [6] went beyond these techniques and used auto-encoders on dynamic cardiac shapes to compute a latent low-dimensional space optimized for survival prediction.
2 Maxime Di Folco, Patrick Clarysse, Pamela Moceri, and Nicolas Duchateau
However, cardiac shape and deformation undergo strong interactions depend-ing on the disease. For example, in the case of pulmonary hypertension, a pres-sure overload forces the Right Ventricle (RV) to adapt by increasing its con-tractility to maintain a normal RV function. After a certain amount of time, the contractility can no longer increase and a progressive RV shape dilation and motion abnormalities may appear [7].
Methods that mix several high-dimensional heterogeneous descriptors all at once do not take into account their interactions and redundancy, which may limit the analysis. In methods reported in [8–10], an affinity matrix is estab-lished as composed of blocks that represent either the affinity between samples according to a single descriptor (diagonal blocks), or the interactions between two descriptors (extra diagonal blocks). Because of the nonlinearity of the meth-ods and the unique output space returned, the reconstruction to the input space is not obvious. Other works proposed to link two learnt representations using ad-ditional constraints that express the hypothesized interactions between descrip-tors [11, 12]. These methods first determine the low-dimensional representations independently and then consider interactions, which can substantially alter the initially learnt representations. In [13], linear techniques consider interactions while learning the low-dimensional representation, demonstrated for linking two di↵erent imaging modalities from the same heart. Nonetheless, this application concerned two descriptors that theoretically represent very similar information, while we target the study of shape and deformation descriptors, with known but only partial interactions.
In this paper, we explore the interactions between two partially interact-ing high-dimensional descriptors (cardiac shape and deformation), with unsu-pervised linear DRM either applied to descriptors independently or to both de-scriptors jointly. In the perspective of risk stratification from the low-dimensional output space, we notably evaluate how critical DRM can be for the assessment of the main local characteristics of a given disease: pulmonary hypertension, looked at through 3D RV echocardiographic data. In particular, we consider deforma-tion patterns or shape as whole entities and not at each locadeforma-tion independently from the others [14–16].
2
Methods
2.1 Data and pre-processing
We processed a database of right ventricular meshes tracked on 3D echocardio-graphic images along the cardiac cycle, obtained from the commercial software 4D-RV Function 2.0 (TomTec Imaging Systems GmbH, Unterschleißheim, Ger-many). The meshes have 822 cells and 1587 points. The database is composed of 254 cases with 100 controls and 154 patients with pulmonary hypertension.
Point-to-point correspondences already exist between the meshes from dif-ferent subjects, which allows straightforward comparisons within a population. Nonetheless, to reduce the bias due to di↵erent spatial heart positions, we
re-Study of the interaction between cardiac shape and deformation 3
aligned the meshes rigidly with Procrustes alignment (limited to global trans-lations and rotations) [17]. This also provides an average shape for the controls population, used as template for display and analysis.
Then, two descriptors representing shape and deformation respectively were computed. The first one, called area strain (Fig.1a), is the relative area change (in %) of each mesh cell between End-Diastole (ED) and End-Systole (ES). It summarizes the deformation of the RV over the systole. The second one char-acterizes shape at ED, through a distance vector (Fig.1b) computed at each mesh point between a given case and the average shape of the controls, used as reference for normality.
These two features are high-dimensional: 822⇥ 1 for area strain (a scalar at each mesh point) and 822⇥ 3 for the distance vector (a 3D vector at each mesh point).
(a) Deformation feature (b) Shape feature
Fig. 1: (a) Area strain pattern at end-systole for a healthy case expressed in % (b) Distance vector (mm) colored by magnitude for the same healthy case. The blue mesh stands for the reference mesh used for the computations.
2.2 Dimensionality reduction
DRM take as input high-dimensional data and return a low-dimensional space encoding the main characteristics of the input space. Here, we focus on the following two linear approaches. Principal Component Analysis (PCA) looks for the main directions of variance in the data. This can be written as the following eigenvalues problem, for a single descriptor x:
Cxw = w, (1)
where Cx is the covariance matrix of the studied descriptor, w and are the
eigenvectors and the eigenvalues of Cx, respectively.
The second considered method is the two-block Partial Least Square (PLS) regression [18], which mutually maximizes the covariance between the set of projections for two features, which amounts at solving the following eigenvalues problem:
4 Maxime Di Folco, Patrick Clarysse, Pamela Moceri, and Nicolas Duchateau
CxyCyxwx= 2P LSwx, (2a)
wy=
1
P LSwy, (2b)
where Cxyand Cyxare the cross-covariance matrices of the descriptors x and y,
and wx and P LS are the eigenvectors and eigenvalues of the matrix CxyCyx.
Note that with PLS, we obtain at once two output spaces, one for each descriptor. Due to the linearity of both methods, the inverse transformation (from the output space to the input space) is known. Therefore, the reconstruction of meaningful points from the output space is straightforward in particular along the first components. Note that for the shape descriptors, the reconstruction from the output space provides a vector field encoding distances from the tem-plate shape: a final step is needed for visualization and analysis purposes, which consists in reconstructing the corresponding shape by applying this vector field to the template shape.
3
Experiments and results
The following section reports on the application of the DRM to the entire pop-ulation (patients and controls). Considering patients and controls at the same time allows to study the continuum that exists from normality to the most severe grades of pulmonary hypertension, in line with what has recently been recommended for cardiac applications [19].
3.1 Output spaces
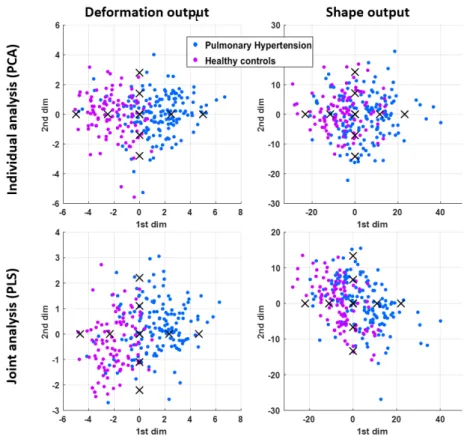
We first compare the two methodologies (individual analysis of each features using PCA and joint analysis using PLS) based on their output spaces. Each analysis returns two output spaces (one per descriptor, Fig. 2).
A comparison between the obtained components by each strategy reveals that the first and second components are highly correlated (shape: r2 = 0.99
first component, r2 = 0.59 second component; deformation: r2 = 0.98 first
component, r2= 0.69 second component).
Nevertheless, another way of comparing the output spaces reveals di↵erences unseen with the previous assessment. We evaluated the correlation between the components of the two output spaces, for each strategy (Table. 1). With PCA, the first components of a given descriptor are linked with all the other compo-nents of the other descriptor. This is di↵erent with PLS, where each component of a given descriptor is only linked to the corresponding component of the other descriptor (low extra-diagonal coefficients in the table). This comes from the fact that PLS maximizes the covariance of both spaces at the same time, so the corresponding components are linked together but not with the others. This link is the main di↵erence between the output spaces of both analysis.
Study of the interaction between cardiac shape and deformation 5
Fig. 2: Output spaces for each descriptor, from the two di↵erent strategies. Crosses indicate the samples at [ 2, 1, 0, +1, +2] used to reconstruct the modes of variations examined in Sec. 3.2.
ab a Deformation 1st 2nd 3rd Shape 1st -0.39 0.19 -0.28 2nd -0.27 0.023 -0.13 3rd -5e-3 4e-3 -0.065 (a) Individual analysis (PCA)
ab a Deformation 1st 2nd 3rd Shape 1st 0.51 1e-17 1.5e-16 2nd -4.3e-18 0.48 3.8e-16 3rd 1e-17 2.4e-16 0.37 (b) Joint analysis (PLS)
Table 1: Correlation coefficient (r2) between the components of the two output
spaces.
3.2 Principal modes of variations
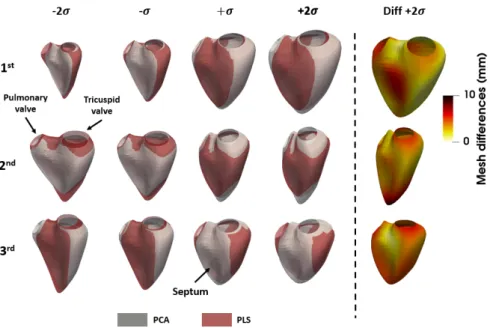
The first mode of variations for the shape descriptor quantifies the size of the right ventricle (Fig. 3). The di↵erences plotted on the right side of the figure
6 Maxime Di Folco, Patrick Clarysse, Pamela Moceri, and Nicolas Duchateau
correspond to the point-to-point distance between the PCA and PLS shapes at +2 . Samples around +2 (+2 standard deviations) lie in the side of the out-put space where pulmonary hypertension patients predominate, and have bigger shapes (characteristic RV dilatation in pulmonary hypertension). The second mode of variations encodes the intra-valve distance. The meshes obtained from the two DRM substantially di↵er close to the apex (near 10mm for a ventricle around 80 mm long). The third mode encodes changes in the curvature of the septum, and corresponds to reported changes in this zone for severe pulmonary hypertension cases (“septal bowing”, which means that the septum bows itself and becomes almost straight [20]).
Note that the di↵erences between meshes at 2 is equal to the di↵erences at +2 due to the linear dimensionality reduction and reconstruction methods, if the di↵erences are unsigned (absolute di↵erences). If signed, di↵erences at 2 are the exact opposite of di↵erences at +2 .
We should also keep in mind that the commercial software that tracks the RV along the cycle uses a surface model adjusted to the image data [21], which may reduce the amount of modes of variation in the mesh data we study.
Fig. 3: Comparison of the first three modes of variations for the shape descriptor for both dimensionality reduction strategies.
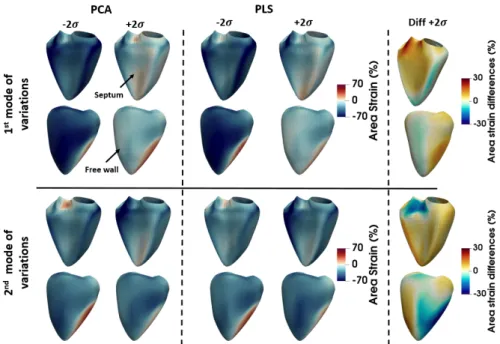
The first mode of variations for area strain mostly quantifies the global ampli-tude of deformation (increase of the absolute strain values along the component). Lower strain is observed for samples at +2 , which corresponds to the lower de-formation observed in pulmonary hypertension cases [14] (Fig. 4). Di↵erences
Study of the interaction between cardiac shape and deformation 7
between the two DRM (di↵erence between the two area strain pattern at +2 ) stay under 10% except close to the pulmonary valve (top left when facing the septum). The second mode encodes more local information and in particular the location of the maximal strain on the free wall (moving from left to right) and on the septum (close to the valve, positive to negative strain). Up to 30% di↵erences are observed in some zones of the ventricle, although these do not correspond to characteristics zones reported for this disease.
Fig. 4: Comparison of the first three modes of variations for the strain descriptor for both dimensionality reduction strategies. We show both septal and free wall views for better visualization.
4
Conclusion
In this paper, we explored ways to analyse cardiac shape and deformation, which are two high-dimensional descriptors partially interacting. We aimed at obtain-ing a relevant low-dimensional space that can be used later on for risk stratifica-tion. To take into account the interaction between both descriptors, we assessed two unsupervised linear dimensionality reduction strategies that consider the descriptors either independently or jointly. Similarities exist between the out-puts of the two strategies (correlated first dimensions, similar patterns encoded along the first dimensions). Nevertheless, some substantial di↵erences have been identified on zones of the right ventricle that convey relevant information for the study of pulmonary hypertension.
8 Maxime Di Folco, Patrick Clarysse, Pamela Moceri, and Nicolas Duchateau
Recent work explored supervised techniques to represent shape data against survival in the context of pulmonary hypertension [6]. We preferred unsupervised learning for our analysis, as it allows identifying hidden data structures that can be used for risk stratification (for example, identifying clusters of patients at higher risk, or situating a new patient’s risk against known cases) without being conditioned by clinical labels, which may be arguable in some cases [5].
Nonetheless, PLS may be restrictive in the sense that it does not allow con-trolling the weight given to the interactions between descriptors, which may limit the analysis on partially interacting heterogeneous descriptors such as cardiac shape and deformation. Further work will also extend the analysis to non-linear methods, which may better preserve the structure of the data spaces associated to each descriptor. It may also include recent developments for transporting spatiotemporal shape data among a population through di↵eomorphic trans-formations [22], which explicitly aims at preserving the structure of the space encoding cardiac meshes.
Acknowledgements
The authors acknowledge the partial support from the French ANR (LABEX PRIMES of Universit´e de Lyon [ANR-11-LABX-0063], within the program In-vestissements d’Avenir [ANR-11-IDEX-0007]), and from the EEA doctoral school.
References
1. X Zhang, BR Cowan, DA Bluemke, et al. Atlas-based quantification of cardiac remodeling due to myocardial infarction. PLoS One, 9:e110243, 2014.
2. W Bai, W Shi, A de Marvao, et al. A bi-ventricular cardiac atlas built from 1000+ high resolution MR images of healthy subjects and an analysis of shape and motion. Elsevier, pages 133–145, 2015.
3. K McLeod, M Sermesant, P Beerbaum, et al. Spatio-temporal tensor decom-position of a polyaffine motion model for a better analysis of pathological left ventricular dynamics. IEEE Trans Med Imaging, 34:1562–1575, 2015.
4. N Duchateau, M De Craene, G Piella, et al. Constrained manifold learning for the characterization of pathological deviations from normality. Med Image Anal, 16:1532–1549, 2012.
5. S Sanchez-Martinez, N Duchateau, T Erdei, et al. Characterization of myocardial motion patterns by unsupervised multiple kernel learning. Med Image Anal, 35:70– 82, 2017.
6. GA Bello, TJ.W. Dawes, J Duan, et al. Deep-learning cardiac motion analysis for human survival prediction. Nat Mach Intell, pages 95–104, 2019.
7. J Sanz, D S´anchez-Quintana, E Bossone, et al. Anatomy, function, and dysfunction of the right ventricle: JACC State-of-the-Art Review. J Am Coll Cardiol, 73:1463– 1482, 2019.
8. J Valencia-Aguirre, A ´Alvarez Meza, G Daza-Santacoloma, et al. Multiple manifold learning by nonlinear dimensionality reduction. Proc. CIARP, LNCS, 7042:206– 213, 2011.
Study of the interaction between cardiac shape and deformation 9 9. CS Lee, A Elgammal, and M Torki. Learning representations from multiple
man-ifolds. Patt Recogn, 50:74–87, 2016.
10. OM Benkarim, G Sanroma, G Piella, et al. Revealing regional associations of cortical folding alterations with in utero ventricular dilation using joint spectral embedding. Proc. MICCAI, LNCS, 11072:620–627, 2018.
11. J Ham, D.D Lee, L.K Saul, et al. Semisupervised alignment of manifolds. Proc. AISTATS, 10, 2005.
12. L Xiong, F Wang, C Zhang, et al. Semi-definite manifold alignment. Proc. ECML, LNCS, 4701:773–781, 2007.
13. E Puyol-Ant´on, M Sinclair, B Gerber, et al. A multimodal spatiotemporal cardiac motion atlas from MR and ultrasound data. Med Image Anal, 40:96–110, 2017. 14. P Moceri, N Duchateau, Baudouy, et al. Three-dimensional right-ventricular
re-gional deformation and survival in pulmonary hypertension. Eur Heart J Cardio-vasc Imaging, 19:450–458, 2018.
15. A L´opez-Candales, N Rajagopalan, B Gulyasy, et al. Di↵erential strain and velocity generation along the right ventricular free wall in pulmonary hypertension. Can J Cardiol, 25:73–77, 2009.
16. HS Seo and H Lee. Assessment of right ventricular function in pulmonary hyper-tension with multimodality imaging. J Cardiovasc Imaging, 26:189, 2018. 17. JC Gower. Generalized Procrustes analysis. Psychometrika, 40:33–51, 1975. 18. A Wegelin. A survey of partial least squares (PLS) methods, with emphasis on the
two-block case. 2000.
19. F Triposkiadis, J Butler, FM Abboud, et al. The continuous heart failure spectrum: moving beyond an ejection fraction classification. Eur Heart J, 40:2155–2163, 2019. 20. T Kind, G-J Mauritz, J.T Marcus, et al. Right ventricular ejection fraction is better reflected by transverse rather than longitudinal wall motion in pulmonary hypertension. J Cardiovasc Magn Reson, 12:35, 2010.
21. M Schreckenberg. Adaptation of a 3D-surface model to boundaries of an anatomical structure in a 3D-image data set. US Patent, US9280816B2, 2013.
22. N Guigui, S Jia, M Sermesant, et al. Symmetric algorithmic components for shape analysis with di↵eomorphisms. Proc. SEE GSI, LNCS, 2019. In press.