HAL Id: cea-03199150
https://hal-cea.archives-ouvertes.fr/cea-03199150
Preprint submitted on 15 Apr 2021
HAL is a multi-disciplinary open access
archive for the deposit and dissemination of
sci-entific research documents, whether they are
pub-lished or not. The documents may come from
teaching and research institutions in France or
abroad, or from public or private research centers.
L’archive ouverte pluridisciplinaire HAL, est
destinée au dépôt et à la diffusion de documents
scientifiques de niveau recherche, publiés ou non,
émanant des établissements d’enseignement et de
recherche français ou étrangers, des laboratoires
publics ou privés.
Impact of LTE-V2X Connectivity on Global Occupancy
Maps in a Cooperative Collision Avoidance (CoCA)
System
Nadia Mouawad, Valerian Mannoni, Benoît Denis, Alex Pereira da Silva
To cite this version:
Nadia Mouawad, Valerian Mannoni, Benoît Denis, Alex Pereira da Silva. Impact of LTE-V2X
Con-nectivity on Global Occupancy Maps in a Cooperative Collision Avoidance (CoCA) System. 2021.
�cea-03199150�
Impact of LTE-V2X Connectivity on Global
Occupancy Maps in a Cooperative Collision
Avoidance (CoCA) System
Nadia Mouawad, Valerian Mannoni, Benoˆıt Denis, Alex Pereira da Silva
Universit´e Grenoble Alpes, CEA-Leti, F-38000 Grenoble, France {nadia.mouawad, valerian.mannoni, benoit.denis, alex.pereiradasilva2}@cea.fr
©2021 IEEE. Personal use of this material is permitted. Permission from IEEE must be obtained for all other uses, in any current or future media, including reprinting/republishing this material for advertising or promotional purposes, creating new collective works, for resale or redistribution to servers or lists, or reuse of any copyrighted component of this work in other works. DOI: .
Abstract—Cooperative Intelligent Transport Systems (C-ITS) are expected to fulfill the needs of various emerging road safety applications. In this work, we focus on improving C-ITS vul-nerable road users safety by considering a Cooperative Collision Avoidance (CoCA) system. In this system, vehicles rely on on-board sensors in order to generate local occupancy maps that are transmitted by means of LTE-V2X connectivity to a fusion center. The latter executes the fusion of successfully received local maps, in order to generate a global occupancy map, which can reveal obstacles that could not be perceived based uniquely on standalone vehicle’s perception means. The resulting map is broadcast to all connected vehicles in transmission range (i.e., even those who have not contributed to the global map) in order to announce a risk of collision. The main objective of this work is to evaluate the impact of LTE-V2X connectivity performance on the fusion result and to define the best compromises between the communication configuration, the definition of occupancy maps and obstacle detection capabilities.
Keywords—Cooperative Collision Avoidance, LTE-V2X, Occu-pancy maps, Sensors data fusion, Vulnerable Road Users safety.
I. INTRODUCTION
Cooperative Intelligent Transport Systems (C-ITS) rely mainly on applications for active road safety and traffic ef-ficiency. Among the large spectrum of C-ITS applications and services, cooperative sensor data fusion has been particularly recognized to be relevant for road traffic monitoring, or novel safety approaches for Vulnerable Road Users (VRUs) [1].
In this work, we focus on improved VRUs safety in complex road environments such as urban intersections. To this end, we consider a Cooperative Collision Avoidance (CoCA) system, where various vehicles carry embedded ranging sen-sors (LiDAR, RADAR, etc.) to construct local probabilistic occupancy maps. The latter are transmitted, via a specific message, to a fusion center such as the Road Side Unit (RSU) through long-term evolution (LTE)-V2X (PC5 mode 4) con-nectivity for further processing. The fusion result, that consists of a global occupancy map, can be subsequently broadcast back to all V2X-enabled vehicles in range. Accordingly, the CoCA system can provide network-assisted safety information to connected vehicles.
Several research works have already tackled V2X-assisted cooperative localization and sensors data fusion problem in the very vehicular context. Authors in [2] propose the use of on-board LiDAR sensors, Global Navigation Satellite System (GNSS) data and Vehicle-to-Vehicle (V2V) communications in order to estimate the positions of vehicles and obstacles in their vicinity. The work in [3] studies local GNSS data fusion with asynchronous Cooperative Awareness Messages (CAM) received from neighboring vehicles over ITS-G5 V2V links [4]. In [5], a fusion architecture for a cooperative perception system is proposed. The work in [6] presents an algorithm that recognizes the environment around the vehicle using
Vision and LiDAR sensor fusion. Authors in [7] consider the cooperative fusion of local LiDAR-based occupancy maps via ITS-G5. To the best of our knowledge, among these research works, only few have addressed the effect of V2X practical connectivity constraints and limitations on the fusion of local maps.
Contrarily to the aforementioned research works, this paper addresses the impact of V2X connectivity on local occupancy maps fusion. To this end, we present a simulation model inherited from [7] and [8]. In comparison with [7], this new study considers (i) LTE-V2X connectivity as a substitute to ITS-G5, (ii) complete network simulations rather than using simplistic parametric models and finally, (iii) various test configurations and settings to illustrate the sensitivity of the taken approach with respect to key system parameters (incl. radio physical layer settings, vehicles density, messages rate, global map size and resolution, etc.). To do so, we consider first V2X link condition variation and path loss attenuation that can have an important impact on packets delivery success. Second, due to packets size limitations imposed by LTE-V2X connectivity, we consider that maps should be pre-processed before being sent to the fusion center. Therefore, we conduct a study to define global map size and resolution. Third, we investigate the impact of messages rate on packets delivery and maps precision. The simulation scenario consists of a road intersection, where vehicles traffic is simulated using Simulation of Urban Mobility (SUMO) [9]. We simulate LTE-V2X connectivity using the event-driven simulator (NS-3) [10]. Moreover, applications to generate LiDAR-based local occupancy maps and execute their fusion into the global map have been developed with Matlab®.
The remainder of this paper is structured as follows: in section II, we introduce the different blocks of the proposed simulation platform. In section III, we explain the evaluation methodology and present the key performance indicators. We dedicate section IV to present our system evaluation and discussions. Finally, we conclude our paper in section V.
II. SIMULATION ARCHITECTUREFOR THEEVALUATION OFCOCA APPLICATION
A road intersection scenario has been considered, where ve-hicles can generate local occupancy maps and broadcast them to a RSU that plays the role of a fusion center (i.e., in practice, the RSU at stake is endowed or connected with computation and storage means devoted to the fusion process). The latter executes the fusion of local occupancy maps and broadcast the generated global occupancy map to all connected vehicles under its coverage. Note that an alternative architecture would be to perform the fusion directly by the vehicles themselves (on-board fusion). However, in this study, we have focused on the RSU as the fusion center because of its privileged position in the near center of the intersection which facilitates communication links.
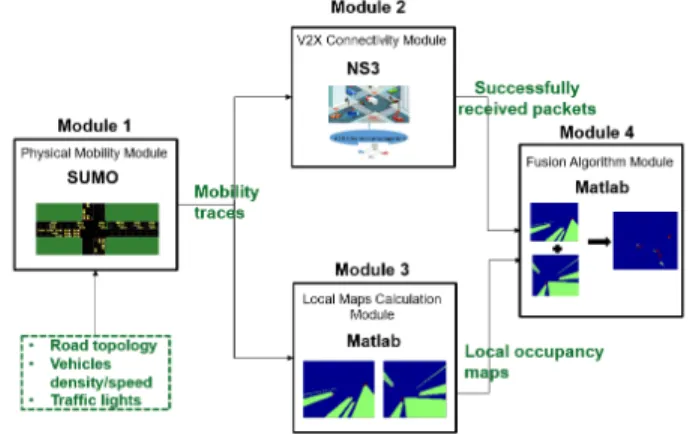
In order to simulate this scenario, we consider a simulation model with four modules as shown in Fig. 1. Module 1
models realistic road traffic mobility using SUMO. Resulting mobility traces are fed into NS-3 (module 2) in order to simulate messages exchange between vehicles and also the fusion center, via LTE-V2X connectivity. At the same time, SUMO mobility traces are used by our Matlab® application
(module 3) to generate local occupancy maps. Module 4 extracts successfully received packets from NS-3 traces and subsequently executes the fusion of local occupancy maps generated by module 3.
Fig. 1. Simulation modules and the interaction among them.
In the following, we present each simulation module in details.
A. Module 1: Physical Mobility Module
The road traffic of a real-life urban intersection (Fig. 2) is simulated using SUMO. The generated output contains a time-stamped vector with the 2D coordinates, speed and heading of both vehicles and pedestrians. Note that these mobility traces are generated offline and can be replayed from both NS-3 and Matlab®. In fact, since we are mainly interested in assessing the information flow till the elaboration of global maps, no control feedback to vehicles mobility (and thus, no tight co-simulation between mobility and connectivity modules) is really needed in our simulations.
B. Module 2: V2X Connectivity Module
This module simulates LTE-V2X connectivity in NS-3 with a cross-layer simulation approach [8] between the physical and higher layers to exploit SUMO mobility traces.
LTE-V2X operates using the Single Carrier Frequency Di-vision Multiplexing Access (SC-FDMA) waveform. Channel occupation is defined by three main elements: sub-frames defining the Transmission Time Interval (TTI), subcarriers defining the Resources Blocks (RBs) and sub-channels defin-ing the group of RBs in a sub-frame to transmit user and control information. A TTI has a fixed duration of 1 ms and a RB has a bandwidth of 180 kHz. LTE-V2X standard gives different Modulation Code Scheme (MCS), leading to a trade-off between throughput, range and capacity [11]. User Equipments (UEs)/RSUs can transmit packets every 100 sub-frames (100 ms) or in multiples of 100 ms. To do so, LTE-V2X PC5 mode 4 lets UEs/RSUs autonomously select their radio resources following the Sensing-based Semi-Persistent Scheduling.
In this module, we consider a 10 MHz bandwidth divided in 50 RBs using the ITS 5.9 GHz band with a power transmission PT x = 23 dBm. For the propagation model, we consider the
path loss model Winner B1 (in Line of Sight (LoS), Non LOS
and Obstructed LoS condition [8]) and the fast fading model based on the 3GPP Extended Vehicular A Model (See [11]).
On the application layer, vehicles generate periodically messages with a period T (in ms). Each active UE/RSU receiving the packet calculates the Signal to Interference Noise Ratio (SINR) and Packet Error Rate (PER) depending on the link condition and path loss attenuation [11]. The simulation output is then inputted into module 4 in order to indicate if packets are successfully received between vehicles and RSU. C. Module 3: Local Occupancy Maps Calculation Module
Module 3 implements LiDARs sensors model in Matlab®
relying on both so-called measurement and beam sensor mod-els. For the measurement model, the measurements collection is defined based on the range, azimuth angle and frequency cy-cle. The measurement output corresponds to a (distance; angle) set. The beam sensor model is represented by probabilistic curves that compute the probability of existence/absence of obstacles in each beam direction.
According to these models, equipped vehicles can generate local probabilistic occupancy maps based on a grid-based ap-proach [12]. The local scene, representing a predefined zone of interest, is perceived by each vehicle with pixels (also referred to as cells in the following) associated with a probability value; those pixels represent a zone possibly occupied by an obstacle (another vehicle or a vulnerable user). For more details about the probabilistic beam sensor model considered for LiDARs, and local occupancy maps construction, readers may refer to [13]. Fig. 2 (right) gives an example of a generated local map.
Fig. 2. Intersection scenario simulated in SUMO (left figure). Local occupancy map example (right figure).
D. Module 4: Fusion Algorithm Module
This module implements the fusion algorithm in Matlab®.
The fusion center gathers successfully received local maps (generated by module 3) to build the global occupancy map. More precisely, as explained previously, we use NS-3 traces files in order to determine at each transmission period (T ) vehicles maps that are successfully received by the fusion center (RSU). The fusion is then achieved by means of the Independent Opinion Poll (IOP) algorithm [7], [14]. For instance, given a cell i of the occupancy map, the occupancy probability P(i)obtained by the fusion of 2 occupancy maps, with indexes 1 and 2 (e.g., two local maps from two first vehicles, or one local map from a vehicle and the latest version of the global map, resulting from a previous fusion step) with IOP is given as follows:
P(i)= P
(i) 1 P
(i) 2
P1(i)P2(i)+ (1 − P1(i))(1 − P2(i)) (1) where Pj(i) is the j − th occupancy probability in cell i j ∈ {1, 2}. The fusion of n maps can thus be performed iteratively, even if maps are not received simultaneously. For
a third vehicle with occupancy probability P3(i), the fusion is computed with P(i).
III. EVALUATIONMETHODOLOGY ANDPARAMETERS
In this section, we present the evaluation methodology and Key Performance Indicators (KPIs). The latter are useful to provide system specifications (maps size, resolution and mes-sages periodicity), given a performance target at the application level (maximum tolerated misdetection rate).
A. Evaluation Methodology
In the performance evaluation, we consider that occupancy maps are represented by pixels that have a certain probability value Pocc ∈ [0, 1]. In order to determine whether a cell
(pixel) is occupied or not, we should define a priori thresholds values. For instance, the cell is considered to be occupied if its occupancy probability Pocc≥ Pmax, free if Pocc≤ Pmin, and
unknown for Pmin < Pocc < Pmax. We note that unknown
cells result from the fact that some regions might not be covered by ranging sensors.
First, we conduct a study to define the most suitable maps format for V2X connectivity (size, resolution, quantization). Second, we investigate the impact of messages periodicity.
1) Maps size and resolution: The exchange of traffic safety messages in vehicular networks can be ensured by broadcast-ing periodic awareness messages such as CAM. In [8], we have considered 800 Bytes as maximal CAM size. However, exchanged local maps require larger packets size, since they carry a considerable amount of information, depending on the retained local map representation. Consequently, this has motivated us to use specific messages different than CAM. Furthermore, the constraints of transmitting a packet through a single TTI with a reasonable MCS urge us to study the message format of occupancy maps. To this end, we consider that local probabilistic maps generated by vehicles are pre-processed before being sent to the fusion center. Accordingly, we consider two cases of images quantization with two values of the number of bits per pixels (bpp): 3 and 4 bpp. More-over, we assume an easily reachable 1/3 compression ratio to transmit the occupancy maps.
2) Messages periodicity: As mentioned earlier, vehicles are assumed to send maps to the fusion center periodically every T ms. Obviously, the value of T can have a strong impact on both V2X connectivity performance and global map quality. Indeed, LTE-V2X link performance is expected to increase with higher values of T . However, increasing messages periodicity may lead to a higher number of misdetected obstacles due to the fact that the information can be outdated (not enough consistent in terms of space/time coherence to be fused with the latest global fusion result). Thus, the choice of a suitable value of T is crucial and should be carefully studied.
B. Key Performance Indicators
To assess the impact of maps processing, messages period-icity and LTE-V2X radio configuration, we consider as KPIs, both Packet Delivery Ratio (PDR) and Obstacle Misdetection Rate (OMR).
1) Packets Delivery Ratio: The PDR of Vehicle to Infras-tructure (V2I) is calculated: first we study the communication link from vehicles to RSU (denoted by UL for simplicity), to evaluate the capacity of the RSU to collect local occupancy maps from the vehicles, and second we evaluate the communi-cation link from RSU to vehicles (DL), to evaluate the capacity of the RSU to share global maps with all the vehicles in the
intersection. We define the PDR in UL as the ratio between the number of packets received by the RSU and the number of packets sent by the vehicles. The PDR in DL is the number of vehicles actually receiving a packet over the total number of active vehicles in the intersection for each transmission from the RSU.
2) Obstacle Misdetection Rate: Changes made on the local maps may affect the global map occupancy probability values which may engender some obstacles misdetection. More pre-cisely, changing the value of P(i) in a pixel i, due to image processing, might lead to consider this pixel as free. In our study, we assume that the typical dimension of vehicles (resp. other VRUs such as pedestrians) is about 2m x 4m (resp. 0.8m x 0.8m). Thus, for a map with a 1m x 1m resolution, misdetecting an obstacle on one pixel may cause a risk of collision.
To this end, we will assess the OMR: the ratio between the number of misdetected pixels and the number of truly occupied cell on a real map: ground-truth binary map of free and occupied cells. A misdetection occurs when a really occupied cell is considered as free or unknown. It is defined by the following expression:
OM R = 1 − NT P NT rueOcc
(2) where NT P is the number of true detected obstacles, and
NT rueOcc is the number of truly occupied cells.
IV. PERFORMANCE EVALUATION
A. Simulation Scenario
We consider the real intersection of two main streets (Quai du Commerce and Pont Robert Schuman) located in Lyon, France. Each street is four lanes wide, with two lanes in each direction. This intersection constitutes the center of a 400m x 400m area. The RSU, placed at the north-west corner of the intersection, plays the role of the fusion center. Simulated vehicles can reach a maximum speed of 50 km/h. We consider that the period of sending messages T is a multiple of 100 ms. Besides, we assume that vehicles arriving to the intersection are all equipped with ranging sensors, and are thus able to generate probabilistic occupancy maps.
In Matlab®, we setup a 2D LiDAR with a horizontal field
of view of 360o (azimuth aperture) for all equipped vehicles.
The complete setup of LiDAR sensors can be found in [7]. We have set decision thresholds as follows: Pmin = 0.3 and
Pmax= 0.7. The occupancy maps represent a zone of interest
of 100m x 100m.
For each considered scenario, we run 10 NS-3 simulations with a duration of 60 seconds each.
B. Maps Size and Resolution
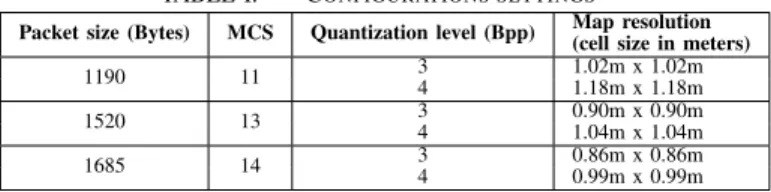
We evaluate the impact of changing messages size on LTE-V2X performance and on the global occupancy maps. Table I presents the considered sizes of the messages and the associated MCS to transmit a message through one TTI and 48RBs.
TABLE I. CONFIGURATIONS SETTINGS
Packet size (Bytes) MCS Quantization level (Bpp) Map resolution (cell size in meters) 1190 11 34 1.02m x 1.02m1.18m x 1.18m
1520 13 34 0.90m x 0.90m1.04m x 1.04m
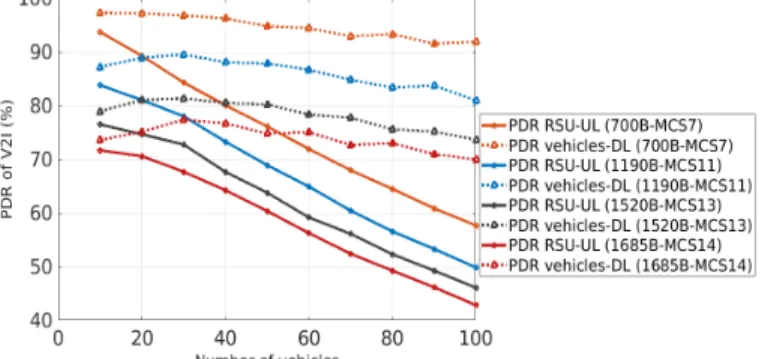
First, in Fig. 3, we evaluate the PDR in each case and we compare the results those obtained with 700-Bytes messages and MCS 5 (as considered in [8]). Note that a period of T =100 ms was considered for this evaluation. We can then observe that the PDR decreases for all the MCS when vehicles density increases (from 83% to 50% in UL for MCS11 with 1190 Bytes). Moreover, with larger packets size (and so with higher MCS), the probability of loosing packets sent to the RSU (UL) is higher, which may have an impact on the fusion result (PDR decreases from 58% to 43% for 100 vehicles). It is noteworthy that, in this case, packets sent from RSU to vehicles (DL) present a higher packet loss ratio. This may be critical in case of a collision warning.
Fig. 3. PDR of V2I for different MCS.
Fig. 4. OMR for different maps resolutions under perfect connectivity conditions.
In order to evaluate the impact of changing messages size on global maps, we calculate local maps resolution, for each considered packet size according to two probability quantization levels (Table I). We assess the OMR, as illustrated in Fig. 4 and compare the results to that of a high resolution map with 8 Bpp and 0.5m x 0.5m resolution. We note that in this evaluation, the fusion algorithm is executed every T =100 ms, without considering packet losses induced by V2X connectivity, so as to isolate uniquely the effect of quantization/compression on the global map. Furthermore, in order to shed the light on the interest of cooperation between vehicles, we add to the results the OMR in case of standalone mode (i.e., accounting for the detection capabilities of vehicles while relying only on their own on-board sensors). The latter is obtained by calculating the mean of OMR values over all local occupancy maps (i.e., prior to fusion). Fig. 4 illustrates the impact of cooperation between vehicles. A significant gain can then be observed through cooperative approach compared to the standalone mode. Certainly, with a standalone mode, each vehicle presents a limited field view. This is critical since it increases the possibility of misdetecting obstacles. It can also be observed that the OMR decreases as the number of vehicles increases. In addition, the best performance in terms of OMR is obtained for high-resolution maps. Indeed, performing a
quantization of probability levels on occupancy maps leads to a loss of precision that can engender considering some occupied pixels as free. We can also note that the OMR is relatively constant as soon as the number of vehicles in the intersection is greater than 20. This is due to the high vehicles density at the intersection that causes field view obstruction.
To summarize, as expected in idealized cases, the best performance in terms of obstacle detection would be obviously obtained with the maps with the best resolution and therefore with the largest packet size. However, using large packet sizes and in combination with high MCS, is expected to degrade LTE-V2X connectivity performance. Thus, we evaluate next the impact of LTE-V2X connectivity on obstacle detection performance, while trying to determine practical operating tradeoffs between the two.
C. Impact of V2X Connectivity on Obstacle Detection To evaluate the impact of LTE-V2X connectivity on the quality of the merged occupancy map and thus on obstacle detection performance, we compare for T =100 ms: 1) occupancy maps without packets loss (”genie-aided”) and 2) occupancy maps with packets loss (due to the LTE-V2X connectivity). Results are then illustrated in Fig. 5 with the evaluation of the OMR as the function of the number of vehicles in the intersection.
Fig. 5. OMR with and without packets loss.
Fig. 5 shows the impact of V2X connectivity on obstacle detection performance and we can observe an OMR degra-dation of about 10% compared to the ideal case without packet loss. Besides, in contrast to the no packet loss case, the OMR first decreases with the number of vehicles but then increases after reaching a critical number of vehicles (typically 20 in our case). This exhibits the correlation with PDR (UL) values that decrease with a higher vehicles density (Fig. 3). Indeed, the increase in the number of vehicles leads to an augmentation in the number of packet collisions and thus their loss. Furthermore, we notice the effect of images quantization on occupancy maps and we conclude that the configuration using a packet size of 1685 Bytes, a quantization level of 4 Bpp associated with the MCS 14 has the best performance in terms of obstacle misdetection.
D. Impact of Messages Period
In the following, we evaluate the impact of messages period on the global occupancy maps and the V2X connectivity performance. To do so, we assess the PDR (Fig. 6) and OMR (Fig. 7) for different values of T .
Fig. 6 gives the PDR in UL versus the number of vehicles for different configurations (packets size, MCS, application period T ). We can then observe an improvement in the PDR as the message period increases. Indeed, the increase of the period
Fig. 6. PDR at RSU (UL) with different values of T.
automatically decreases the number of packet collisions. For the configuration 1685 Bytes / MCS14, at 100 vehicles the PDR increases from 43% for T =100 ms to 65% for T =300 ms. Furthermore, for high vehicle densities, we can notice that T =200 ms and T =300 ms present close performance in terms of PDR. However, with T =100 ms, V2X connectivity performance decreases significantly.
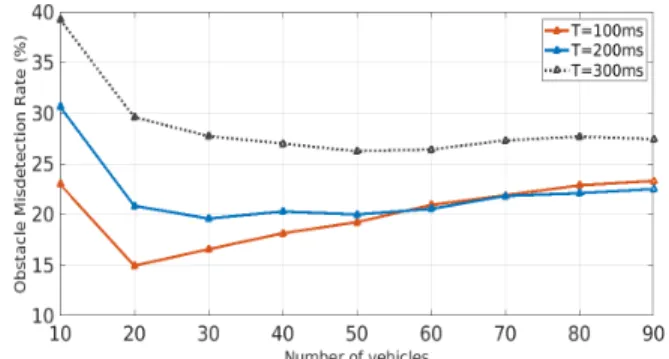
Fig. 7 illustrates OMR for different values of T . For this study, simulations were performed with the best configuration identified previously, i.e. packet size of 1685 Bytes packets, MCS 14 and 4 Bpp for the quantization. Packets loss has also been considered. We can see in Fig. 7 that the OMR increases with higher values of T . Indeed, increasing messages period will lead to extra latency (i.e., injecting outdated information) and thus, to a lack of coherence among the fused local maps, which can harm the quality of the global map. This will mechanically increase the probability of missing an obstacle present at instant t in certain locations. Furthermore, we can observe that, due to the impact of V2X connectivity perfor-mance, the OMR is better with T =200 ms when the number of vehicles is higher than 70. Indeed, as demonstrated in Fig. 6, with the increase of vehicles density, PDR values decrease with T =100 ms. This is correlated with a higher packets loss rate caused by a high number of vehicles trying to transmit every 100 ms and the resulting collisions. Consequently, despite the fact that increasing the refresh rates of local maps leads to high precision in terms of obstacle detection at each time instant, it appears that the value of T should be doubled in case of a high vehicles density due to LTE-V2X performance degradation. Moreover, the Channel occupancy Ratio (CR) based on the Channel Busy Ratio (CBR), as specified in [15], has been assessed for our scenario. It turns out that the Decentralized Congestion Control (DCC) mechanism should then be applied with T =100 ms only when the number of vehicles is superior to 85. Accordingly, in order to respect the CR limitation, one should double the refreshment period of the messages (i.e., T =200 ms) when exceeding this number of vehicles. In that case, the application of DCC is not expected to degrade obstacle detection performance.
V. CONCLUSION
In this paper, by means of system-level simulations, we have evaluated the potential and the limitations of LTE-V2X aided cooperation for improving road safety. More precisely, the focus has been put on a V2X-aided CoCA application in the specific context of urban intersections. Accordingly, vehicles equipped with LiDARs sensors, could share local occupancy maps, by relying on LTE-V2X connectivity. A RSU placed at the center of the intersection is able to fuse successively received maps in order to form a global occupancy map.
Performance evaluation showed that messages size of 1685 Bytes with 4 Bpp is suitable for global occupancy maps in terms of obstacle mis-detection ratio. Moreover, in the
Fig. 7. OMR with different values of T.
considered scenario, message periodicity should be set to 100 ms whenever the number of vehicles does not exceed 70, and to 200 ms otherwise.
As future perspective we aim at evaluating the integration of more realistic errors in local maps. Moreover, we will investigate adaptive application-driven transmission control mechanisms in order to achieve the best obstacle detection ratio under LTE-V2X performance and regulatory constraints.
ACKNOWLEDGMENTS
This work was supported by the European Union’s Horizon 2020 research and innovation program under 5G-HEART project (grant agreement No 857034).
REFERENCES
[1] X. Zhao, K. Mu, F. Hui, and C. Prehofer, “A cooperative vehicle-infrastructure based urban driving environment perception method using a ds theory-based credibility map,” Optik, vol. 138, pp. 407–415, 2017. [2] G. Soatti, M. Nicoli, N. Garcia, B. Denis, R. Raulefs, and H. Wymeer-sch, “Implicit cooperative positioning in vehicular networks,” IEEE Transactions on Intelligent Transportation Systems, vol. 19, no. 12, pp. 3964–3980, 2018.
[3] G. M. Hoang, B. Denis, J. H¨arri, and D. Slock, “Cooperative localization in vanets: An experimental proof-of-concept combining gps, ir-uwb ranging and v2v communications,” in the 15th Workshop on Positioning, Navigation and Communications (WPNC), 2018, pp. 1–6.
[4] G. Cecchini, A. Bazzi, B. M. Masini, and A. Zanella, “Performance comparison between ieee 802.11 p and lte-v2v in-coverage and out-of-coverage for cooperative awareness,” in IEEE Vehicular Networking Conference (VNC), 2017, pp. 109–114.
[5] A. Rauch, F. Klanner, and K. Dietmayer, “Analysis of v2x communi-cation parameters for the development of a fusion architecture for co-operative perception systems,” in IEEE Intelligent Vehicles Symposium (IV), 2011, pp. 685–690.
[6] G. H. Lee, J. D. Choi, J. H. Lee, and M. Y. Kim, “Object detection using vision and lidar sensor fusion for multi-channel v2x system,” in International Conference on Artificial Intelligence in Information and Communication (ICAIIC), 2020, pp. 1–5.
[7] A. P. da Silva, I. H. Brahmi, S. Leirens, and B. Denis, “System-level simulation of cooperative sensor data fusion strategies for improved vulnerable road users safety,” in the 16th Workshop on Positioning, Navigation and Communications (WPNC), 2019, pp. 1–6.
[8] A. Guizar, V. Mannoni, F. Poli, B. Denis, and V. Berg, “Lte-v2x perfor-mance evaluation for cooperative collision avoidance (coca) systems,” in IEEE 90th Vehicular Technology Conference (VTC2020-Fall), 2020. [9] M. Behrisch, L. Bieker, J. Erdmann, and D. Krajzewicz, “Sumo– simulation of urban mobility: an overview,” in the third International Conference on Advances in System Simulation. ThinkMind, 2011. [10] NS-3, “The network simulator,” [online] https://www.nsnam.org/, 2020. [11] V. Mannoni, V. Berg, S. Sesia, and E. Perraud, “A comparison of the v2x communication systems: Its-g5 and c-v2x,” in IEEE 89th Vehicular Technology Conference (VTC2019-Spring), 2019, pp. 1–5.
[12] A. Elfes, “Using occupancy grids for mobile robot perception and navigation,” Computer, vol. 22, no. 6, pp. 46–57, 1989.
[13] T. Rakotovao, J. Mottin, D. Puschini, and C. Laugier, “Real-time power-efficient integration of multi-sensor occupancy grid on many-core,” in IEEE International Workshop on Advanced Robotics and its Social Impacts (ARSO), 2015, pp. 1–6.
[14] K. Pathak, A. Birk, J. Poppinga, and S. Schwertfeger, “3d forward sen-sor modeling and application to occupancy grid based sensen-sor fusion,” in IEEE/RSJ International Conference on Intelligent Robots and Systems, 2007, pp. 2059–2064.
[15] “Intelligent Transport Systems (ITS); Congestion Control Mechanisms for the C-V2X PC5 interface; Access layer part, ,” Tech. Rep., ETSI TS 103 574, V1.1.1, Nov. 2018.