CHARGE EXCHANGE SCATTERING OF NEGATIVE PI-MESONS NEAR 1000 MEV
by
RICHARD KUMEO YAMAMOTO
B.S., Massachusetts Institute of Technology
( 1957 )
SUBMITTED IN PARTIAL FULFILLMENT OF HE REQUIREMENTS FOR THE DEGREE OF
DOCTOR OF PHILOSOPHY at the
MASSACHUSETTS INSTITUTE OF TECHNOLOGY ( 1963 )
Signature of Author ,'
-Certified by
--- --- - ---- - - - -- - --- -- - ---
----jtpartment of Physics, May 20,1963 Thesis super---isor Thesis supervisor
Chairman. Depagm) t Committee on Graduate Students _1_1 _i I 1YI,-ii --i -t I
;ss
~iLS ~ '"' '~ r-)k Llrvrl ~L iIIIBRAR I
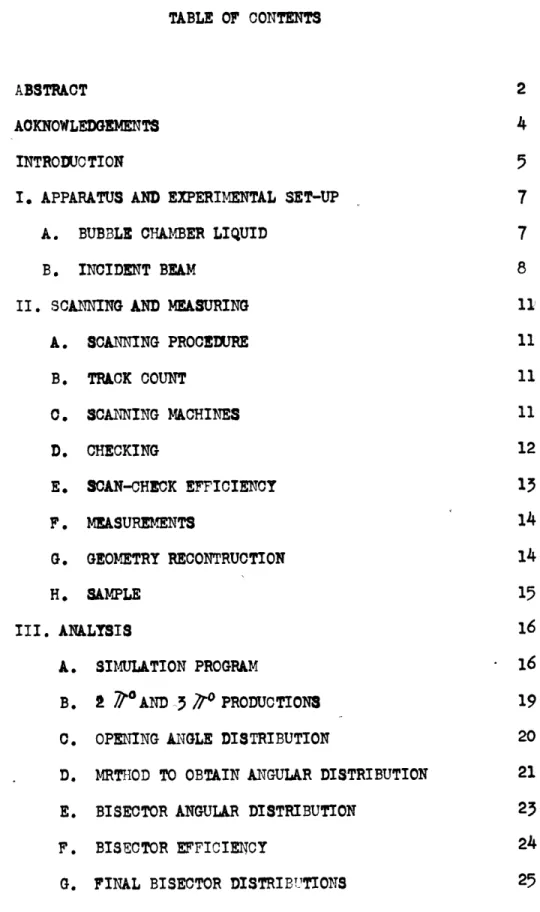
TABLE OF CONTENTS
ABSTRACT 2
ACKNOWLEDGEMENTS 4
INTRODUCTION 5
I. APPARATUS AND EXPERIMENTAL SET-UP 7 A. BUBBLE CHAMBER LIQUID 7
B. INCIDENT BEAM 8
II. SCANNING AND MEASURING 11
A. SCANNING PROCEDURE 11 B. TRACK COUNT 11 0. SCANNING MACHINES 11 D. CHECKING 12 E. SCAN-CHECK EFFICIENCY 13 F. MEASUREMENTS 14 G. GEOMETRY RECONTRUCTION 14 H. SAMPLE 15 III. ANALYSIS 16 A. SIMULATION PROGRAM 16 B. l r AND 3
;2
PRODUCTIONS 19C. OPENING ANGLE DISTRIBUTION 20
D. MRTHOD TO OBTAIN ANGULAR DISTRIBUTION 21 E. BISECTOR ANGULAR DISTRIBUTION 23 F. BISECTOR EFFICIENCY 24
H. ANGULAR DISTRIBUTION 27 I. TOTAL CROSS-SECTION 28 IV. DISCUSSION OF RESULTS 30 A. TOTAL CROSS-SECTIONS 30 B. t' PRODUCTION 52 C. FORWARD SCATTERING 32 D. Df- Fs INTERFERENCE 52 E. CHARGE INDEPEDENCE 33 F. ISOTOPIC-SPIN ASSIGNMENT 54 TABLES REFERENCES FIGURES ~ _~
CHARGE EXCHANGE SCATTERING OF
NEGATIVE PI-MESONS NEAR 1000 MEV
by
RICHARD KUEO YAMAMOTO
Submitted to the Department of Physics on May 20, 1963, in
partial fulfillment of the requirements for the degree
of Doctor of Philosophy
ABSTRACT
The differential and total cross-section for the charge
exchange reaction: IP--- A/ (I)
and the total cross-sections for the reactions:
r"@ -+7r"* 0-i-7r 0-4- (III) have been measured at an incident7r laboratory kinetic
energy of 910*5 Mev. The instrument used was a 15" heavy
liquid bubble chamber equipped with a 7" x 1 3/8" dia.
internal liquid hydrogen target. The reactions were
pro-duced in the hydrogen target and gamma rays from7Todecays
were observed in the heavy liquid. The differential
cross-section for the charge-exchange reaction (I) was found to be:
J& as o (.X, -*. ± r). () 7)X /,ao .)X = C s- jo _OS-4* .- X -(, __ )
d
C
..
o)
X -
59The total cross-scctions for reactions (I), (II), (III)
were (4.21*0.42), (3.93±0.44), and (0.38-0.27) m.b. respectively.
The differential cross-section for reaction(I) indicates
aD 5/2, F 5/2 interference in the T=- iso"spin state at the
900 Kev 7r-p resonsnce. The total cross-section of reaction (I) together with the known cross-sections for Trr-p
charged elastic, and rT-p cross sections are found to be consistent with the charge-independence hypothesis.
Thesis supervisor: Title:
Irwin A Pless
Associate Professor of Physics
ACKN OWLED GEIEN TS
I am greatly indebted to Professor Irwin A. Pless,
who suggested this experiment. I am also greatly indebted to
Professor Lawrence Rosenson who has contributed many ideas to
this experiment. A major part of the analysis technique
ised in this experiment is due to b6th Professors Pless and
Rosenson.
I would like to acknowledge the invaluable help of %r. Bruce ;,elson and also Mrs. Von Randow and her scanning
team, without whose aeffcient scanning this experiment would
not have been possible.
To Dr. F. Bulos, ir. H.Crouch, Professor R.E. Lanou,
iir. J. \assimo, and'Professor A. Shapiro I acknowledge my
appreciation for their help in setting up the experimental equipment, making the etposures and analysing the data.
kany thanks are also extended to Mr. C. Bordner,,Professar
A. Brenner, and Dr. E. Ronat of Harvard University for the
use of their computor programs, without which, the data
reduction would have been very difficult to carry out.
I would also like to acknowledge assistance in the early phases of this experiment by Professor M. Chretien and, Dr. D. Firth.
ky sincere gratitude is expressed to Brookhaven National
Laboratory and to the Cosmotron group in particular, without
whose efforts and support this experiment would not have been
possib e.
I . INTRODUCTION
In recent years, it has been established that the total cross-section as a function of energy displays two
distinct peaks at around 600 and 900 Mev incident pion
kinetic energy for the reactions
(V)
1-5
and 7r t 7 -t - P
Ir,-P g- 6-.0. A 6
On the other hand, the cross-section for the reaction
7T
+P -9
7
+*P
(VI)
does not peak at these energies (3,4). These results seem
to indicate a resonant behavior at 600 and 900 Mev of the
pion-nucleon system in the T-, iso-spin state.
The 600 iev peak is believed to be a resonance in the J=3/2, T= state 7T9 whereas the 900 Mev peak may
10-11
possibly be in a state with Ju5/2, T 10-11 However, it
12
has been recently suggested by Kycia, et al that the 900 Mev peak may be due to an inteference between the D- 5/2,
T03/2, and F-5/2, T'# wave amplitudes.. The purpose of this paper is to report on the study of reactior(I) which may
contribute toward the establishment of states involved at
the 900 Mev resonance.
The charge-exchange differential cross-section (I) was
measured by Weinberg, et a113 in a 15" heavy liquid bubble
chamber, with the chamber liquid itself supplying the
pro-tonic target. In order to be certain that there would be no
s~--U~YII-9---~---i
contamination from quasi-elastic interactions, we have
chosen to carry out our measurements in a 15" heavy liquid chamber, identical to that used by Weinberg, et al, but
equipped with an internal liquid hydrogen target.
This experiment was carried out at the Cosmotron,
Brookhaven National Laboratory, in the fall of 1961. _ _
Eu- -_ -~ __I__ ______ _ _~_
I. APPARATUS AND EXPERIMENTAL SET-UP
As mentioned before, the
i7
-decay gamma ray detectorused in this experiment was a heavy liquid bubble chamber,
with an internal liquid hydrogen target which provided the
target protons. The target is cylindrical (7" length by
1 3/8" diameter) and is encased in a 2" diameter outer cy-linder which extends into the chamber. (See Fig.I-l). A
Detailed description of this internal hydrogen target will be
given elsewhere 14-15 .The 15" diameter by 14" depth (51
liter capacity) heavy liquid chamber used in this
experi-16
ment was identical to that discussed by L. Rosenson and
17
J. Szymanski except for provisions to accept the hydrogen
target. All equipment associated with the operation of the
16
chamber itself was also identical to those already described
Photographic exposures were made on 35mm. non-perforated
Linograph-Shellburst film under bright field illumination.
Three cameras were situated symmetrically around the peri-meter of the bubble chamber, allowing for 150 degree stereo
photography with any two cameras. The cameras are discussed
18
in detail by Averell
A. BUBBLE CHAVKBER LIQUID
The bubble chamber liquid used in this experiment
consisted of three components: methyl iodide (CH I), freon
B 13 (CF3BR), and ethane (C2H6 ). The volumetric fractions
'',
*' .,i
i
s
The proportions of each component were determined by weight,
and the volumetric fractions were then computed using known
densities. The radiation length was then computed to be
9.949 gms/cm2 . The density of this mixture was computed using
the known densities of each component at room temperature.
During the course of heating the chamber from A2 7 C to
#ll-0 C, 6 liters of the liquid were taken out of the chamber to allow for thermal expansion. Taking into account this
volumetric expansion, we find a liquid density of 1.6f*5%
tem erature
gm/cc. at the operatinr The 5% error on the density is an
estimate of the error in measuring the amount of liquid re-moved during the heating process.
The gamma ray conversion length, as a function of gamma
ray energy, is related to the radiation length in the
follow-ing way: A(S) X/ti)
=-o.
f3O+c
2 /o3,(6) -.OID3CAk(E)]7Z(V11)where x, is the radiation length of the bubble chamber liquid
in cm., and E is the energy of the gamma ray, in Mev.
The energy dependent coefficientA(E) was determined for
18
this mixture by the use of Averell's computor program which
19
carries out a least-squares fit to the Bethe-Heitler formulain terms of a power series of log (E). The conversion length
as a function of gamma rayAIlSlotted in Fig. 1-2,
B. INCIDENT BEAM
-The "pencil" beam used in this experiment was designed
tb give from 5-15 particles per pulse with a beam
cross-section of ,%" and with incident momentum of 1038-% hiev/c.
20 The details of this beam are discussed elsewhere
The pion beam (See Fig. I-3) was produced by collision
of protons from the Cosmotron's external beam P2 onto a
3/' x 3/8" x 7" carbon target situated in the bending magnet
o
204. The negative pions produced at 0 with respect to the
target axis were then deflected 290 by magnet 204. Quadru-poles 205 and 206 were used to focus the beam at the
Heavy-met acceptance slit. The momentum selection was made by
bending magnets 207 and 208. Ivagnet 209 deflected the beam, allowing photons from 7tdecays to travel in a direction 160 from the beam, reducing the photon background to a negligible level. The final focus, in the center oflthe beam finger
target, was carried out by quadrupole magnets' 210 and 211. The beam trajectory was designed by R. Lanou using the
21
computor programs of J. S'anford and J. Sandweiss and
22
those of R. Pinon and R. Lanou. The beam itself was then
simulated by wire-orbit techniques and properties of the beam
measured by ray tracing.
The muon and electron contamination in the beam have 20
been estimated to be 6.7% and 0.2% respectively, by Lanou
The photon contamination is negligible due to bending of the beam at Magnet 209 as stated above.
During the set-up of the beam, a 2-" freon bubble chamber
was used to locate and study the cross-sectional profile of
the beam. This was done by placing the window plane of the study chamber at right angles to the beam -- thus directly _ _~ __ ~~__ ____ _~--~t40crr~hlYLnr
Wool MIN 1 0'
observing the cross-sectional profile of the beam. This
23
technique is reported in detail by Bulos, et al
The resulting beam was found to be tightly collimated
with a maximum cross-sectional diameter of .67". A study of the beam profile in the plane parallel to the bubble chamber windows has been carried out by the Brown University group by observing directly on scanning projectors the track
distri-bvtions inpictures. The distribution of the tracks along the
axis perpendicular to the window plne has been obtained by
measuring centers of nuclear stars that occur in the liquid
of the chamber due tO interactions by the beam emerging from the hydrogen target. Measurements were carried out in three views and the coordinates of the stars were reconstructed in
space. The distributions obtainedare shown in Fig. I-4hb.
Because the distributions were narrow and the events fell well
within the target, it was not necessary to consider the
unfold-ing of resolution spreads due to measurement errors and
mul-tiple scattering of the beam in the liquid. It is clear from
these distributions that the beam was well centered within the
target. As another check on the position of the beam, 1300 pictures were taken without any hydrogen in the target, and
two pictures contained possible 2( events. These events
were measured and found to have come from interactions in the
chamber liquid , and not the beam finger wall.
II. SCANNING.AND MEASURING
A. SCAYNING PROCEDURE
-A total of 98 rolls of film, each containing an average
of 620 exposed frames, were divided into two groups and were
scanned independently by the M.I.T. team and the scanning
team at Brown University. The M.I.T. team was responsible for
the scanning of 48 rolls and the Brown University team for 50
rolls. Scanning by both teams was carried out in the same
fashion. Three views of each picture were looked at
simultan-eously, and all events containing two or more gamm&.:rays ("gamma
rays" will be used to denote the tracks due t6 the converted
positron-electron pairs) pointing towards the beam finger (hydrogen target) were recorded as possible good events. The
total number of such gamma rays and the number of charged
tracks scattered out of the beam finger by more than ^16e
were recorded along with the picture numbers of each selected
frame.
B. TRACK COUNT
-Throughout the scanning procedure the number of tracks
in every tenth picture frame was reported. The total number
of negative pions encountered in this experiment was found tor
be 3.872 x 10⁵ .
C. SCAN ING MACHINES
-The scanning machines used at M.I.T. consisted of two
sets of three (Model) MPC-1 Recordak 35 mm. film projectors,
11
The Brown University team used one set of Recordak
pro-24
jectors and one "Yale" projector. These latter are capable
of driving three rolls of film and because it is possible to switch from one view to another, they may be operated by a single scanner to scan the three views at the same time. D. CHECKING
-Every event selected by the scanners was rechecked and
decided upon by the physicists to determine its category. The
quality of the gamma rays themselves was divided into two types-"Clean" gamma rays and "CIS" gamma rays. A "clean wamma ray
is defined as one whose point of conversion corresponding to
the origin of the seemingly single track ("nose of gamma ray)
formed by the narrow angle (4 5) vertex of positive-negative
electron pair, is not obscured in more than one view by the
beam finger or is not in the fiducial beam region in more than
one view-- the fiducial region being defined by a band equal in width to one third the diameter of the beam finger and with axis corresponding to that of the beam. A "CIS"
(Converts in Steel /Shadow) gamma ray, on the other hand, is one that is obscured by the finger or falls in the fiducial beam region in two or three views or one that converts in the
steel wall of the beam finger.
A fiducial chamber volume was defined as the truncated
conical volume formed by the projection, onto the front
win-dow' (as viewed by a camera), of a circle of radius lam.
smaller than that of the rear window and concentric with the
rear window, with major and minor base planes parallel to and
5.8 cm. from the windows, ( Fig.II-1). Any zamma ray that does
not convert in the fiducial volume ~d at least two views is
considered as non-existant. Thus, for examriple, sn event
con-taining three"clean" gamma rays, two of which convert in at
least two fiducial volumes and the third in only one is
con-sidered as a "clean" two gamma ray event.
The intersection points of the "clean" gamma rays were
determined by extending their"noses" with a straight edge on
the projector screen. The intersection points were then checked
for consistency in the three views to determine whether they
were from interactions in the beam finger or accidental
inter-section of two or more unrelated gamma rays, All events with
two or more "clean" gamma rays and with charged tracks scattered
from the beam direction by more than 10* were checked to
det-ermine6whether the charzed track(s) were associated with the
gamma rays. This was accomplished by extending the charged
tracks back into the beam finger to see if they formed a
com-mon interaction point with the gamma rays.
E,. SCAN-CHECK EFFICIENCY
-Thirty rolls of the total ninety eight were scanned twice, and forty eight rolls were checked twice. The scanning
ef-ficiency of , single scan is defined as the ratio of the
num-ber of identical events found by both scans to the numnum-ber of
events found by the other scan only. The checking efficiency
is similarly defined -- the ratio of the number of events
selected in common to that selected by the other check only.
The overall scan-check efficiency was then found to be
0.91*0.02. The error is due to statistics only.
F. MEASUREMENTS
-The gamma rays in each selected event were measured on
Hydel measuring machines. Two points, one on the vertex of
the gamma ray "nose" and the other 2.5 cm. back along the
straight edge extension of the gamma "nose" were measured on
each gamma may. The output coordinates in each view
consis-ting of coordinates for the points on each gamma ray and
co-ordinates of fiducial marks on the bubble chamber windows were
automatically punched on IBM cards for data reduction. Each
event was measured twice by a different person.
G. GEOMETRY RECONSTRUCTION
-The measurement data cards were used in conjunction with 25 the geometry reconstruction program written by M. Chretien
The results of the geometry program were then used with the
Least-Squares Fitting program, TRKEXT, of C. Bordner, and A.
26
Brenner . This program will construct lines passing through
the origin of the "noses" of each gamma ray and will constrain
these directional lines to intersect at a common point. Then
by iterative procedure, the intersection point may be allowed
to move throughout all of space, or, as an alternative mode,
2
along a prescribed line, Antil a minimum X2 value is obtained
between the originally measured gamma ray directions (determined
by the two points measured on each extended gamma ray "nose")
and the 'directions resulting from this adjustment.
In order to select the final sample of events, the two
measurements of each event have been treated by allowing the
intersection points to move throughout all of space..Any event
having its intersection points of both measurements falling
14
inside the hydr6gen target (within their errors) was
accepted for the final sample, 97original events were treated
in this fashion andZ7were accepted. Of the4 6 events that
were :rejected,J3 were found to be consistent with interactions
of stray pions in the bubble chamber liquid and /Zwere found
to have inconsistent results between the two measurements
due to very badly defined gamma ray "noses".
Both measurements of these selected events were then
treated according to the second mode of fitting, allowing
the intersection point to move along the axis of the beam. 2
The measurement displaying the better X value was selected
for use and their gamma rays were Lorentz transformed back
into the 7t-pC.M. System, The opening angle between each
combinatorial pair of gamma rays, and the cosine of their
bisectors, were then determined in this frame of reference.
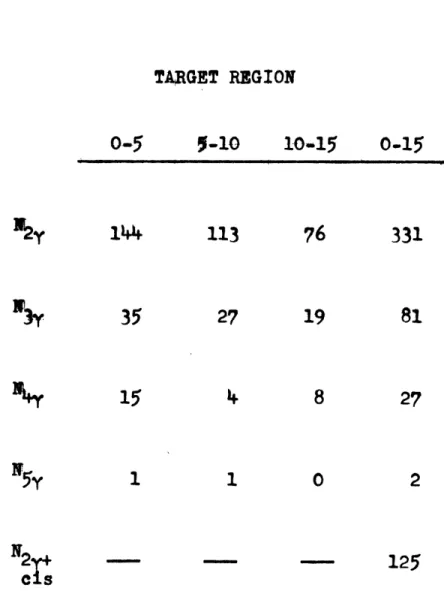
H. SAMPLE
-The length of the beam finger was divided into three
adjacent sections -- each 5 cm. in length, from 0 to 5 cm., 5 to 10 cm., and 10 to 15 cm. klong the x axis (See Fig.II-2).
0 corresponds to the geometric center of the bubble chamber.
The events were then divided into three sub-groups
accord-ing to which of the three sections of the tube the
inter-action occurred. The number of events of each type in the
three sections of the tube is tabulated in Table II-1. The
entry called 2
+
"CIS" represents the events found in 45 rolls with at least two "clean" gamma rays plus any numberof associated "CIS" gamma rays. This was recorded for the
purpose of internal checking and will be spoken of later in
the text.
IICIIIIIII~-
III. ANALYSIS
A. SIMULATION PROGRAM
-Because of the highly complicated geometry of the
bubble chamber-target arrangement, it was necessary to
determine the various efficiencies for observing gamma rays by means of a Monte-Carlo type event simulation
pro-gram. This program, by taking into account the energy
dependence of the gamma ray conversion probability, will
simulate an event and check -to
see if the gamma rays lie within a prescribed fiducial
volume, and also checks to see if the gamma rays are
ob-scured by the beam finger or fiducial beam region. In
particular, it uses a phase-space generating sub-program
27
(RDECAY) written by Brenner and Ronat . Thus, the sequential
operation of the simulation program for a single simulated
event is as follows:
1) An interaction point is picked randomly in the beam finger according to a prescribed beam distribution.
In this problem, a square beam cross-section was used, with
the side of the square equal to 1.70 cm. The distribution
used along the length of the target was uniform.
2) In the case of multiple pion production the momentum
and direction ( in the 7T-p center of mass system ) of the neutral pions produced are determined by RDECAY, according
to phase-space distributions. In the case of elastic
scat-tering, the momentum of thepis constant and the angular
---distribution is determined by any ---distribution that is fed
into RDECAY.
3) The neutral pion(s) are then allowed to decay.
4) The energy and direction of the pion decay gamma rays
are then Lorentz-transformed into the laboratory system.
5) Each gamma ray is then allowed to convert ccrding to the
exponential law: dP
JR
wherek is a function of the gamma ray energy E and is given by equation (VII) of page8 . R is the distance of the gamma
ray conversion point from the77 decay point.
6) The gamma rays are then viewed by three cameras to see if they are within the prescribed fiducial volume.
7) The gamma rays that are within the fiducial volume
are then tested to see if they are of the "clean" or "CIS"
category, and are identified as such.
8) The center of mass values of the opening angle and
cosine of the bisector of the opening angle of the
combin-atorially paired gamma rays are then stored for futute read
out.
9) The event is categorized according to the number
of gamma rays that fall outside the fiducial region, the
number that are of the "clean" type and the number of the
"CIS" type.
After a predetermined number of simulated events have been treated in this way, the probabilities for observing
the various categories of gamma ray conversion modes are
i-r
_I
given . In the case of elastic scattering, the efficiency
for observing events, as a function of their bisector
direc-tions in the C.M. System, is also given. Histograms of the
various opening angle and bisector directions are also
given by the program.
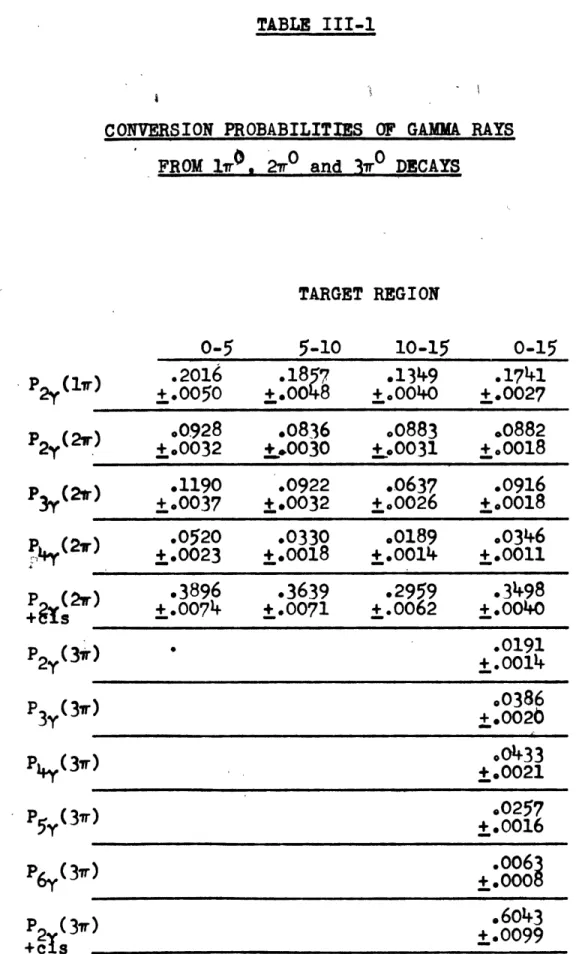
The probabilities for observing events of the various
conversion modes are shown in Table III-1. The criteria for
accepting events were the same as those used in accepting events for the actual samples.
The opening angle distributions of the combined 3 and 4
gamma ray observed sample is shown along with the combined 3
and 4 gamma ray sample produced by the simulation program in
Fig. III-1 assuming a phase-space distribution for 21T
pro-duction. The 3 and 4 gamma ray contributions from 31
produc-tions have been neglected. The distribuproduc-tions for the X, Y,
and Z (See Fig. II-2) coordinates of the gamma conversion
points for the combined 2' , 3Y , and 41 observed samples
are compared with proportional combinations of- the 2 , 3 ,
and 4 Ysamples from the simulated events. These distributions are shown in Figs.III -la, b and c. It should be pointed out
that since the simulation program approximates the
hemis-pherical end of the beam finger as a straight ends we have excluded this region from the samples before normalizing.
-. , All comparisons are in substantial agreement and
indications are that the phase-space model accounts for the
B. 2 AND 3 r*PRODUCTIONS
-Using the probabilities for the various conversion
modes (Table III-l), and the number of 3 gamma, 4 gamma,and
5 gamma events in the observed sample, we. are able to
deter-mine the number of 2M7 and 317productions.
We shall use the entire sample, from 0 to 15 cm. of the beam finger in order
to increase the statistics.
Taking the number of 5 gamma events observed and the
appropriate gamma ray conversion probability, we find the
number of 3 7P"to be:
l
(3
78
5
5
The number of events appearing as 4'r, 3 ?', 2+CIS, and
2 ' events due to 3 i decays are then found to be:
S(3;7)
=
3.4
t
./
The number of 2 7?*events can be determined from the
number of 37events and independently by the number of 44 events. Using a weighted average of the numbers obtained
both ways, we find the number of 2 Thevents to be:
n (21 = s06 .
B6
Using the number of 2 l7and 3 7 events thus obtained,
the number of 2+ CIS events is predicted to be 329 ' 45.
However, only 44 of the 98 rolls have been scanned for 2
+ CIS events, and by taking this fraction into account, 147 t 22 2+CIS events should be observed in 45 rolls of
film. The number actually observed was 125 ± 11 which is in good agreement with the predicted number.
19
C. OPENING ANGLE DISTRIBUTION
-The theoretical opening angle (angle between the decay
gamma rays) distribution of the gamma rays from 7decays is
given by COS (I-)
where 9 is the opening angle and # is the total energy of the
Z*,
in units of the 7)1'mass. The distribution (Fig.III 2)is sharply peaked at the minimum opening angle given by:
The actual distri.bution which should be observed in the
bubble chamber was estimated with the use of the simulation
program. This opening angle distribution was obtained using
a second guess to the charge exchange angular distribution
(this second guess will be spoken of in detail below) and allowing for a 3aussian resolution function of 2.0 tidth to
be folded into the distribution. This resolution width was
obtained by plotting the difference of the opening angle
values taken from the results of two measurements. If the
error in the opening angle is Gaussian distributed, with
width 'P then it can be shown that this difference
dis-tribution is also Gaussian distributed with its width being
equal toJif.o The opening angle difference distribution is
shown in Fig.III-3. It cannot be fitted by a single Gaussian
curve but a close approximation would be a Gaussian of ',
width.
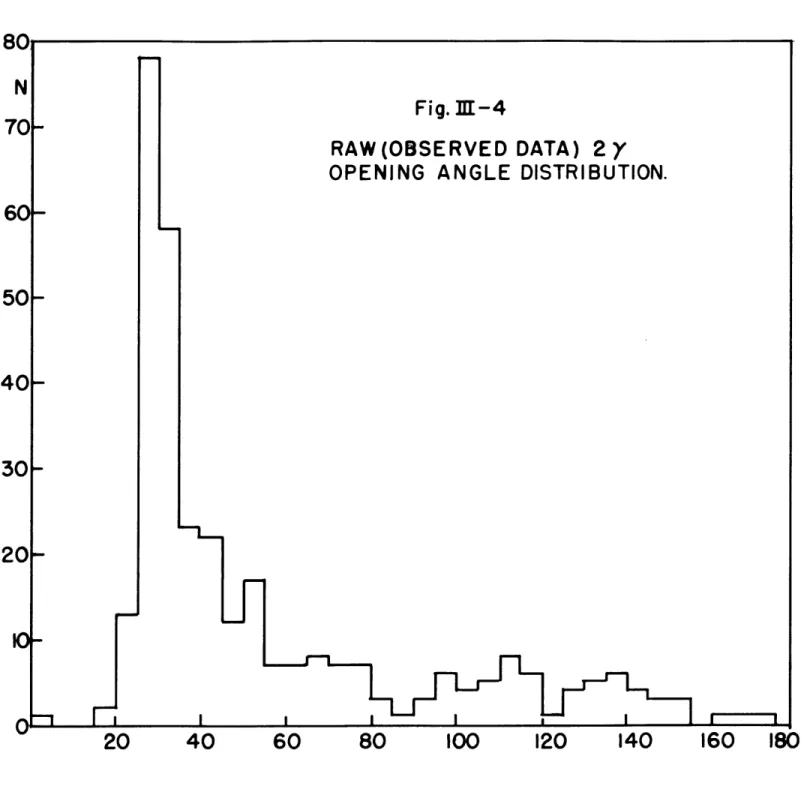
The observed 2
r0
opening angle distribution is shown in Fig. III-4. This sample is contaminated by the 2 o events dueto 2 '?decays, and by a negligible amount due to 3 77*0
de-cays. The number of events that appear as 2 converted i rays,
due to 2 /Odecays, is given by:
Ar
(r)m
n
(ar
PLr)
UPi =(8061
86X-c8Z) =71 8
By using the shape of the combined 3 and 4 1 opening angle
distribution and normalizing this distrib*tion to 71 ± 8
events we trb-then able to subtract the background
dis-tribution from the observed 2 i opening angle disdis-tribution.
The resulting distribution is shown in Fig. III-5. The dotted
curve represents the opening angle distribution from the
simulated program, normalized to the number of events in the
subtracted distribution between 0 and 85 . This limited
opening angle range for normalization was chosen since any
neutral decays of andAS should show up with minimum
open-ing angle between the decayparays to be about 90 . The
exis-tence of neutral I mesons due to charge exchange in the observed
sample is evident from this comparison. The 29 t 8 residual
2 P ray events beyond 90° opening angle are due chiefly to
the 2 *4 decay mode of the 47 and to a lesser extent to
decays from the neutral decay mode of A , and to an almost
negligibleamount due to decays of/ in the tail of the 2/'
distribution
D. METHOD TO OBTAIN THE ANGULAR DISTRIBUTION
-When a O in motion decays, the actual /# direction
lies between the decay gamma rays and for opening angles near
the minimum opening angle 8 min.' lies very close to the
bi-sector of the opening angle. The angle between the P and
the bisector, e 7.1., can be represented as a function of the
opening angle by the following relation:
0
S (9
C)
c77
0L-S
ve/oc/ly
This function is plotted in Fig. III - 6.
.One can see that most of the time the bisector
di-rection is a very good approximation to the /2 didi-rection
since the opening angle distribution is highly peaked at the
minimum opening angle (at the minimum opening angle, the
bisector and /0directions coincide). Thus, one would
expect the opening angle bisector angular distribution in
the /7 -p C.ivi. System (where thenSj from charge exchange
events are mono-energetic) to be very nearly the same as
the 7) angular distribution. If the &f'angular distribution is expanded in a Legendre polynomial series
S A P P coS) (Ix)
it can be shown that the opening
angle bisector distribution is given by:
L 0rx k aa
clas ,,
.lo
(x)
where BL is given by:
o
=
i
PA£.
(cps'se.,)
coer(e-)
C/(C Gs) (XI)The values for BL for an opening angle limit of 50 and
various /" velocities have been numerically integrated and
are presented in Table 111 2.
I-The general procedure to obtain the /?angular
dis-tribution is then as follows:
1) Obtain the opening angle bisector distribution in
the l""-p C.N. System for observed 2eevents.
2) Using the results from the simulated program,
de-termine the amount of background events expected from 2)e
(the background contribution due to 3?'is negligible).
3) Normalize the opening angle bisector distributions
of the observed 3 and 4 7 samples to the determined number
expected and subtract from the observed 2 74 bisector
dis-tribution.
4) Correct the number of resulting events as a
fune-tion.of bisector angle by the approximate efficiencies (Table
III-3) for observing the gamma rays giving rise to the
bi-sector.
5) Determine the CL's by means of a least-squares fit
between the corrected data and the Legendre polynomial
series.
6) 'Divide each C1 by the approximate BL to obtain the
expansion coefficients At for the
Z*
distribution. E. THE BISECTOR ANGULAR DISTRIBUTION-For the determination of the bisector angular
dis-tribution we have limited our sample to events having
opening angles between 25 and 50 degrees only, The reason
for this limitation is that, in taking events with wide open-ing angles, the number of sopen-ingle /2 events gained is not much
I
F- r _ ~~_ __ ~ ~_~~~_~~r~
more than the number of background events gained. This is
sb since the
7T
distribution peaks at 25 degrees and drops oftvery rapidly as the opening angle increases, whereas the background distribution is very broad.
This limited opening angle sample was then sub-divided
into three groups in accordance with the target region (0-5, 5-10, 10-15 cm.) in which the interaction occurred. This
was done since the efficiency corrections for the bisectors
are slightly different for these three retjons (See Table III-3).
Each regional sample was then treated independently.
The background distribution was determined by scaling the bisector distribution of the combined 3 and 4)sample to
the number of background events predicted by the simulation
program results. This distribution was then subtracted from the observed 2 ) distribution. The resulting distributions
were then corrected by the bisector efficiencies obtaibed
in the manner below.
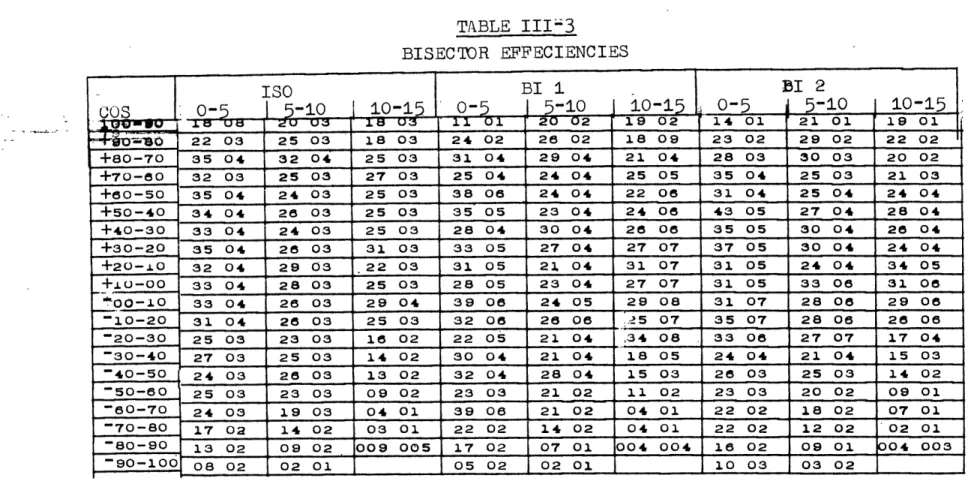
F. BISECTOR EFFICIENCY
-In reality the bisector efficiency ( the efficiency for obsarving an event giving rise to a opening argg~gbbeaa t lying along a given direction) is not independent of the 1T
angular distribution, sincea given bisector polar angle may correspond to bisectors from decays of 7 's with different polar angles and necessarily different opening angles. How-ever, the gamma rays may-be going in various directions and possess various energies, and it is their conversion
pro-I
__ __ ___
babilities which determine the bisector efficiencies. It is clear that if only events with the minimum opening angle
are considered, the bisector efficiencies would be independent
of the distribution since, in this case, the 7Tdirection
and bisector directions coincide.
In our case the opening angle range (25-50) is
suf-ficiently small that large deviations in the bisector
ef-ficiencies due to different ITangular distributions a re, not
expected. Table III-3 contains the bisector efficiencies
obtaihed by usingisotropic 1T distribution, (ISO), using
the bisector distribution obtained from the observed 2)sample, without subtractions or corrections, as a first guess to the
7Tdistribution (B1 1), and finally, using the bisector
dis-tribution obtained from the background subtracted sample
which was corrected by efficiencies froni (B1 1) as the second
guess to the 7T distribution (B1 2). In principle, one could
carry out an iterative procedure of this kind, but it is
clear from these results that after two iterations the bi-sector efficiencies are identical, within statistics.
G. FINAL BISECTOR DISTRIBUTIONS
-The final bisector distributions in the three regions of
the target are shown in Fig.III-7. These distributions were
obtained using the final bisector efficiencies (BI 2) given
in Table III-3. Any bisector direction with efficiency less
than 0.10 was not considered since the correction necessary was thoughtto be too large ( approximately four times the smallest correction made which was 1/0.40). After
correcting the distributions for each region, an average of the three independent distributions was taken. This final
average is shown in Fig.III-8. The dotted curve in Fig.III-8
represents the corrected bisector distribution obtained by
using the efficiency corrections resulting from the first guess (BI 1). (See TableIII-3).
One can see that both distributions are in good agreement
as expected. It should be noted that the last cosine
inter-val bin(-1.0 to 0.90) in the extreme backward direction has a bisector efficiency of 4.10 in all three regions of the
target, and according to 6ur criterion, should not be used.
However, in order to make an estimate of the number of events
expected in this interval, we make the following observation: no true events in the sample, in any region of the target, were found to fall in this interval - thus, the best esti-mate of the number in this bin is O. If we found at most 1
event to fall in this interval, and using the highest ef-ficiency (0.049), we would expect an error of t( 9.7 ). We
therefore estimate the number in this interval to be 0.0
As an internal check, the sum of the events in the
useful cosine interval bins (bins with 6>.10) was
com-pared with the sum of events in the corresponding bins of the averaged distribution, for each region of the target.
The comparisons are:
O - 5 Target region cosine range -1.0 to -0.9
0-64Y
4rNor
y
5 - 10 Target region cosine range -1.0 to -0.8
10 - 15 Target region cosine range -1.0 to-0.5
A4.srw
=
/76 t
17
A1,'r
=r
a gye4e-We see that the comparisons are in substantial agree-ment.
H. ANGULAR DISTRIBUTION
-A least-squares fit for the function
1(X)
to the final averaged bisector distribution was carried out 2
for . ranging from C to 6. The X probabilities are plotted
as a function of IL in Fig. III-9. We see that at least the
L05 term is necessary in order to obtain a good fit to the
distribution. The solid smooth curve in Fig.III-[O represents
the fit with L15.
The true r ansular distribution for the various fits
are obtained by correcting each polynomial coefficient (C )
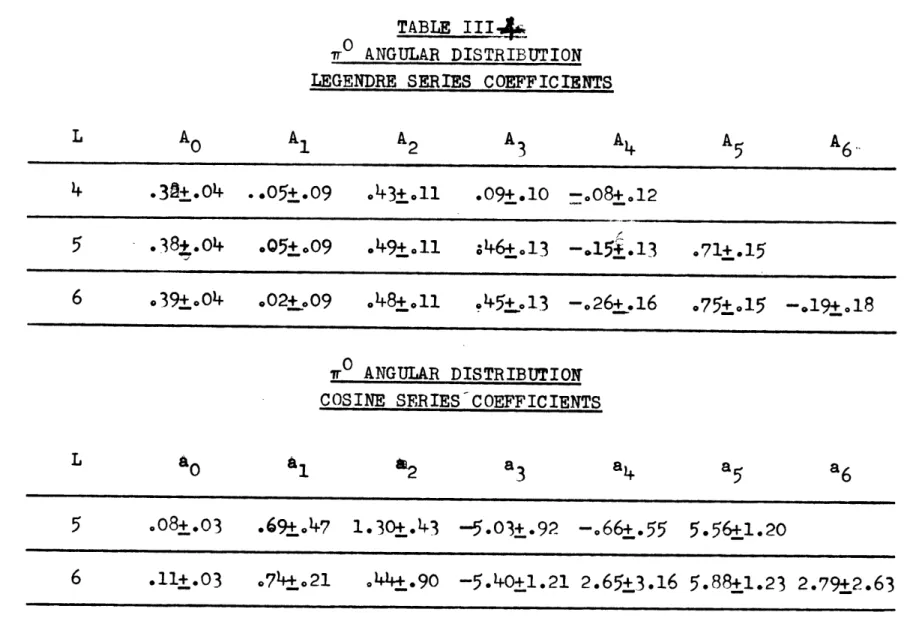
by the appropriate correction factor (BL) given in Table III-2. The true 7tdistribution coefficients are shown in Table
III-4. Also shown in Table III-4 are the coefficients for the
cosine expansions
e
for the 5th, and 6th order fits to the final 7 distribution.
The dotted smooth curve in Fig,III-10 represents the &*angular
distribution for L=5. i__ii______sli__jta~
I. TOTAL CROSSL~SECTION
-The total cross-section corresponding to events is
given by the following expression:
r= Nx
1o"
.a
N b,
PA
0L
n
ssO 9c)(-)( S-)
N - Total number of events
7
- 0.07 ms/cc - density of liquid hydrogenAO- 6.02 x 10²³ -- Avagadro's number
L - 15.00 - 0.42 cm. - Length of Target (theL-uncetainty
is due to the uncertainty in the reconstruction of the gamma
ray intersection; . I ; - , I
Nw - (3.872 x 10⁵ - Total number of particles
E, - 0.91
*
0.02 - Scan-Check efficiency/A- 0.067 - Kuon contamination of the beam e - 0.002 - Electron centamination of the beam
o 28
o - 0.0119 - Fraction of ITs decaying by a single Dalitz pjr.
o( is then found to be:
Using the number of 21*and 37"found above, we find
the corresponding total cross-sections to be:
The total cross-section for 37T production is presented on the basis of only 2 five-gamnma ray events.
The differential cross-section for charge-exchange usinr
R
zR
I
a ---~-~
the results of the 5th order fit is then:
.
=
6 oaer c~+(?.. 47LM v30c.± ..4 L-- . (S 03T A .;', .4 (.. ±Z zoj xs &and the total cross-section is: K=
The 29t8 excess 2/ray events observed in the opening
IV. DISCUSSION OF RESULTS
A. TOTAL CROSSSECTIOINS
-The ratio of t.-e total cross-sections for the reactions:
7r+P-
77r'o+
(I)
and 7*P-7and am
QP*OVA (II)
found in this experiment is.IG7±4.16) whereas the ratio ob-served by the group at Saclay i s G. (.*4) . There
seems to be a clear discrepency between the results. However,
the sum of the cross-sections for the above reactions seem to
be in substantial agreement -- (8.1± .6) mb, from this
experi-ment as compared to (10.9*0.9)mb. from the Saclay experiexperi-ment.
The reason for this slight difference in the sums of the
sections may easily be due to the fact that the
cross-section is rapidly changing (falling) with energy in this
region. The discrepency in the ratio of the cross-sections,
however, cannot be accourted for by this fact. Even if we assupe our measurement of the bckground due to 371T's to be low by as much as a factor of two, we obtain a ratio, of
(1.2t0.2), which is still in disagreement with the Saclay
results. It therefore seems that this discrepency cannot be
accounted for by possible uncertainties in the 37 0
contam-ination.
Another possibility for this discrepency may simply be
due to errors in seperating out the various 77productions, in
either or both of the experimental methods used. In teference _~ _~~__ _~ I___ ~C~ __~
to this alternate possibility for discrepency, we can speak only of advantages in our method. They are as follows:
1) The single 77cross-section does not depend strongly
on 2
Pcontamination
since our limited opening angle range ( 25 to 50) automaticblly excludes most of this backgroundand all of that due torlandA 's.
2) The 2 nproduction is determined directly from the
observed number of events having more than two gamma rayS-.thus, this samole cannot be contaminated by the l hevents.
3) The conversion efficiencies used are results from a
simulation program which allows for several internal checks.
(These internal checks were previously mentioned throughout
the text.)
4) Since we "observe" the gamma rays, we have further checks between various observed distributions (opening angles;
conversion points etc.), and corresponding distributions pre-dicted by the simulation program.
5) Because of the strongly peaked characteristic
dis-tribution of the opening angle due to single charge exchange ob's, we are certain we are dealing with charge exchange events.
13
Weinberg, et al , have also measured the cross-sections
for the reactions (I), and (II), at 960 iiev, and their results
agree with those of the Saclay group. However, in the report
of their results, there is no indication of any clear
sepa-ration of hydrogen and quasi-elastically produced events.
Furthermore, they did not use any k~own distributions in order
to estimate theie background and to obtain a reliable sample p- -~
_i~_ __ __ _F
of charge exchange events. Hence, their experiment does not necessarily support the Saclay result.
Chretien et a2l , give the following estimate to the ratio of thelproduction cross-section to that of charge exchange:
Tir
Using this value and our charge exchange cross-section of
(4.2±0.4)mb. we expect an oproduction cross-section of
(0 .1 t 0±
.
6),
If we assume our residual events with opening angles greater than 90 to be due to t(decays ( the effective cross-section due the neutral decays of
A
's is4o.1 mb.) then our value of(0.6t0.2)mb. is consistent with the value deduced. C. FORWARD SCATTERING
-30
Using the values obtained by Cronin for the
determina-tion of the forward scattering differential cross-secdetermina-tion for charge exchange, we find the predicted value for to be:
(0* - (!= 0.1) Mb/ fz
We find from our angular distribution the value:
These values are in substantial a6reement.
D. D 5/2 - F 5/2 INT'1ERFERECE
-With the results of our differential cross-section, we are able to determine the partial waves involved at 900 -ev.
If we use the 5th order fit to the angular distribution ,
and take a6 to be 0, thenthe following is true:
6
c'
11
OMMI-term
and if we take the largest in a3 , assuming all other terms
negligible, we get:
0-3 -1 Io Re. A s/
F
a is then found to be equal toaa5 in magnitude, but negative
in sign. This is indeed true of our resulte - we find a large value for a5 (5.61.2)mb/st and an equally large but negative
value for a3 ( -5.0kO.9)mb/st. Thus, indications are that the
F 7/2 amplitude is 0 or very small and that the D 5/2 - F 5/2
interference predominates.
There may be a question as to why the 6th order fit is not used. By including the 6th order term the )2 probability does not change appreciably and this additional 6th order
term enters with a very large error. We therefore assume that
it is not needed or is at most very small.
E. CHARGE INDEPENDENCE t
If charge independence is asBumed to hold true in
pion-nucleon interactions, the following relationship be-tween the various elastic cross-sections
--=
rJr4
e
- T
"-'
F
must be satisfied:
R
-
+ ' __I
I
Using the following values Por the various
cross-sections, T ( I ..o -. O.4) mb
" -(ag.o ±
.o),,,6
r
4. ?
*--)
)-.
llhi
-xp-l4Met
We find RS(0.73A0.12) which satisfies the inequality
re-quired by the charge independence hypothesis.
F. ISOTOPIC-SPIN ASSIGNIwENT
-Using our preliminary results, it was suggested by
33
Dalitz that the isotopic-spin associated with the D 5/2 and F 5/2 wave amplitudes are both in the T=- state. The argument for this iso-spin assignment which depends on our
final results is reproduced b low.
Assuming charge in dependence, it can be shown that:
The experimental values for the various cross-sections are:
+
(S. I.
)x
+
11.
Os
1.o)xt
mb/t
from F. Grard, et alA
"
P
.
(.4L
0"$'()
t
.
7
.o
43.
),e -(5.o
.)X3
-(.
,
.
Sr)X
+
L
S(m.s
p
L
o)d
/,
from this experiment
- ( -+P T-)
(.F)**.-o
+)(.,o* .tI)K+
(.,,:t .,gfrom F.3rard, et a134 Therefore:
*
Q
+
.
.%)
x
+ C-
(.t
x
..
')
.'r
a x.
X 0
,
.
If we assume a pure D 5/2 - F5/2 interference ( all other amplitudes equal to 0) then:
Keeping in mind the assumption made (pure D 5/2 - F 5/2 interference ), this seems to fit the Cata quite well. The experimental(+ p) differential cross-sectiondoes not even -- --- --- _r-~---l- -..;r-;-~i-9--UI~B~ i -~t a
require a 4th order cose.@ term. This indicated that there is no strong D 5/2, T3/2 contribution. Hence, we can con-clude that the interfering D 5/2 - F 5/2 amplitudes are both
in the T@;- isotopic-spin state.
ll~P-TABLE II-1
NUMBER OF VARIOUS GAMMA-RAY EVENTS OBSERVED
TARGET REGION 0-5
144
'3y
151Y
5-10113
27 1 10-1576
19
8
N2a
0-15331
81
27 2 125 L u- -r- __ _fllrr*~ilrscarn*( ~rCCII?~~ - -- ~ ~rTABLE III-1
CONVERSION PROBABILITIES OF GAMMA RAYS
FROM Ir . 27 and 3v0 DECAYS
TARGET REGION
0-5
5-10
10-15.1349
+.0040
.2016+.0050
.0928+,0032
.1190
+.0037
.0520
±.0023
.3896
+.0074
.0836
+.0030
.0922+.0032
.0330
+.o0018
.3639
+.0071
.0883
+,0031
.0637
+.0026
.0189
+.o014
.2959
±.0062
0-15.1741
+.0027.0882
+.0018
.0916
+,0018
.0346
+.0011
.3498
+ .0040
0191 +,0O1'+o0386
+.0020o0433
+.0021.0257
+.0016
.006
+ 000i
.6043
+.0099
37
P 2y(1) P2y(2r) P 3(2r) P P3y(2r) (2r) +9sP 2y(3i)
P3(3r)
P y(37r)
P
(3r)
P (3ii)p
2 (37r) ---- -- . -- UPI~---I i-- --- -V-~ ~ ~i iC lb~-
----.18 7
+.0 8
TABLE 111-2
CORRECTION FACTORS
FOR
LEGENDRE-POLYNOMIAL COEFFIC IENTS
B0 B1 B2
B
3B
6 B.70.9700
0.8433
0.8323
0.8110
0.7802
0.7414
0.6964
0.6470
0.5953
0.9715
0.8522
0.8412
0.8197
0.7A87
0.7498
0.7046
0.6551
0.6034
0.9735
0.8638
0.8528
0.8312
0.8002
0.7612
0.7159
0.6665
0.6148
0.9755
0.8753
0.8642
0.8427
0,8117
0,7728
0.7277
0.6785
0.6271
019775
0.8865
0.8755
0.8541
0.8234
0,7848
0.7401
0.6913
0.6404
0.9795
0.8975
0.8867
0.8656
0.8352
0.7972
0.7531
0.7049
0.6548
fr= 0.9735 for this experiment.
~---~~-- I'Ii- - --- - --
TABLE 111-3 BISECTOR EFFECIENCIES ISO BI 1 BI 2
COS
0-5
5-10
10-1
o
10-1
0-5
5-10
10-15
S U 20 2 19 02 14 01 21 01 19 01 - 4 22 03 25 03 18 03 24 02 28 02 18 09 23 02 29 02 22 02 +80-70 35 04 32 04 25 03 31 04 29 04 21 04 28 03 30 03 20 02 +70-60 32 03 25 03 27 03 25 04 24 04 25 os 35 04 25 03 21 os +860-50 35 04 24 03 25 03 38 S0 24 04 22 08 31 04 25 04 24 04 +50-40 34 04 28 03 25 03 35 05 23 04 24 06 43 05 27 04 28 04 +40-30 33 04 24 03 25 03 28 04 30 04 28 08 35 05 30 04 28 04 +30-20 35 04 28 03 31 03 33 05 27 04 27 07 37 05 30 04 24 04 +20-10 32 04 29 03 22 03 31 05 21 04 31 07 31 05 24 04 34 05 +L0--00 33 04 28 03 25 03 28 05 23 04 27 07 31 05 33 08 31 08 -00-10 33 04 28 03 29 04 39 08 24 05 29 08 31 07 28 06 29 08 10-20 31 04 28 03 25 03 32 08 28 8 :25 07 35 07 28 08 26 08 ,,,L , ,, , , , l;, 33 08 27.. 07,7,0 -20-30 ~30-40 -40-50 -50-60 -80-70 -70-80 -80-90 -90-10 .34 08 21 04 22 05 16 02 25 03 27 03 25 03 14 02 30 04 21 04 18 05 24 04 21 04 15 03 24 03 28 03 13 02 32 04 28 04 15 03 28 03 25 03 14 02 25 03 23 03 09 02 23 03 21 02 11 02 23 03 20 02 09 01 24 03 19 03 04 01 39 08 21 02 04 01 22 02 18 02 07 01 17 02 14 02 03 01 22 02 14 02 04 01 22 02 12 02 02 01 13 02 09 02 09 005 17 02 07 01 004 004 18 02 09 01 004 003 0 08 02 02 01 05 02 02 01 10 03 03 02 23 03ALL EFFECIENCIES WITH
BE MULTIPLIED BY iO-2
ALL EFFECIENCIES WITH BE MULTIPLIED BY 10-3
TWO DIGITS SHOULD
THREE DIGITS SHOULD
ALL COSINE VALUES SHOULD BE MULTIPLIED
BY 10-2
II I -.. I ~" _ Trl~ r 'I
x'-~----; -~~
TABLE
III.+-r ANGULAR DISTRIBUTION
LEGENDRE SERIES COEFFICIENTS
A0 Al1 A2 A3
A
6.
.32+.o04 ..05+.09
.43+.11
.09+.1O
-.08+.12
5 .38.04 .05+.09 .49+.11 ;46+,13 -.154.13 .71+.15
6 .39±.04 .02+_.09 .48+.11 .45+.13 -26+.16 .75±.15 -.19+.18
0 ANGULAR DISTRIBUTION
COSINE SERIES COEFFICIENTS
L a0 a 1 2 a3 4 a 5 a6 5 .08+.03 .69+.47 1.30+_.43 -5.03+.92 -. 66+.55 5.56+_1.20 6 .11+.03 o74+21 .44+.90 -5.40+1.21 2.65±3.16 5.88+1.23 2.79+_2.63 I -II
REFEI ENCES
1. H.C. Burrows, D.O. Caldwell, D.H. Frisch, D.A. Hill,
D.M. Ritson, R.A. Schluter, and M.A. Wahlig, Phys. Rev.
Letters 2, 119 (1959)
2. J.C. Brisson, J Detoeuf, P.Falk-Vairant, G. Valladas,
L. Van Rossum,.and L.C.L. Yuan, Phys. Rev. Letters 3, 561
(1959)
3. J.C. Brisson, J. Detoeuf, P. Falk-Vairant, L. Van Rossum,
and G. Valladas, Nuovo Cimento 19, 210 (1961)
4. T. J. Devlin, B.C. 'arish, W.N. Hess, V. Perez-ilvendez,and:.
J. Solomon, Phys. Rev. Letters 4, 242, (1960).
5. R.R. Crittenden, J.H. Scandrett, W.D. Shephard, W.D. Walker,
Phys. Rev. Letters 2, 121 (1959.
6. J.C. Brisson, P.Falk-Vairant, J.P. verlo, L.Sondereger,
R. Turlay, and G. Valladas, Aix-En-Provence Int. Conf. on
Elementary Particles 1, 45 (1961).
Also R.Turlay, Thesis, University of Paris (1962)(unpublished).
7. R.F. Peierls, Phys. Rev. Letters 1, 174 (1958). 8. P.C. Stein, Phys. Rev. Letters 2, 473 (1959).
9. R.F. P&ierls, Phys. Rev. 118, 325 (1960).
10. B.J. Moyer, Rev. kod. Physics 33, 567(1961)
11. B.C. Maglic, B.T. Feld, and C.A. Diffey, Phys. Rev.123,
1444 (1961).
12. T.F. Kycia, and K.F. Riley, Phys. Rev. Letters 10, 266 (1963).
13. A. Weinberg, A.Brenner, and K. Strauch ,Phys. Rev. Letters
8, 70 (1962).
14. ib. Chretien, D.R. Firth, R.K.Yamamotd, I.A. Pless, and L. Rosenson, Proc. of 1962 Instr. Conf. at CERN, Geneva
(To be published)
-42 -i3
References con't.
15. To be published in The Review of Sciertific Instruments. 16. Lawrence Rosenson, 1960 Int. Conf. on Instrumentation
for High-Energy Physics, Berkeley, 135 (1960)
17. J. Szymanski, Thesis, Harvard U. (1963) (unpublished).
18. J. Averell, Thesis, Harvard U. (1963) (unpublished).
19. H.A. Bethe, and W. Heitler, Proc. Roy. Soc. A 146, 83(1934).
20. R4E. Lanou, Jr. 3rown Univ., High £nergy Group, Internal Report #103 (1962) (unpublished).
21. LGP-30 program for particle trajectories, written by J.
Sanford, and J. Sandweiss, Yale U.
23. F. Bulos, R.E. Lanou, Jr., I.A. Pless, and L.Rosenson, Bull. A.P.S. 6, 528, ( 1961).
24. These projectors were built by the Brown University group, but originally designed at Yale U.
25. IBM 704 program written by M. Chretien, Brandeis U., modified for IIBi, 7090 use by A. Brenner, Harvard U. 26. IBM 7090 program written by C. Bordner, Harvard ,U.
-27. IBM 7090 program written by A. BErenner, and E. Ronat,
Harvard University.
26. iM. Derrick, J.G. Fetrovich, T.H. Fields, J. Deahl, Proc. 1960 Ann. Intern. Conf. on High Energy Physics at Rochester, p. 32.
29. T. Chretien, F. 1Bulos, H.R. Crouch, Jr. , R., . Lanou,Jr., J.T. Miassimo, A.M. Shapiro, J.A. Averell, C.A. Bordner, Jr., A.E. Brenner, D.R. Firth, Ii.E. Law, B.Nelson, I.A. Pless, L. Rosenson, G.A. Salandin, R. K. Yamamoto, L. Guerriero,
and F. ialdner, Phys. Rev. Letters 9, 127 (1962). 30. J.W. Cronin, Phys. Rev. 118, 824 (1960)
31. H. Foelsche, E.C. Fowler, H.L. Kraybill, J.R. Sanford, and D. Stonehill, Poc. of 1962 Int. Conf. High Energy Physics. at CERN, 36 (1962).
32. P. Falk-Vairant, and G. Valladas, Proc. Ann. Rochester Conf. High Energy Phys. 10 (1960).
33. R.H. Dalitz, private communication.
34. F. Grard, G.R. Iviacleod, L. kontanet, M.Cresti, R. Barlouaud,
C. Choquet, J.M. Gaillard, J.Heughbaert, A. Leveque, P.
Lehmann, J. Meyer, D. Revel, Aix-En- Provence Int. Conf,
on Elementary Particles 1, 37 (1961).
-43-- --~ ~.---.. . ~---C-~---^~--*~.I*~-oil -. ---. *-Mls*RMIZMRRMff I loll
Expansion Head
Target Reservoir
4
7T
-
Beam
Beam Finger
15" Chamber
BUBBLE CHAMBER WITH
INTERNAL
HYDROGEN TARGET
(BEAM FINGER)
X(E)
CM.
Target
---204
205
2(
Horiz. Bend (16*0)
Horiz. Bend
(16)
-Horiz. Bend (160)
209
Quad.
(h.f.
Quad. (v.f.)
Horiz. Bend (290)
Quad.
(v.
f.)
,----Qud.
(h.
f.
)
207
208
2---
Slit
209
~'Vert.
Bend
210
Vert. Bend
Bubble Chamber
Figure I -
3
3