HAL Id: hal-02633861
https://hal.inrae.fr/hal-02633861
Submitted on 27 May 2020
HAL is a multi-disciplinary open access
archive for the deposit and dissemination of
sci-entific research documents, whether they are
pub-lished or not. The documents may come from
teaching and research institutions in France or
abroad, or from public or private research centers.
L’archive ouverte pluridisciplinaire HAL, est
destinée au dépôt et à la diffusion de documents
scientifiques de niveau recherche, publiés ou non,
émanant des établissements d’enseignement et de
recherche français ou étrangers, des laboratoires
publics ou privés.
Erratum to: CDOM fluorescence as a proxy of DOC
concentration in natural waters: a comparison of four
contrasting tropical systems
Emma Rochelle Newall, F. D. Hulot, Jean-Louis Janeau, A. Merroune
To cite this version:
Emma Rochelle Newall, F. D. Hulot, Jean-Louis Janeau, A. Merroune. Erratum to: CDOM
fluores-cence as a proxy of DOC concentration in natural waters: a comparison of four contrasting tropical
systems. Environmental Monitoring and Assessment, Springer Verlag (Germany), 2014, 186 (5),
pp.3303 - 3304. �10.1007/s10661-014-3665-1�. �hal-02633861�
ERRATUM
Erratum to: CDOM fluorescence as a proxy of DOC
concentration in natural waters: a comparison of four
contrasting tropical systems
E. Rochelle-Newall
&F. D. Hulot
&J. L. Janeau
&A. Merroune
Published online: 13 February 2014
# Springer International Publishing Switzerland 2014
Erratum to: Environ Monit Assess
DOI 10.1007/s10661-013-3401-2
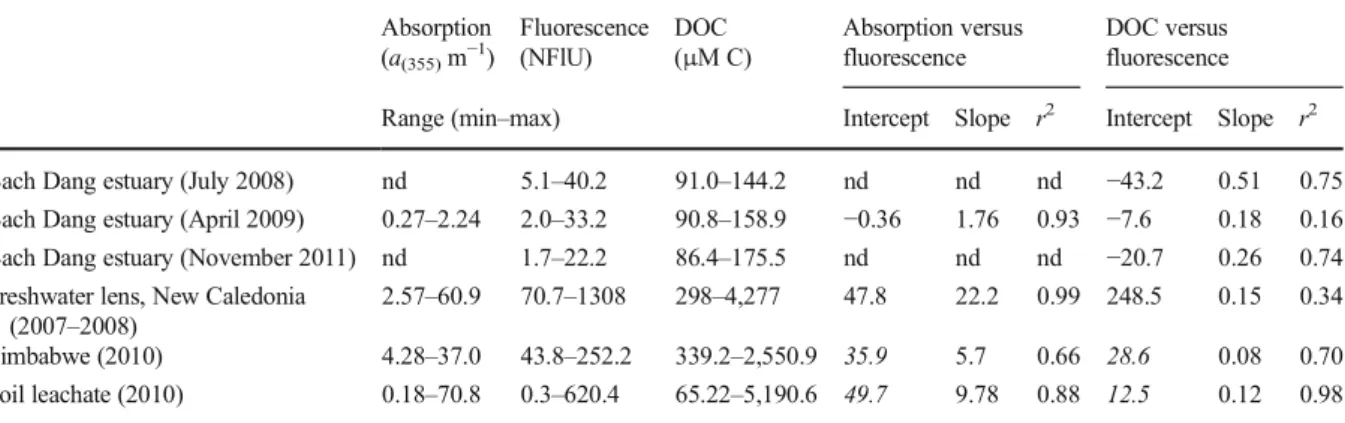
The original version of this article unfortunately
contained a mistake. There were transcription errors in
the row for
“Soil leachate (2010)”. The range under the
column
“Absorption (a
(355)m
−1)
” should read 0.18–
70.8, and the slope under the column
“Absorption
ver-sus fluorescence” should read 9.78.
The errors do not change the conclusion of the article.
Below is the corrected table.
Environ Monit Assess (2014) 186:3303–3304 DOI 10.1007/s10661-014-3665-1
The online version of the original article can be found at http://dx.doi.org/ 10.1007/s10661-013-3401-2.
E. Rochelle-Newall
:
J. L. Janeau:
A. MerrouneIRD-Bioemco, UMR 7618, c/o Soils and Fertilisers Research Institute (SFRI), Dong NgacTu Liem District
Hanoi, Vietnam E. Rochelle-Newall (*) IRD-Bioemco, UMR 7618,
UPMC-CNRS-INRA-ENS-IRD-AgroParisTech-Université Paris-Est Ecole Normale Supérieure, 46 rue d’Ulm, 75005 Paris, France
e-mail: emma.rochelle-newall@ird.fr F. D. Hulot
Ecologie, Systématique et Evolution, UMR 8079, Univ. Paris-Sud, Orsay, France
Table 2 Regressions of absorption versus fluorescence and DOC versus fluorescence for each sample site Absorption (a(355)m−1) Fluorescence (NFlU) DOC (μM C) Absorption versus fluorescence DOC versus fluorescence
Range (min–max) Intercept Slope r2 Intercept Slope r2
Bach Dang estuary (July 2008) nd 5.1–40.2 91.0–144.2 nd nd nd −43.2 0.51 0.75
Bach Dang estuary (April 2009) 0.27–2.24 2.0–33.2 90.8–158.9 −0.36 1.76 0.93 −7.6 0.18 0.16
Bach Dang estuary (November 2011) nd 1.7–22.2 86.4–175.5 nd nd nd −20.7 0.26 0.74
Freshwater lens, New Caledonia (2007–2008)
2.57–60.9 70.7–1308 298–4,277 47.8 22.2 0.99 248.5 0.15 0.34
Zimbabwe (2010) 4.28–37.0 43.8–252.2 339.2–2,550.9 35.9 5.7 0.66 28.6 0.08 0.70
Soil leachate (2010) 0.18–70.8 0.3–620.4 65.22–5,190.6 49.7 9.78 0.88 12.5 0.12 0.98
Values in italics are those not significant at the p=0.05 level nd not determined