Publisher’s version / Version de l'éditeur:
Vous avez des questions? Nous pouvons vous aider. Pour communiquer directement avec un auteur, consultez la première page de la revue dans laquelle son article a été publié afin de trouver ses coordonnées. Si vous n’arrivez pas à les repérer, communiquez avec nous à [email protected]. Questions? Contact the NRC Publications Archive team at
[email protected]. If you wish to email the authors directly, please see the first page of the publication for their contact information.
https://publications-cnrc.canada.ca/fra/droits
L’accès à ce site Web et l’utilisation de son contenu sont assujettis aux conditions présentées dans le site LISEZ CES CONDITIONS ATTENTIVEMENT AVANT D’UTILISER CE SITE WEB.
13th Annual Conference on Computational and Fluid Dynamics [Proceedings],
2005
READ THESE TERMS AND CONDITIONS CAREFULLY BEFORE USING THIS WEBSITE. https://nrc-publications.canada.ca/eng/copyright
NRC Publications Archive Record / Notice des Archives des publications du CNRC : https://nrc-publications.canada.ca/eng/view/object/?id=4394c98c-5abd-420c-8907-1afd7ba0bc00 https://publications-cnrc.canada.ca/fra/voir/objet/?id=4394c98c-5abd-420c-8907-1afd7ba0bc00
NRC Publications Archive
Archives des publications du CNRC
This publication could be one of several versions: author’s original, accepted manuscript or the publisher’s version. / La version de cette publication peut être l’une des suivantes : la version prépublication de l’auteur, la version acceptée du manuscrit ou la version de l’éditeur.
Access and use of this website and the material on it are subject to the Terms and Conditions set forth at
Numerical study of hub taper angle on podded propeller performance
Islam, M.; Veitch, B.; Bose, N.; Liu, P.
Numerical Study of Hub Taper Angle on Podded Propeller
Performance
Mohammed F. Islam1, Brian Veitch1, Neil Bose1 and Pengfei Liu2
1
Faculty of Engineering and Applied Science, Memorial University of Newfoundland, St. John’s, NL Canada.
2
Institute for Ocean Technology (IOT), National Research Council Canada. Email: [email protected]
A
BSTRACTPresently, the majority of podded propulsion systems are of the pulling type, because this type provides better hydrodynamic efficiency than the pushing type. There are several possible explanations for the better overall performance of a puller type podded propulsor. One is related to the difference in hub shape. Puller and pusher propellers have opposite hub taper angles, hence different hub and blade root shape. These differences cause changes in the flow condition and possibly influence the overall performance. The current study focuses on the variation in performance of pusher and puller propellers with the same blade sections, but different hub taper angles. A hyperboloidal low order source-doublet steady/unsteady time domain panel method code was modified and used to evaluate effects of hub taper angle on the open water propulsive performance of some fixed pitch screw propellers used in podded propulsion systems. The modified code was first validated against measurements of two model propellers in terms of average propulsive performance and good agreement was found. Major findings include significant effects of hub taper angle on propulsive performance of tapered hub propellers and noticeable effects of hub taper angle on sectional pressure distributions of tapered hub propeller blades.
1. I
NTRODUCTIONFor a podded propulsor, a fixed pitch screw propeller is fitted at the fore or aft or both ends of an azimuthing pod (generally a body of revolution big enough to enclose an electric drive) located at the ship's stern. An electrical motor located inside the pod drives the propeller through a short shaft. The pod is attached to the ship hull by a streamlined strut and a slewing bearing arrangement, both of which
structure can rotate 360°. The thrust produced by the propeller can be directed in any horizontal direction, thus eliminating the need for a rudder. The prime movers/generators are usually located topside of the strut or elsewhere in the ship, requiring only electric cable to connect to the pod.
Although research has been done on podded propellers for over three decades [1], this propulsion system type was introduced to the marine industry only a little over a decade ago. Since then, it has obtained wide acceptance as a main propulsion system for a variety of large commercial vessels, notably for large cruise ships and ferries where manoeuvrability at low speed is very important. Two types of podded propulsion systems are used: puller and pusher. The general arrangement of these two systems is shown in Fig. 1. Presently, the majority of commercial vessel installations are of the puller type. Although a number of model and full-scale tests complemented by some numerical work have been done, there are still knowledge gaps, especially in the understanding of podded propulsion system hydrodynamics.
One of the main features that distinguishes a puller propeller from a pusher propeller is the hub geometry. To streamline the pod profile, the hub of the propeller must be tapered. That is, a more conically shaped hub is usually used for a podded propeller, rather than the straighter or cylindrical hub used in conventional fixed pitch propellers. The pusher and the puller podded propellers have opposite hub taper angle. Fig. 1 shows the difference of the two types of podded propulsion systems and the definition of hub taper angle.
Fig. 1 Podded Propulsion Systems; puller and pusher podded propulsion system; definition of hub taper
angle.
The flow field around the propeller changes because of the introduction of the tapered hub. This results in changing the propulsive performance of the propeller as compared to performance of a straight hub propeller. As far as is known by the authors, there has not been any numerical or experimental work reported to date which studies the effects of root hub taper angle on propeller performance. Some research work has been done on propeller boss cap fins [2] and [3], which are fitted to tapered hub cones behind the propeller boss. These papers addressed the effects of boss cap fins on propeller performance but did not address the effect of hub taper angle. The numerical prediction of effects of hub taper angle on the propulsive performance of propellers designed for podded propulsion systems is the main focus of this research work. In the calculations as well as tests, bare propellers (geometrically similar propellers with different hub shapes) were used without any pod-strut placed fore or aft of the propellers so that only the effects of hub taper angle could be studied.
The modified panel method code, PROPELLA, was first extended and then used to calculate the propulsive performance of three propellers having the same blade section but different hub geometry. The predictions were then validated against experimental measurements of two propellers of pusher and puller types. The predicted pressure distributions of blade sections at different radial positions for the two types of propeller are also presented to study the effect of hub taper angle on pressure distributions.
2. M
ETHODThe low order source-doublet, steady/unsteady time domain panel method, PROPELLA, was modified and used to predict hydrodynamic performance of screw propellers with various configurations. The structure, functionalities, implementation and demonstration of the code are discussed in detail in [4]. A brief description of the numerical model of the multiple-body and multiple-path panel method used in the code is given in [5]. The geometry part of the code was extended to include hub taper angle [6]. The blade planform, especially around the root section, as well as the hub geometry, changes because of this inclusion. Several functions were written to take care of all these changes. All of these functions are used after all coordinates of corner points of the blade panels are obtained in the original code.
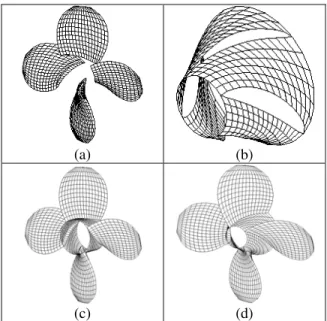
Fig. 2 shows the blades of the model propeller after modification due to the inclusion of hub taper angle in the code. This and other discretized pictures are viewed in GPPPP [7]. Fig. 2(a) shows only the blades after the inclusion of taper angle. Fig. 2(b) shows only the discretized hub of the model propeller after the inclusion of taper angle. Fig. 2(c) is the propeller geometry with no taper angle (straight hub) and Fig. 2(d) is the geometry with a positive taper angle.
(a) (b)
(c) (d)
Fig. 2 Discretized view of right-handed model propellers: (a) blades of the propeller after inclusion of taper angle; (b) hub of the propeller after inclusion
of taper angle; (c) model propeller with straight hub and (d) model propeller with tapered hub.
3. R
ESULTS ANDD
ISCUSSIONSIn the current study, three model propellers were studied, one of which was for a puller podded system, one for a pusher podded system and the remaining one was a conventional straight hub propeller. The propellers have the same blade sections with different hub taper angles. All the geometric details of the model propellers are provided in [8]. The two propellers have a hub taper angle of 15° (right handed pusher configuration, Push+15) and -15° (left handed puller configuration, Pull-15). Fig. 3 shows a rendered view of the model propellers.
(a) Push+15° (b) Pull-15°
Fig. 3 Two model propellers: figure (a) and (b) are the propellers with hub taper angles of +15° (push)
and -15° (pull), respectively.
3.1 Validation of the modified code
The code, PROPELLA has been validated for more than a dozen propellers in terms of hydrodynamic properties since its development about a decade ago. In the current study, the extended code was used to produce numerical results first. The numerical results were then compared with the measurements without tweaking the code. The measurements consist of open water tests of three propellers with the same design blade sections (except hub taper angle). The model propellers have hub taper angles of 15° in push configuration and –15° for puller configuration. For the purpose of calculations, the simulation parameters that were used and information about the total number of simulations done and time required are summarized [8].
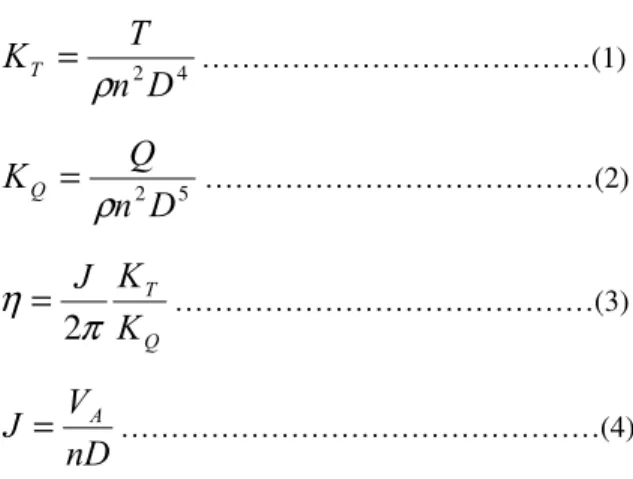
The experimental results for the two propellers were collected and analyzed in terms of propeller thrust coefficient, KT, propeller torque coefficient, 10KQ,
propulsive efficiency, η and propeller advance coefficient, J [9]. KT, KQ, η and J are defined in
equation 1-4, respectively. 4 2
D
n
T
K
Tρ
=
………(1) 5 2D
n
Q
K
Qρ
=
………(2) Q TK
K
J
π
η
2
=
………(3)nD
V
J
A=
………(4)where, T is the thrust produced by the propeller in N,
Q is the torque consumed by the propeller in N-m, ρ
is the water density in Kg/m3, n is the propeller rotational speed (rps), D is the propeller diameter in m and VA is propeller speed of advance in m/s.
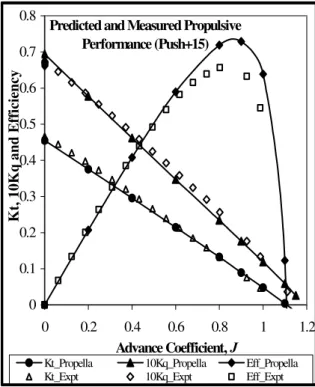
Figs. 4 and 5 show comparisons of propeller open water performance between measurements and predictions for model propellers Push+15 and Pull-15, respectively. It can be seen that predictions of open water propulsive performance are close to measurements for a wide range of advance coefficient. This is true for the pusher and puller propellers. For KT and KQ, it is observed that the
corresponding predicted values approach the measurements closely for a wide range of advance coefficient from the bollard pull condition (J=0.0) to an advance coefficient J/(P/D) = 1.0 (covers most of the operating range of any practical propeller). In the case of the pusher propellers (Fig. 4), for an advance coefficient of close to zero (J/(P/D) = 0.0-0.2), the calculated values are very close to the measurements. For an advance coefficient of more than 1.0, the calculated values are slightly higher than the measurements. For a moderate advance coefficient range (J=0.20-0.80), the calculated values are slightly lower than the measurements. The predictions for the puller propeller, Pull-15, are closer to the corresponding measurements (see Fig. 5). In this case the predicted values are lower than the measurements for high J/(P/D) values.
The comparison of performance between the measurements and the predictions are provided in table 1. Here the positive numbers represent the fact that the predicted values are higher than the measurements and visa versa. All numbers are percentages based on measurements.
Predicted and Measured Propulsive Performance (Push+15) 0 0.1 0.2 0.3 0.4 0.5 0.6 0.7 0.8 0 0.2 0.4 0.6 0.8 1 1.2 Advance Coefficient, J Kt, 10Kq and Efficiency
Kt_Propella 10Kq_Propella Eff_Propella Kt_Expt 10Kq_Expt Eff_Expt Fig. 4 Comparison of the measured (Expt) and predicted (PROPELLA) propulsive characteristics of
the model propeller, Push+15, with hub taper angle of 15° (push configuration).
Predicted and Measured Propulsive Performance (Pull-15) 0 0.1 0.2 0.3 0.4 0.5 0.6 0.7 0.8 0 0.2 0.4 0.6 0.8 1 1.2 Advance Coefficient, J Kt, 10Kq and Efficiency
Kt_Propella 10Kq_Propella Eff_Propella Kt_Expt 10Kq_Expt Eff_Expt Fig. 5 Comparison of the measured (Expt) and predicted (PROPELLA) propulsive characteristics of the model propeller, Pull-15, with hub taper angle of
-15° (pull configuration).
The predicted thrust and torque are slightly lower than that of the corresponding measured values for moderate advance coefficients (J/(P/D) = 0.2-0.6) and higher for low advance coefficients (J/(P/D) = 0.0-0.2) (see Fig. 4). The code is a potential flow code but a simplified empirical formulation was used to take into account the viscous effects in terms of skin friction. A more realistic formulation to take into account the viscous effects might improve the predictions further. Push+15 Pull-15 J % Kt % Kq % Kt % Kq 0 -1.51 3.75 2.25 1.92 0.2 -4.24 -0.41 -2.67 -1.09 0.4 -3.83 -2.76 -6.35 -4.44 0.6 -2.41 -5.88 -8.98 -6.62 0.8 -0.26 -8.70 -15.33 -9.59 0.9 3.63 -7.49 -23.15 -8.30 Table 1 Comparison of propulsive performance of
the two model propellers between predictions and measurements. Here the positive numbers represent the fact that the predicted values are higher than the
measurements and visa versa. All numbers are percentages based on measurements.
3.2 Effects Of Hub Taper Angle On
Performance
The effects of hub taper angle on propulsive performance of the model propeller are evident when performance of the propellers with different taper angles is compared in terms of KT, KQ and η, for a
wide range of J. Fig. 6 shows the predicted values of open water propulsive performance for hub taper angles of 15° push and –15° pull configurations. Propulsive performance for a straight hub propeller is included in the figure to emphasize how the hub taper angles influence propulsive performance.
From Fig. 6, it is apparent that the hub taper angle has more influence on KT and KQ at highly loaded
conditions (low J/(P/D) values, J/(P/D)<= 0.4) and lightly loaded conditions (high J/(P/D) value, J/(P/D)> 0.8) than for moderately loaded conditions (J/(P/D)= 0.4~0.8). For the same 15° hub taper angle, the push propeller produced less thrust than the pull propeller (for J/(P/D)=0.0-0.6). A quantitative study of the effects of hub taper angle on propulsive performance (KT, KQ and η) for a practical range of J/(P/D)=0.0 to J/(P/D)=1.0 is summarized in table 2.
Propulsive Performance Push+15 vs. Pull-15 0 0.1 0.2 0.3 0.4 0.5 0.6 0.7 0 0.2 0.4 0.6 0.8 1 1.2 Advance Coefficient, J Kt, 10Kq and Efficiency
Push+15_Kt Push+15_10Kq Push+15_Eff Pull-15_Kt Pull-15_10Kq Pull-15_Eff Regular_Kt Regular_10Kq Regular_Eff
Fig. 6 Numerical results showing the effects of hub taper angle on the propulsive performance of propellers with hub taper angles of 0°, 15° and –15°. According to the table 2, at J=0.0 (bollard pull condition) an increase of 10% of KT and an increase
of 2% of KQ were predicted for the Pull-15 propeller
as compared to that of the Push+15 propeller. The corresponding measured values were 7% and 4%, respectively. The percentage change of KT and KQ
decreased as J/(P/D) increased and at high J/(P/D) the values became negative. In other words, at high J/(P/D), the performance of a puller propeller gets worse than the pusher ones. Quantitatively, at
J/(P/D)=0.9, a decrease of 27% of KT and a decrease
of 2% of KQ were predicted for the Pull-15 propeller
as compared to that of the Push+15 propeller. The corresponding measured values (decrease) were 2% and 1%, respectively. Predictions Measurements J % Kt % Kq % η % Kt % Kq % η 0.00 10.39 1.73 0.00 6.58 3.56 0.00 0.20 8.57 3.47 4.96 6.82 4.18 2.53 0.40 4.63 3.46 1.47 7.45 5.28 2.06 0.60 0.24 3.74 -3.39 6.81 4.57 2.14 0.80 -11.27 0.42 -12.76 3.02 1.42 1.58 P u ll-15 vs. Push+1 5 0.90 -27.04 -1.70 -27.93 -1.62 -0.83 -4.47 Table 2 Quantitative studies of effects of hub taper angle on propulsive performance at different Js. Here the positive numbers represent the fact that the
predicted values of the puller propeller are higher than the basis propeller (pusher propeller) and visa
versa. All numbers are percentages based on the performance of the pusher propellers.
That an increase in propulsive performance for a propeller with negative hub taper angle, and a reduction in propulsive performance for a propeller with positive taper angle occur may be attributed to two reasons. First is the change in leading and trailing edge area in the tapered hub propellers and second is the change in root section camber due to the conical hub surface. The pressure distributions of blade sections show that the majority of total thrust produced by the propeller blades is produced in the leading edge area. For propellers with positive taper hub angle some blade portion around the leading edge near the blade roots is chopped off and some blade portion around the trailing edge is added, resulting in lower total thrust produced by the propeller as compared to that of a straight hub propeller. The reverse case is true for propellers with negative hub taper angle. A further discussion on this is provided when the effect of hub taper angle on sectional pressure distributions is discussed in the next section.
3.3 Effects of Taper Angle on Sectional
Pressure Distribution
Pressure distributions in terms of pressure coefficient, CP, at the blade root section were predicted for a wide
range of advance coefficient in open water conditions for the Push+15 and Pull-15 propellers. The predictions of pressure distributions were analyzed in order to identify the variations of propulsive performance of the propellers, which vary only in hub geometry. It was observed that because of the variation of hub taper angle the pressure distribution around blade sections varied, which influences the average propulsive performance.
The predictions for the pressure distribution in terms of pressure coefficient, CP, around the blade root
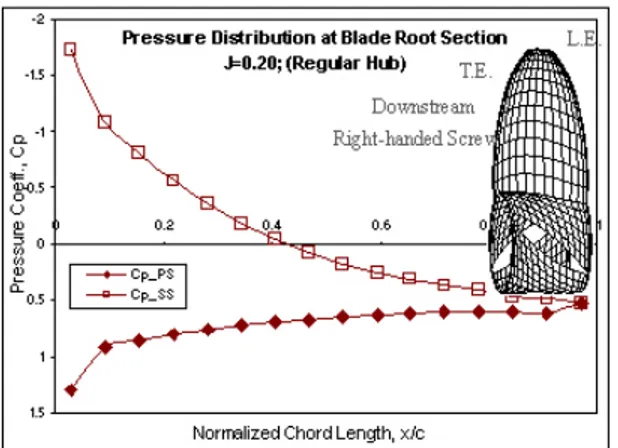
section (pressure side, PS as well as suction side, SS) for an advance coefficient of J/(P/D) = 0.20 are shown in Figs. 7~9 for the propellers with hub taper angles of 0°, 15°, and –15°, respectively. The blade root sections for each of these propellers are also shown in the figures to facilitate the understanding of sectional pressure distributions.
Fig. 7 Numerical results showing the pressure distribution at the blade root section of the propeller
with straight hub at J/(P/D)=0.20.
Fig. 8 Numerical results showing the pressure distribution at the blade root section of the propeller
Push+15 at J/(P/D)=0.20.
Fig. 9 Numerical results showing the pressure distribution at the blade root section of the propeller
Pull-15 at J/(P/D)=0.20.
Fig. 7 shows the pressure distribution at the blade root section for a straight hub propeller. In this case it is seen that the majority of the blade thrust is produced by the leading edge from negative pressure on the suction side and positive pressure on the pressure side. The pressure distribution appears
normal and favorable for producing positive thrust. A pressure peak is seen around the leading edge. The pressure distribution for the propeller with a taper angle of 15° for the push configuration (Fig. 8) shows some undesired crossover of the CP curves around
mid-chord and an unloaded trailing edge. The loop downstream of the crossover produces a negative pressure difference, which leads to a reduction of total thrust produced by the blades. This might be one of the reasons for which lower thrust is produced for propellers with positive hub taper angle (pusher configuration) as compared to a straight hub propeller at lower advance coefficients (J/(P/D)<0.60). Also at positive taper angle, the minimum pressure coefficient is less than for the conventional straight hub propeller. The abnormal root sectional shape as a result of the intersection between two 3D surfaces - the blade section and the hub cone - causes the poor pressure distribution. The pressure distribution for the Pull-15 propeller, shown in Fig. 9, shows a more desirable pressure distribution, hence more typical load distribution, as compared to that of the previous two propellers. The area covered by the CP curves
(thrust produced by that section) is larger than that of the straight-hub propeller, thus giving higher thrust. It can be seen in Fig. 9, as a result of the intersection of the two 3D surfaces that the camber of the root section was reduced substantially, which gave a more desirable pressure distribution in terms of CP
difference, and hence increased thrust production.
4. C
ONCLUDING REMARKSPresently, the pulling podded propeller configuration is more widely used than the pushing one. The main advantage of a pulling type propeller is the uniformity of the inflow wake in front of the propeller disk. Both pulling and pushing propeller shed strong wake vortices, but in the puller case they cause a problem by interacting with the strut causing cavitation, vibration and noise. In contrast, the advantage of the pushing type propeller is the absence of vortex wake impingement related problems, but the inflow wake is affected by the strut upstream to cause a rather non-uniform inflow wake in front of the propeller disk. The current study did not take the effect of the presence of pod-strut or strut wake or impingement effect into account.
An in-house steady/unsteady low order time domain panel method code, PROPELLA was extended to predict the performance of tapered hub propellers. The modified code was validated against measurements. The measurements consisted of open water tests of two propellers having same blade sections but different hubs (hub taper angles). The
two propellers have hub taper angles of 15° and –15°. The KT and KQ values of the predictions and
measurements for the propellers in both configurations were very close for a wide range of advance coefficient (J/(P/D) = 0.0 to J/(P/D) = 1.0). For the propellers with a negative hub taper angle, good agreement between predictions and measurements were observed throughout all values of advance coefficient.
The effects of hub taper angle on propulsive performance of the model propeller were evaluated in terms of propeller open water characteristics for a wide range of advance coefficient. It is seen that hub taper angle has more influence on KT and KQ at
highly loaded conditions (low J/(P/D) value) than for lightly loaded conditions (high J/(P/D) value). For the same 15° hub taper angle, the pusher propellers produced less thrust for heavily loaded conditions (J/(P/D)<0.60), than the puller ones. The pusher propeller produced higher thrust and torque than the puller ones for lightly loaded conditions (J/(P/D)>0.90). These facts were observed both in predictions and measurements. Quantitatively, at J/(P/D)=0.0 (bollard pull condition) an increase of 10% of KT and an increase of 2% of KQ were
predicted for the Pull-15 propeller as compared to that of the Push+15 propeller. The corresponding measured values were 7% and 4%, respectively. The percentage change of KT and KQ decreased as J/(P/D)
increased and at high J/(P/D) the values became negative. In other words, at high J/(P/D), the performance of a puller propeller gets worse than the pusher ones. Quantitatively, at J=0.9, a decrease of 27% of KT and a decrease of 2% of KQ were predicted
for the Pull-15 propeller as compared to that of the Push+15 propeller. The corresponding measured values (decrease) were 2% and 1%, respectively. Predicted pressure distributions on the blade root sections for puller propellers were found to be more desirable than those of pusher propellers. Puller propellers should therefore produce more thrust than a pusher propeller under the same operating condition.
A
CKNOWLEDGEMENTSThe authors would like to express their gratitude to the Natural Sciences and Engineering Research Council (NSERC), Oceanic Consulting Corp., Thordon Bearings Inc., the National Research Council (NRC) and Memorial University of Newfoundland for their financial and other support. Special thanks are given to Justin Quinton for his efforts in extending the code to include hub taper
Ocean Engineering Research Centre and the Institute for Ocean Technology for their assistance.
R
EFERENCES[1] Rains, D. A. and Vanlandingham, D. J., Hydrodynamics of podded ship propulsion, Journal of Hydronautics, vol. 14, no. 1-4, pp. 18-24., 1981.
[2] Ouchi, K., Research and development of PBCF to enhance propeller efficiency, Tenth Motor Ship International Marine Propulsion Conference (March 1988), 12 p., 1988.
[3] Black, S. D., Chesnakas, C. J. And Jessup, S. D., Investigation on efficiency improving boss-cap fins for T-AO 193, Tech. Rep. NSWCCD-50-TR-2001/067, Carderock Division, Naval Surface Warfare Center, Naval Surface Warfare Center, Carderock Division, 9500 Macarthur Boulevard, West Bethesda, MD 20817-5700, 105 p., 2001.
[4] Liu, P., PROPELLA User Manual, 2003
[5] Liu, P., A time-domain panel method for oscillating propulsors with both chordwise and spanwise flexibility, PhD thesis, Memorial University of Newfoundland, Canada, 226 p., 1996.
[6] Liu, P., Bose, N. and Colbourne, B., Automated marine propeller geometry generation of arbitrary configuration and a wake model for far field momentum prediction, International Shipbuilding Progress, 48(2001): 351-381., 2001.
[7] Liu, P., Design and implementation for 3D unsteady CFD data visualization using object-oriented MFC with OpenGL, Computational Fluid Dynamics Journal, 11 : 335-345., 2002. [8] Islam, M. F., Numerical investigation on effects
of hub taper angle and Pod-strut geometry on propulsive performance of pusher Propeller configurations, Master’s of Engineering thesis (2004), Memorial University of Newfoundland, Canada, 136 p., 2004.
[9] Islam, M. F., Taylor, R., Quinton J., Veitch, B., Bose, N., Colbourne, B. and Liu, P., Numerical investigation of propulsive characteristics of podded propeller, In Proc. of the 1st International Conference on Technological Advances in Podded Propulsion , pp. 513-525., 2004.