arXiv:0711.3917v1 [nucl-ex] 25 Nov 2007
Measurements at √s
N N= 200
GeV
A. Adare,10 S.S. Adler,5 S. Afanasiev,24 C. Aidala,11 N.N. Ajitanand,50 Y. Akiba,25, 44, 45 H. Al-Bataineh,39
J. Alexander,50 A. Al-Jamel,39K. Aoki,29, 44 L. Aphecetche,52 R. Armendariz,39 S.H. Aronson,5 J. Asai,45
E.T. Atomssa,30 R. Averbeck,51 T.C. Awes,40 B. Azmoun,5 V. Babintsev,20 G. Baksay,16 L. Baksay,16
A. Baldisseri,13 K.N. Barish,6 P.D. Barnes,32 B. Bassalleck,38S. Bathe,6, 35 S. Batsouli,11, 40 V. Baublis,43
F. Bauer,6 A. Bazilevsky,5, 45 S. Belikov,5, ∗ R. Bennett,51 Y. Berdnikov,47A.A. Bickley,10 M.T. Bjorndal,11
J.G. Boissevain,32 H. Borel,13 K. Boyle,51 M.L. Brooks,32D.S. Brown,39 N. Bruner,38 D. Bucher,35
H. Buesching,5, 35 V. Bumazhnov,20 G. Bunce,5, 45 J.M. Burward-Hoy,32, 31 S. Butsyk,32, 51 X. Camard,52
S. Campbell,51 P. Chand,4 B.S. Chang,59 W.C. Chang,2 J.-L. Charvet,13S. Chernichenko,20 J. Chiba,25
C.Y. Chi,11M. Chiu,11, 21 I.J. Choi,59 R.K. Choudhury,4 T. Chujo,5, 56 P. Chung,50A. Churyn,20V. Cianciolo,40
C.R. Cleven,18 Y. Cobigo,13 B.A. Cole,11 M.P. Comets,41P. Constantin,23, 32 M. Csan´ad,15 T. Cs¨org˝o,26
J.P. Cussonneau,52 T. Dahms,51 K. Das,17 G. David,5F. De´ak,15 M.B. Deaton,1 K. Dehmelt,16 H. Delagrange,52
A. Denisov,20 D. d’Enterria,11 A. Deshpande,45, 51 E.J. Desmond,5 A. Devismes,51 O. Dietzsch,48 A. Dion,51
M. Donadelli,48 J.L. Drachenberg,1 O. Drapier,30 A. Drees,51 A.K. Dubey,58 A. Durum,20 D. Dutta,4
V. Dzhordzhadze,6, 53 Y.V. Efremenko,40 J. Egdemir,51 F. Ellinghaus,10 W.S. Emam,6 A. Enokizono,31
H. En’yo,44, 45 B. Espagnon,41 S. Esumi,55 K.O. Eyser,6 D.E. Fields,38, 45 C. Finck,52 M. Finger, Jr.,7, 24
M. Finger,7, 24 F. Fleuret,30 S.L. Fokin,28 B.D. Fox,45 Z. Fraenkel,58J.E. Frantz,11, 51 A. Franz,5 A.D. Frawley,17
K. Fujiwara,44 Y. Fukao,29, 44, 45 S.-Y. Fung,6 T. Fusayasu,37 S. Gadrat,33 I. Garishvili,53 M. Germain,52 A. Glenn,10, 53 H. Gong,51 M. Gonin,30 J. Gosset,13 Y. Goto,44, 45 R. Granier de Cassagnac,30N. Grau,23
S.V. Greene,56 M. Grosse Perdekamp,21, 45 T. Gunji,9 H.-˚A. Gustafsson,34 T. Hachiya,19A. Hadj Henni,52
C. Haegemann,38 J.S. Haggerty,5H. Hamagaki,9 R. Han,42 A.G. Hansen,32 H. Harada,19E.P. Hartouni,31
K. Haruna,19M. Harvey,5 E. Haslum,34 K. Hasuko,44 R. Hayano,9 M. Heffner,31T.K. Hemmick,51 T. Hester,6
J.M. Heuser,44X. He,18 P. Hidas,26 H. Hiejima,21 J.C. Hill,23 R. Hobbs,38 M. Hohlmann,16 W. Holzmann,50
K. Homma,19B. Hong,27 A. Hoover,39T. Horaguchi,44, 45, 54 D. Hornback,53T. Ichihara,44, 45 V.V. Ikonnikov,28 K. Imai,29, 44 M. Inaba,55 Y. Inoue,46, 44 M. Inuzuka,9 D. Isenhower,1 L. Isenhower,1 M. Ishihara,44 T. Isobe,9
M. Issah,50A. Isupov,24 B.V. Jacak,51, †J. Jia,11, 51 J. Jin,11 O. Jinnouchi,44, 45 B.M. Johnson,5 S.C. Johnson,31
K.S. Joo,36D. Jouan,41 F. Kajihara,9S. Kametani,9, 57 N. Kamihara,44, 54J. Kamin,51M. Kaneta,45J.H. Kang,59
H. Kanou,44, 54 K. Katou,57 T. Kawabata,9 D. Kawall,45A.V. Kazantsev,28 S. Kelly,10, 11 B. Khachaturov,58
A. Khanzadeev,43 J. Kikuchi,57 D.H. Kim,36 D.J. Kim,59 E. Kim,49 G.-B. Kim,30 H.J. Kim,59 E. Kinney,10
A. Kiss,15 E. Kistenev,5 A. Kiyomichi,44 J. Klay,31 C. Klein-Boesing,35H. Kobayashi,45L. Kochenda,43
V. Kochetkov,20 R. Kohara,19B. Komkov,43 M. Konno,55 D. Kotchetkov,6 A. Kozlov,58A. Kr´al,12A. Kravitz,11
P.J. Kroon,5 J. Kubart,7, 22 C.H. Kuberg,1, ∗G.J. Kunde,32 N. Kurihara,9 K. Kurita,44, 46 M.J. Kweon,27
Y. Kwon,53, 59 G.S. Kyle,39 R. Lacey,50Y.-S. Lai,11 J.G. Lajoie,23 A. Lebedev,23, 28 Y. Le Bornec,41 S. Leckey,51
D.M. Lee,32 M.K. Lee,59 T. Lee,49 M.J. Leitch,32M.A.L. Leite,48B. Lenzi,48 H. Lim,49 T. Liˇska,12A. Litvinenko,24
M.X. Liu,32X. Li,8 X.H. Li,6B. Love,56 D. Lynch,5 C.F. Maguire,56Y.I. Makdisi,5 A. Malakhov,24M.D. Malik,38
V.I. Manko,28 Y. Mao,42, 44 G. Martinez,52 L. Maˇsek,7, 22 H. Masui,55 F. Matathias,11, 51 T. Matsumoto,9, 57
M.C. McCain,1M. McCumber,51P.L. McGaughey,32Y. Miake,55P. Mikeˇs,7, 22K. Miki,55T.E. Miller,56A. Milov,51
S. Mioduszewski,5 G.C. Mishra,18M. Mishra,3 J.T. Mitchell,5 M. Mitrovski,50A.K. Mohanty,4 A. Morreale,6
D.P. Morrison,5J.M. Moss,32 T.V. Moukhanova,28D. Mukhopadhyay,56, 58M. Muniruzzaman,6 J. Murata,46, 44
S. Nagamiya,25Y. Nagata,55 J.L. Nagle,10, 11M. Naglis,58 I. Nakagawa,44, 45 Y. Nakamiya,19 T. Nakamura,19
K. Nakano,44, 54 J. Newby,31, 53 M. Nguyen,51 B.E. Norman,32 A.S. Nyanin,28J. Nystrand,34 E. O’Brien,5
S.X. Oda,9 C.A. Ogilvie,23H. Ohnishi,44I.D. Ojha,3, 56 H. Okada,29, 44 K. Okada,44, 45 M. Oka,55 O.O. Omiwade,1
A. Oskarsson,34I. Otterlund,34 M. Ouchida,19 K. Oyama,9K. Ozawa,9R. Pak,5D. Pal,56, 58 A.P.T. Palounek,32
V. Pantuev,51 V. Papavassiliou,39 J. Park,49 W.J. Park,27 S.F. Pate,39H. Pei,23 V. Penev,24 J.-C. Peng,21
H. Pereira,13V. Peresedov,24D.Yu. Peressounko,28A. Pierson,38 C. Pinkenburg,5R.P. Pisani,5 M.L. Purschke,5
A.K. Purwar,32, 51 J.M. Qualls,1 H. Qu,18 J. Rak,23, 38 A. Rakotozafindrabe,30 I. Ravinovich,58K.F. Read,40, 53
S. Rembeczki,16 M. Reuter,51 K. Reygers,35V. Riabov,43 Y. Riabov,43G. Roche,33A. Romana,30, ∗ M. Rosati,23
S.S.E. Rosendahl,34P. Rosnet,33P. Rukoyatkin,24V.L. Rykov,44 S.S. Ryu,59 B. Sahlmueller,35 N. Saito,29, 44, 45
T. Sakaguchi,5, 9, 57 S. Sakai,55 H. Sakata,19V. Samsonov,43 L. Sanfratello,38R. Santo,35 H.D. Sato,29, 44
S. Sato,5, 25, 55 S. Sawada,25 Y. Schutz,52J. Seele,10R. Seidl,21 V. Semenov,20 R. Seto,6 D. Sharma,58T.K. Shea,5
D. Silvermyr,32, 40C. Silvestre,13K.S. Sim,27 C.P. Singh,3 V. Singh,3S. Skutnik,23M. Sluneˇcka,7, 24 A. Soldatov,20
R.A. Soltz,31 W.E. Sondheim,32 S.P. Sorensen,53I.V. Sourikova,5 F. Staley,13 P.W. Stankus,40 E. Stenlund,34
M. Stepanov,39 A. Ster,26 S.P. Stoll,5 T. Sugitate,19 C. Suire,41 J.P. Sullivan,32 J. Sziklai,26 T. Tabaru,45
S. Takagi,55E.M. Takagui,48 A. Taketani,44, 45 K.H. Tanaka,25 Y. Tanaka,37 K. Tanida,44, 45 M.J. Tannenbaum,5
A. Taranenko,50P. Tarj´an,14T.L. Thomas,38M. Togawa,29, 44 A. Toia,51J. Tojo,44 L. Tom´aˇsek,22 H. Torii,29, 44, 45
R.S. Towell,1 V-N. Tram,30 I. Tserruya,58 Y. Tsuchimoto,19 H. Tydesj¨o,34 N. Tyurin,20 T.J. Uam,36 C. Vale,23
H. Valle,56 H.W. vanHecke,32J. Velkovska,5, 56 M. Velkovsky,51 R. Vertesi,14 V. Veszpr´emi,14 A.A. Vinogradov,28
M. Virius,12 M.A. Volkov,28 V. Vrba,22 E. Vznuzdaev,43 M. Wagner,29, 44 D. Walker,51 X.R. Wang,18, 39 Y. Watanabe,44, 45 J. Wessels,35 S.N. White,5 N. Willis,41 D. Winter,11 F.K. Wohn,23C.L. Woody,5 M. Wysocki,10
W. Xie,6, 45 Y.L. Yamaguchi,57 A. Yanovich,20 Z. Yasin,6 J. Ying,18S. Yokkaichi,44, 45 G.R. Young,40I. Younus,38
I.E. Yushmanov,28 W.A. Zajc,11 O. Zaudtke,35 C. Zhang,11, 40S. Zhou,8 J. Zim´anyi,26, ∗ L. Zolin,24 and X. Zong23
(PHENIX Collaboration)
1Abilene Christian University, Abilene, TX 79699, U.S. 2Institute of Physics, Academia Sinica, Taipei 11529, Taiwan 3Department of Physics, Banaras Hindu University, Varanasi 221005, India
4Bhabha Atomic Research Centre, Bombay 400 085, India 5Brookhaven National Laboratory, Upton, NY 11973-5000, U.S. 6University of California - Riverside, Riverside, CA 92521, U.S. 7Charles University, Ovocn´y trh 5, Praha 1, 116 36, Prague, Czech Republic 8China Institute of Atomic Energy (CIAE), Beijing, People’s Republic of China
9Center for Nuclear Study, Graduate School of Science, University of Tokyo, 7-3-1 Hongo, Bunkyo, Tokyo 113-0033, Japan 10University of Colorado, Boulder, CO 80309, U.S.
11Columbia University, New York, NY 10027 and Nevis Laboratories, Irvington, NY 10533, U.S. 12Czech Technical University, Zikova 4, 166 36 Prague 6, Czech Republic
13Dapnia, CEA Saclay, F-91191, Gif-sur-Yvette, France 14Debrecen University, H-4010 Debrecen, Egyetem t´er 1, Hungary
15ELTE, E¨otv¨os Lor´and University, H - 1117 Budapest, P´azm´any P. s. 1/A, Hungary 16Florida Institute of Technology, Melbourne, FL 32901, U.S.
17Florida State University, Tallahassee, FL 32306, U.S. 18Georgia State University, Atlanta, GA 30303, U.S.
19Hiroshima University, Kagamiyama, Higashi-Hiroshima 739-8526, Japan
20IHEP Protvino, State Research Center of Russian Federation, Institute for High Energy Physics, Protvino, 142281, Russia 21University of Illinois at Urbana-Champaign, Urbana, IL 61801, U.S.
22Institute of Physics, Academy of Sciences of the Czech Republic, Na Slovance 2, 182 21 Prague 8, Czech Republic 23Iowa State University, Ames, IA 50011, U.S.
24Joint Institute for Nuclear Research, 141980 Dubna, Moscow Region, Russia 25KEK, High Energy Accelerator Research Organization, Tsukuba, Ibaraki 305-0801, Japan
26KFKI Research Institute for Particle and Nuclear Physics of the Hungarian Academy
of Sciences (MTA KFKI RMKI), H-1525 Budapest 114, POBox 49, Budapest, Hungary
27Korea University, Seoul, 136-701, Korea
28Russian Research Center “Kurchatov Institute”, Moscow, Russia 29Kyoto University, Kyoto 606-8502, Japan
30Laboratoire Leprince-Ringuet, Ecole Polytechnique, CNRS-IN2P3, Route de Saclay, F-91128, Palaiseau, France 31Lawrence Livermore National Laboratory, Livermore, CA 94550, U.S.
32Los Alamos National Laboratory, Los Alamos, NM 87545, U.S.
33LPC, Universit´e Blaise Pascal, CNRS-IN2P3, Clermont-Fd, 63177 Aubiere Cedex, France 34Department of Physics, Lund University, Box 118, SE-221 00 Lund, Sweden 35Institut f¨ur Kernphysik, University of Muenster, D-48149 Muenster, Germany
36Myongji University, Yongin, Kyonggido 449-728, Korea
37Nagasaki Institute of Applied Science, Nagasaki-shi, Nagasaki 851-0193, Japan 38University of New Mexico, Albuquerque, NM 87131, U.S.
39New Mexico State University, Las Cruces, NM 88003, U.S. 40Oak Ridge National Laboratory, Oak Ridge, TN 37831, U.S.
41IPN-Orsay, Universite Paris Sud, CNRS-IN2P3, BP1, F-91406, Orsay, France 42Peking University, Beijing, People’s Republic of China
43PNPI, Petersburg Nuclear Physics Institute, Gatchina, Leningrad region, 188300, Russia 44RIKEN, The Institute of Physical and Chemical Research, Wako, Saitama 351-0198, Japan 45RIKEN BNL Research Center, Brookhaven National Laboratory, Upton, NY 11973-5000, U.S. 46Physics Department, Rikkyo University, 3-34-1 Nishi-Ikebukuro, Toshima, Tokyo 171-8501, Japan
47Saint Petersburg State Polytechnic University, St. Petersburg, Russia
49System Electronics Laboratory, Seoul National University, Seoul, Korea
50Chemistry Department, Stony Brook University, Stony Brook, SUNY, NY 11794-3400, U.S. 51Department of Physics and Astronomy, Stony Brook University, SUNY, Stony Brook, NY 11794, U.S. 52SUBATECH (Ecole des Mines de Nantes, CNRS-IN2P3, Universit´e de Nantes) BP 20722 - 44307, Nantes, France
53University of Tennessee, Knoxville, TN 37996, U.S.
54Department of Physics, Tokyo Institute of Technology, Oh-okayama, Meguro, Tokyo 152-8551, Japan 55Institute of Physics, University of Tsukuba, Tsukuba, Ibaraki 305, Japan
56Vanderbilt University, Nashville, TN 37235, U.S. 57Waseda University, Advanced Research Institute for Science and
Engineering, 17 Kikui-cho, Shinjuku-ku, Tokyo 162-0044, Japan
58Weizmann Institute, Rehovot 76100, Israel 59Yonsei University, IPAP, Seoul 120-749, Korea
(Dated: October 22, 2018)
We present a new analysis of J/ψ production yields in deuteron-gold collisions at√sNN = 200
GeV using data taken by the PHENIX experiment in 2003 and previously published in [S.S. Adler et al., Phys. Rev. Lett 96, 012304 (2006)]. The high statistics proton-proton J/ψ data taken in 2005 is used to improve the baseline measurement and thus construct updated cold nuclear matter modification factors (RdAu). A suppression of J/ψ in cold nuclear matter is observed as one
goes forward in rapidity (in the deuteron-going direction), corresponding to a region more sensitive to initial state low-x gluons in the gold nucleus. The measured nuclear modification factors are compared to theoretical calculations of nuclear shadowing to which a J/ψ (or precursor) breakup cross section is added. Breakup cross sections of σbreakup = 2.8+1.7−1.4 (2.2+1.6−1.5) mb are obtained by
fitting these calculations to the data using two different models of nuclear shadowing. These breakup cross-section values are consistent within large uncertainties with the 4.2 ± 0.5 mb determined at lower collision energies. Projecting this range of cold nuclear matter effects to copper-copper and gold-gold collisions reveals that the current constraints are not sufficient to firmly quantify the additional hot nuclear matter effect.
PACS numbers: 25.75.Dw
I. INTRODUCTION
Understanding the behavior of QCD matter under dif-ferent conditions of temperature and density is the sub-ject of intense experimental and theoretical work in nu-clear physics. The transition from hadronic matter to a quark-gluon plasma at high temperature is expected to be achieved in high energy heavy ion collisions. The hadronization of partons in vacuum or cold nuclear mat-ter (i.e. in a nucleus) is also of keen inmat-terest, and repre-sents a nonperturbative and dynamic QCD process. The formation and interaction of heavy quarkonia (for exam-ple J/ψ mesons) in vacuum, cold nuclear matter and hot nuclear matter present an excellent laboratory for gaining insights on these transformations. Recent results from the Relativistic Heavy Ion Collider reveal a significant suppression of the final J/ψ yield in central (small
im-pact parameter) Au + Au reactions at√sN N=200 GeV,
relative to expectations scaled from p + p reactions at the same energy [1, 2]. A possible source of this suppres-sion is the screening of the attractive interaction between the quark-antiquark pair in the hot nuclear medium, as temperatures are expected to be above the critical tem-perature for a quark-gluon plasma transition. Larger J/ψ suppression is observed at forward rapidity than at
∗Deceased
†PHENIX Spokesperson: jacak@skipper.physics.sunysb.edu
midrapidity, which contradicts models with only color screening of quarkonia proportional to the local energy density.
Produced c¯c pairs must pass through the remaining
nu-clear material from the incident cold nuclei, in addition to surviving any hot medium environment. The so-called cold nuclear matter effects [3], including modification of initial parton distribution functions (shadowing, gluon saturation, anti-shadowing, EMC effect, etc.), initial and final state partonic multiple scattering, and related initial state parton energy loss need to be accounted for before firm conclusions can be drawn about the effect of the hot medium thought to be created. In fact, these various cold nuclear matter effects are interesting in their own right, notably in terms of hadronization time scales, parton en-ergy loss in matter, and the various initial state effects mentioned above.
This paper presents a new analysis of the modification of J/ψ production in deuteron-gold (d + Au) collisions relative to proton-proton (p + p) collisions at√sN N=200
GeV and the implications for understanding the Au + Au and Cu + Cu data at the same energy. The PHENIX ex-periment has previously published a result using p + p and d + Au data taken in 2003 [4]. A modest J/ψ sup-pression was observed at forward rapidity (i.e. in the deuteron moving direction), which is a possible indica-tion of shadowing of low-x gluons in the gold nucleus. A substantially larger (more than an order of magnitude) p + p data set was recorded in 2005 with the J/ψ re-sults published in [2], and has been used as the baseline
for recent Au + Au and Cu + Cu nuclear modification factors [1, 5]. The same p + p data set is used in the analysis presented here to determine the d + Au nuclear modifications more accurately and in a fully consistent way with those in the Au + Au and Cu + Cu cases. In addition, during the two years between the analyses of the 2003 and 2005 data sets significant improvements in the reconstruction software and signal extraction method were achieved, as well as an overall better understanding of the detector performance. These improvements have been included in this analysis, allowing maximal cancel-lation of systematic errors when using the 2005 p+p data sample to form the J/ψ nuclear modification factor. We first describe the updated analysis, then present the new nuclear modification factors and their implications.
II. EXPERIMENT
The PHENIX apparatus is described in [6]. It consists of two sets of spectrometers referred to as the central arms, which measure particles emitted at midrapidity (|y| < 0.35), and the muon arms, measuring particles emitted at backward and forward rapidity (−2.2 < y < −1.2 and 1.2 < y < 2.2).
At midrapidity, J/ψ particles are measured via their
decay into two electrons. Electrons are identified by
matching tracks reconstructed with drift chambers (DC) and pad chambers (PC) to clusters in the Electromag-netic Calorimeters (EMCAL) and hits in the Ring Imag-ing Cerenkov Counters (RICH). In d + Au collisions, a charged track is identified as an electron candidate by requiring at least three matching RICH phototube hits within a certain radius with respect to the the center defined by the track projection at the RICH, a position matching of ±4 standard deviations between the EM-CAL cluster and the reconstructed track, and a cut on the ratio of energy to momentum. In p + p collisions the electron identification cuts are the same except that only two matching RICH phototube hits are required.
At forward and backward rapidity, J/ψ particles are measured via their decay into two muons. Muons are identified by matching tracks measured in Cathode Strip Chambers (referred to as the Muon Tracker, or MuTR) to hits in alternating planes of Iarocci tubes and steel absorbers (referred to as the Muon Identifier, or MuID). Each muon arm is located behind a thick copper and iron absorber that is meant to absorb most hadrons produced during the collisions, so that the measured muons must penetrate 8 to 11 interaction lengths of material in total. The d + Au data used for this analysis were recorded in 2003 using a minimum bias trigger that required hits in each of the two beam-beam counters (BBC) located at positive and negative rapidity (3 < |η| < 3.9), and represent integrated luminosities for the different
spec-trometers ranging from 1.4 nb−1 to 1.7 nb−1 (or
equiva-lently 2.7 to 3.4 billion interactions). This trigger covers 88 ± 4% of the total d + Au inelastic cross section of 2260
mb [7]. For the electrons, an additional trigger was used that required one hit above threshold in the EMCAL and a matching hit in the RICH. For the muons, two addi-tional triggers were used at different times during the data-taking period. The muon triggers are based on in-formation from the MuID, which has five active detector layers between the steel absorbers. For the first part of the data-taking period, one of the tracks was required to reach the fourth MuID plane, while the other was only required to reach the second MuID plane. For the latter part, the trigger required at least two tracks to reach the fourth MuID plane of Iarocci tubes.
The BBCs are also used to determine the centrality of the d + Au collisions by measuring the energy deposited in the counters located at negative rapidity (in the gold-going direction). For a given centrality bin, the average number of equivalent nucleon-nucleon collisions (Ncoll) is
derived from this energy using a Glauber calculation [8] coupled to a simulation of the BBC. The centrality bins used in this analysis and the corresponding number of collisions are listed in Table I. To ensure that the cen-trality categories are well defined, collisions are required to be within ±30 cm of the center of the interaction re-gion.
III. SIGNAL EXTRACTION
The number of J/ψ particles is determined using the invariant mass distribution of unlike-sign lepton pairs. At midrapidity, the J/ψ signal count is obtained via counting the number of unlike-sign dielectrons after sub-tracting the like-sign pairs in a fixed mass window 2.6 ≤
Me+e− ≤ 3.6 GeV/c
2 or 2.7 ≤ M
e+e− ≤ 3.5 GeV/c
2,
depending on the number of DC hits required for track reconstruction. Figure 1 shows the J/ψ mass spectrum after subtracting the background. The solid black line is the sum of the J/ψ line shape (dashed curve) and an exponential function (dot-dashed curve) describing the continuum component determined from the 2005 p + p data set [2]. The J/ψ line shape function takes into account the momentum resolution of track reconstruc-tion, internal radiative effects [9], and external radiative effects evaluated using a GEANT [10] simulation of the PHENIX detector. The number of J/ψ particles in d+Au collisions is too small to allow a good fit but a compari-son between d+Au and p+p J/ψ line shapes shows good agreement. The fraction of J/ψ candidates outside of the mass window due to the radiative effects is estimated to be 7.2% ± 1.0% based on the line shape functions. The J/ψ signal is also corrected for the dielectron continuum yield, which originates primarily from open charm and Drell-Yan pairs inside the mass window. The estimated contribution is 10% ± 5%, based on the fitting function and PYTHIA [11] simulations. Approximately 400 J/ψ mesons are obtained.
At backward and forward rapidity an event mixing technique is now used to estimate the combinatorial
back-TABLE I: Characterization of the collision centrality for d + Au collisions. First line: centrality bins used in this analysis; Second line: corresponding number of binary collisions Ncoll; lines 3, 4 and 5: c = ǫBBCM B(cent)/ǫBBCJ/ψ for J/ψ mesons emitted in
the three rapidity ranges used for this analysis.
centrality 0-20 % 20-40 % 40-60 % 60-88 % 0-100 %
Ncoll 15.4 ± 1.0 10.6 ± 0.7 7.0 ± 0.6 3.1 ± 0.3 7.6 ± 0.3
c (|y| < 0.35) 0.95 ± 0.03 0.99 ± 0.01 1.03 ± 0.01 1.04 ± 0.03 0.94 ± 0.02
c (−2.2 < y < −1.2) 0.93 ± 0.03 0.99 ± 0.01 1.04 ± 0.01 1.05 ± 0.03 0.94 ± 0.02
c (1.2 < y < 2.2) 1.00 ± 0.03 1.00 ± 0.01 1.02 ± 0.01 1.02 ± 0.03 0.94 ± 0.02
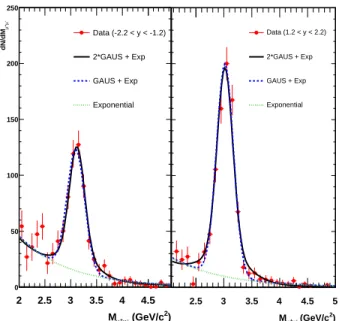
ground, whereas the like-sign pairs were used in the pre-vious analysis [4]. The prepre-vious method suffered from a larger statistical uncertainty for bins where the signal over background is poor. A sample mass distribution after the subtraction of the mixed event background is shown in Figure 2. Approximately 500 and 750 J/ψ mesons are obtained for backward and forward rapid-ity, respectively. The signal counts are determined from this subtracted dimuon invariant mass distribution with a log-likelihood fit and assuming three different func-tional forms and parameters. In all three cases, an ex-ponential form is used to account for correlated physical background sources (e.g. Drell-Yan or open charm) and the possible systematic offset in the normalization of the mixed event background. The number of J/ψ particles is then estimated either by direct counting of the remain-ing number of pairs above the exponential in the mass
range 2.6 ≤ Mµ+µ− ≤ 3.6 GeV/c
2; using a Gaussian
function with the center fixed to the J/ψ mass and the width and integrated yield left free; or using two Gaus-sian functions for which both the center and widths are fixed to the values measured in p + p collisions. The two Gaussian functions account for the nonGaussian tails in the invariant mass distribution. The normalization of the mixed background is varied by a systematic uncer-tainty of ±2% prior to its subtraction from the mass dis-tribution. This uncertainty is determined by comparing different normalization methods. The corresponding sig-nal variations are included in the systematic uncertainty. Due to the fit procedure described above, for all p+p and d + Au cases this normalization uncertainty results in a very small systematic uncertainty on the number of mea-sured J/ψ particles. This entire procedure is identical to the one used in [1, 2].
IV. INVARIANT YIELD
The J/ψ invariant yield in a given centrality, trans-verse momentum and rapidity bin is:
Bll 2πpT d2N J/ψ dpTdy = 1 2πpT∆pT∆y NcountsJ/ψ
AǫrecǫtrigNevtMB
ǫBBC
MB(cent)
ǫBBC
J/ψ
(1)
with Bll being the branching ratio for J/ψ → l+l−;
NcountsJ/ψ the number of reconstructed J/ψ mesons; NevtMB
) 2 (GeV/c -e + e M 2 2.2 2.4 2.6 2.8 3 3.2 3.4 3.6 3.8 4 -e + e dN/dM -10 0 10 20 30 40 Data Fit/Sum Signal Continuum
FIG. 1: (color online) Invariant mass spectra in minimum bias d + Au reactions for J/ψ −→ e+e−
at |y| < 0.35, with the functional forms used to extract the number of reconstructed J/ψ mesons.
the number of minimum bias events sampled; ǫBBC
MB(cent)
the BBC trigger efficiency for minimum bias events in
a given centrality category; ∆pT and ∆y the pT and y
bin widths; A and ǫrecthe acceptance and reconstruction
efficiency corrections; ǫtrigthe additional J/ψ trigger
effi-ciency and ǫBBCJ/ψ the BBC efficiency for events containing a J/ψ. All invariant yields as a function of pT and y
in-cluding statistical and systematic uncertainties are given in Table II.
The experiment measures the number of J/ψ particles per BBC triggered events, which in d + Au collisions rep-resent only 88 ± 4% of the total inelastic cross section. An additional correction is then applied such that the in-variant yield represents 100% of the total inelastic cross
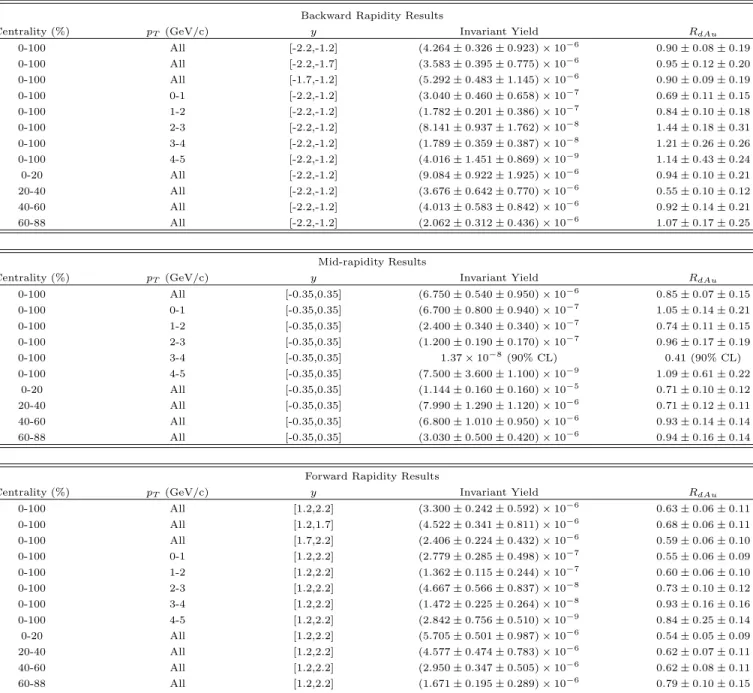
TABLE II: The errors quoted in these tables represent 1) the statistical and Type A systematic uncertainties added in quadra-ture, and 2) the Type B systematic uncertainties. The Type C errors are shown in the relevant figures.
Backward Rapidity Results
Centrality (%) pT (GeV/c) y Invariant Yield RdAu
0-100 All [-2.2,-1.2] (4.264 ± 0.326 ± 0.923) × 10−6 0.90 ± 0.08 ± 0.19 0-100 All [-2.2,-1.7] (3.583 ± 0.395 ± 0.775) × 10−6 0.95 ± 0.12 ± 0.20 0-100 All [-1.7,-1.2] (5.292 ± 0.483 ± 1.145) × 10−6 0.90 ± 0.09 ± 0.19 0-100 0-1 [-2.2,-1.2] (3.040 ± 0.460 ± 0.658) × 10−7 0.69 ± 0.11 ± 0.15 0-100 1-2 [-2.2,-1.2] (1.782 ± 0.201 ± 0.386) × 10−7 0.84 ± 0.10 ± 0.18 0-100 2-3 [-2.2,-1.2] (8.141 ± 0.937 ± 1.762) × 10−8 1.44 ± 0.18 ± 0.31 0-100 3-4 [-2.2,-1.2] (1.789 ± 0.359 ± 0.387) × 10−8 1.21 ± 0.26 ± 0.26 0-100 4-5 [-2.2,-1.2] (4.016 ± 1.451 ± 0.869) × 10−9 1.14 ± 0.43 ± 0.24 0-20 All [-2.2,-1.2] (9.084 ± 0.922 ± 1.925) × 10−6 0.94 ± 0.10 ± 0.21 20-40 All [-2.2,-1.2] (3.676 ± 0.642 ± 0.770) × 10−6 0.55 ± 0.10 ± 0.12 40-60 All [-2.2,-1.2] (4.013 ± 0.583 ± 0.842) × 10−6 0.92 ± 0.14 ± 0.21 60-88 All [-2.2,-1.2] (2.062 ± 0.312 ± 0.436) × 10−6 1.07 ± 0.17 ± 0.25 Mid-rapidity Results
Centrality (%) pT (GeV/c) y Invariant Yield RdAu
0-100 All [-0.35,0.35] (6.750 ± 0.540 ± 0.950) × 10−6 0.85 ± 0.07 ± 0.15 0-100 0-1 [-0.35,0.35] (6.700 ± 0.800 ± 0.940) × 10−7 1.05 ± 0.14 ± 0.21 0-100 1-2 [-0.35,0.35] (2.400 ± 0.340 ± 0.340) × 10−7 0.74 ± 0.11 ± 0.15 0-100 2-3 [-0.35,0.35] (1.200 ± 0.190 ± 0.170) × 10−7 0.96 ± 0.17 ± 0.19 0-100 3-4 [-0.35,0.35] 1.37 × 10⁻⁸(90% CL) 0.41 (90% CL) 0-100 4-5 [-0.35,0.35] (7.500 ± 3.600 ± 1.100) × 10−9 1.09 ± 0.61 ± 0.22 0-20 All [-0.35,0.35] (1.144 ± 0.160 ± 0.160) × 10−5 0.71 ± 0.10 ± 0.12 20-40 All [-0.35,0.35] (7.990 ± 1.290 ± 1.120) × 10−6 0.71 ± 0.12 ± 0.11 40-60 All [-0.35,0.35] (6.800 ± 1.010 ± 0.950) × 10−6 0.93 ± 0.14 ± 0.14 60-88 All [-0.35,0.35] (3.030 ± 0.500 ± 0.420) × 10−6 0.94 ± 0.16 ± 0.14
Forward Rapidity Results
Centrality (%) pT (GeV/c) y Invariant Yield RdAu
0-100 All [1.2,2.2] (3.300 ± 0.242 ± 0.592) × 10−6 0.63 ± 0.06 ± 0.11 0-100 All [1.2,1.7] (4.522 ± 0.341 ± 0.811) × 10−6 0.68 ± 0.06 ± 0.11 0-100 All [1.7,2.2] (2.406 ± 0.224 ± 0.432) × 10−6 0.59 ± 0.06 ± 0.10 0-100 0-1 [1.2,2.2] (2.779 ± 0.285 ± 0.498) × 10−7 0.55 ± 0.06 ± 0.09 0-100 1-2 [1.2,2.2] (1.362 ± 0.115 ± 0.244) × 10−7 0.60 ± 0.06 ± 0.10 0-100 2-3 [1.2,2.2] (4.667 ± 0.566 ± 0.837) × 10−8 0.73 ± 0.10 ± 0.12 0-100 3-4 [1.2,2.2] (1.472 ± 0.225 ± 0.264) × 10−8 0.93 ± 0.16 ± 0.16 0-100 4-5 [1.2,2.2] (2.842 ± 0.756 ± 0.510) × 10−9 0.84 ± 0.25 ± 0.14 0-20 All [1.2,2.2] (5.705 ± 0.501 ± 0.987) × 10−6 0.54 ± 0.05 ± 0.09 20-40 All [1.2,2.2] (4.577 ± 0.474 ± 0.783) × 10−6 0.62 ± 0.07 ± 0.11 40-60 All [1.2,2.2] (2.950 ± 0.347 ± 0.505) × 10−6 0.62 ± 0.08 ± 0.11 60-88 All [1.2,2.2] (1.671 ± 0.195 ± 0.289) × 10−6 0.79 ± 0.10 ± 0.15
section (as done in previous PHENIX d + Au analyses).
The correction factor ratio ǫBBC
MB(cent)/ǫBBCJ/ψ depends a
priorion the centrality bin and the rapidity range of the measured J/ψ particles. The values are given in Table I. The same procedure is applied for p+ p collisions, so that the yields are normalized to the p + p total inelastic cross section of 42 mb.
The acceptance and efficiency corrections are deter-mined using a full GEANT simulation [10] of the detector with realistic resolutions and detector plane efficiencies determined using real data. Compared to the original result [4], this simulation benefits from improvements in the understanding of the detector alignment, resolution,
and overall performance. It also includes the improve-ments added to the reconstruction software and used for the recent p + p, Cu + Cu and Au + Au analyses [1, 2, 5]. Although the additional underlying hit occupancies per event are modest in p + p and d + Au collisions, they are accounted for by embedding the simulated J/ψ mesons in real data events. The observed differences (4-5%) be-tween embedded and nonembedded events are not signif-icant given the statistics of the simulations, and therefore are included only as a contribution to the systematic un-certainty.
The systematic uncertainties in the J/ψ invariant yield (Table III) are grouped into three categories as in the
) 2 (GeV/c -µ + µ M 2 2.5 3 3.5 4 4.5 -µ +µ dN/dM 0 50 100 150 200 250 Data (-2.2 < y < -1.2) 2*GAUS + Exp GAUS + Exp Exponential ) 2 (GeV/c -µ + µ M 2.5 3 3.5 4 4.5 5 0 50 100 150 200 250 Data (1.2 < y < 2.2) 2*GAUS + Exp GAUS + Exp Exponential
FIG. 2: (color online) Invariant mass spectra in minimum bias d + Au reactions for (left) J/ψ −→ µ+µ−
at −2.2 < y < −1.2 and (right) J/ψ −→ µ+µ− at 1.2 < y < 2.2, with the
functional forms used to extract the number of reconstructed J/ψ mesons.
TABLE III: Sources of systematic uncertainties on the J/ψ invariant yield in d + Au collisions. Columns 2 (3) are the average values at mid (forward) rapidity. When two values are given, the first (second) is for peripheral (central) colli-sions. Uncertainties of type A (type B) are point to point uncorrelated (correlated).
source |y| < 0.35 |y| ∈ [1.2, 2.2] type
signal extraction 6 % <10 % A
acceptance 8 % 10 % B
efficiency 6 % 8 to 20 % B
run by run variation 5 % 8 % B
input y, pTdistributions 2 % 4 % B
embedding 4 % 5 % B
previous analyses: point to point uncorrelated (Type A), for which the points can move independently from one another; point to point correlated (Type B), for which the points can move coherently though not necessarily by the same amount; and global uncertainties (Type C), for which all points move by the same multiplicative fac-tor. Statistical and uncorrelated systematic uncertainties (Type A) are summed in quadrature and represented as vertical bars. Type B uncertainties are represented with boxes. The Type C globally correlated systematic uncer-tainties are quoted directly on the Figures.
Figure 3 shows the invariant J/ψ yield as a function of transverse momentum for d + Au collisions from this new analysis together with the published invariant yield
0 0.5 1 1.5 2 2.5 3 3.5 4 4.5 5 -9 10 -8 10 -7 10 -6 10 -2.2 < y < -1.2
4% Global Scale Uncertainty ± d+Au 200GeV p+p 200GeV 0 0.5 1 1.5 2 2.5 3 3.5 4 4.5 5
Invariant Yield
ψ
J/
-9 10 -8 10 -7 10 -6 10 |y| < 0.353% Global Scale Uncertainty ± (GeV/c) T p 0 0.5 1 1.5 2 2.5 3 3.5 4 4.5 5 -9 10 -8 10 -7 10 -6 10 1.2 < y < 2.2
4% Global Scale Uncertainty ±
FIG. 3: (color on-line) J/ψ invariant yield versus pT in d +
Au collisions and p + p collisions. The three panels are for rapidity selections −2.2 < y < −1.2, |y| < 0.35, and 1.2 < y < 2.2 from top to bottom. See text for description of the uncertainties and details of the functional fits.
measured in p+p collisions [2]. From these yields, a hpT2i
is calculated using the following generic functional form to fit the data:
d2N
pTdpT ∼ A(1 + (pT/B)
2)−6 (2)
In order to account for finite pT binning, the fit
func-tion is first integrated over each ∆pTrange and the
inte-gral is compared to data in the corresponding bin. The measured hpT2i as well as the associated statistical and
systematic uncertainties are shown in Table IV.
In previous J/ψ analyses [1, 2], it was found that only for the high statistics p + p data set (where the
TABLE IV: hpT2i calculated from a fit to the data and
re-stricted to the range 0 < pT< 5 GeV/c. See text for
descrip-tion of the uncertainties.
species rapidity hpT2i[0, 5]
d+Au [-2.2,-1.2] 4.3 ± 0.3 ± 0.4 d+Au [-0.35, 0.35] 3.9 ± 0.3 ± 0.3 d+Au [1.2,2.2] 4.0 ± 0.2 ± 0.4 p+p [-2.2,-1.2] 3.4 ± 0.1 ± 0.1 p+p [-0.35, 0.35] 4.1 ± 0.2 ± 0.1 p+p [1.2,2.2] 3.4 ± 0.1 ± 0.1
functional form of the pTspectrum well constrained. In
the Au + Au case, the functional form is not well con-strained and leads to a very large systematic uncertainty on the hpT2i if integrated from 0 to ∞. The integral was
therefore limited to pT< 5 GeV/c, where it is best
con-strained by the data. The d + Au data set suffers from the same statistical limitations and the same truncation to pT < 5 GeV/c is applied. Finally, this constraint is
also applied to the p+p case to make a direct comparison possible.
Two uncertainties are quoted in Table IV. The first corresponds to the statistical and point-to-point uncorre-lated systematic uncertainties (Type A) on the measured yields. It is obtained directly from the fit using the
sec-ond derivatives of the χ2 surface at the minimum. The
second corresponds to the point-to-point correlated sys-tematic uncertainties (Type B). The contribution from the Type B uncertainty is estimated independently by coherently moving the measured points within the one standard deviation limit given by these uncertainties, al-lowing them to be either correlated or anti-correlated, and then re-doing the fit in all cases. The largest differ-ence observed in the values obtained by the fit is used as an upper limit to the 1-sigma point-to-point correlated uncertainties on the hpT2i.
In the previous publication [4], values for the fully
inte-grated hpT2i in p+p and d+Au are quoted. A significant
systematic uncertainty originating from not knowing the functional form to best describe the data was found since then that was not included in the uncertainty quoted in the paper. In addition, the new analysis revealed a bias in the previous result that increased the signal, particu-larly in the lowest pTbin. This bias is now corrected by
using the mixed event background subtraction technique described above together with the modified log-likelihood fit over a more appropriate range, corresponding to the region where the physical background can accurately be described by a single exponential function. Finally, no separate treatment of the point-to-point correlated sys-tematic uncertainties was performed at that time, since it was assumed that it would move all points in the same direction (positive correlation) and thus have no impact on the measured hpT2i.
The data, within uncertainties, includes the
possib-lity of a modest broadening of the transverse momentum distribution relative to p + p collisions. This is often attributed to initial and final state multiple scattering, sometimes referred to as the “Cronin effect.” However, in calculating the ∆hpT2i = hpT2idAu− hpT2ippone finds
this effect needs reduced uncertainties from future larger data sets to make any firm conclusions.
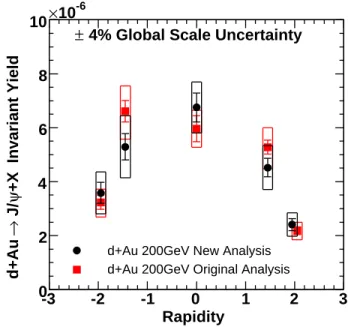
Figure 4 shows the J/ψ invariant yield, integrated over all pT, as a function of rapidity for d + Au collisions.
Shown are the results of the new analysis presented in this paper, as well as the previously published results [4] using the same data set. Overall the agreement of the two analysis results is good. The two sets of points dif-fer in the reconstruction software, analysis cuts, and sig-nal extraction technique. Thus many of the systematic uncertainties are different, and even the statistical un-certainties are not identical due to the different analysis cuts and the use of event mixing to estimate the combi-natorial background in the new analysis, as opposed to the like-sign mass distribution used in [4].
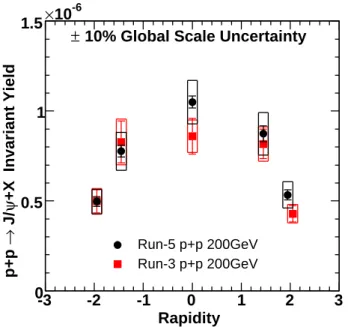
Figure 5 shows the J/ψ invariant yield for p + p colli-sions, from both the published high statistics result from Run-5 [2], as well as the lower statistics result from Run-3 as published in [4]. In both cases the points are in good agreement within the systematic uncertainty bands. A new analysis of the Run-3 p + p lower statistics data set was also performed using the same technique and anal-ysis cuts as for d + Au collisions. It also shows good agreement with these two sets of measurements, albeit with larger statistical uncertainties.
Rapidity -3 -2 -1 0 1 2 3 +X Invariant Yield ψ J/ → d+Au 0 2 4 6 8 10 -6 10 ×
4% Global Scale Uncertainty
±
d+Au 200GeV New Analysis d+Au 200GeV Original Analysis
FIG. 4: (color online) J/ψ invariant yield as a function of rapidity for d + Au collisions. Shown are the new analysis re-sults from this paper, in addition to the originally published results [4] using the same data. The global systematic uncer-tainty quoted is for the new analysis.
Rapidity -3 -2 -1 0 1 2 3 +X Invariant Yield ψ J/ → p+p 0 0.5 1 1.5 -6 10 ×
10% Global Scale Uncertainty
±
Run-5 p+p 200GeV Run-3 p+p 200GeV
FIG. 5: (color online) J/ψ invariant yield as a function of rapidity for p + p collisions. Shown are the high statistics results from 2005 p + p PHENIX data taking period [2], and the originally published results [4] using the 2003 p + p data set. The global systematic uncertainty quoted is for the new analysis.
In Figures 4 and 5, the highest rapidity point is not located exactly at the same rapidity position between the original and the new analysis. This is due to the fact that the positive rapidity muon arm has a slightly larger rapidity coverage than the negative rapidity arm. This property was used in the 2003 analysis to include additional J/ψ mesons at forward rapidity in order to probe a slightly lower region of x. It was found, however, that there were very few counts in this region and that the asymmetric rapidity range created additional difficul-ties when comparing the results measured at forward and backward rapidity (in case of symmetric collisions) and when comparing the results obtained in p+ p collisions to Cu + Cu or Au + Au collisions, for which this extra ra-pidity coverage was not available (due to high occupancy limitations at forward rapidity). As a consequence, it was decided for the later analyses to forgo the extra few J/ψ counts at very forward rapidity and use the same width rapidity bins at both positive and negative rapidity.
V. NUCLEAR MODIFICATION FACTOR
The J/ψ nuclear modification factor in a given central-ity and rapidcentral-ity bin is:
RdAu = 1 hNcolli dNJ/ψd+Au/dy dNJ/ψp+p/dy (3) with dNdAu
J/ψ/dy being the J/ψ invariant yield measured
in d + Au collisions; dNJ/ψpp /dy the J/ψ invariant yield measured in p + p collisions for the same rapidity bin and hNcolli the average number of binary collisions in the
cen-trality bin under consideration, as listed in Table I. All RdAu values as a function of pT, y and centrality
includ-ing statistical and systematic uncertainties are given in the Appendix Table II.
Figure 6 shows the nuclear modification factor RdAu
calculated using the d + Au new analysis presented in this paper for the numerator and the 2005 p + p data for the denominator. In contrast to the previous analysis [4], where the p + p results were symmetrized around y = 0
before calculating RdAu to compensate for lower J/ψ
statistics in the 2003 p+ p data set, in this case the RdAu
values are calculated independently at each rapidity. The understanding of the detector performance in terms of alignment, resolution and efficiency has signif-icantly improved between this analysis and previously published PHENIX d + Au results [4]. This resulted in changes in the reconstruction software, analysis cuts, sig-nal extraction technique and handling of both the phys-ical and combinatorial background in the dilepton in-variant mass distribution. Simultaneously, the system-atic uncertainties associated with the measurement have also been re-evaluated in a way consistent with what was learned for the p + p, Cu + Cu, and Au + Au analyses. The new uncertainties are in general larger, although some of them cancel with their p + p counterpart when
forming RdAu. This approximately counterbalances the
reduction of the statistical uncertainty achieved by us-ing the 2005 p + p data set as a reference. Additionally, the J/ψ production cross sections in p + p collisions mea-sured in 2005 [2] are compatible within uncertainties, but higher than the values used in [4] (based on the 2003 p+p data set) by about 13 %. As a consequence, the new nu-clear modification factors are systematically lower than the ones previously published by about 5 to 20% for most points, depending on the pT, y or centrality bin that is
considered.
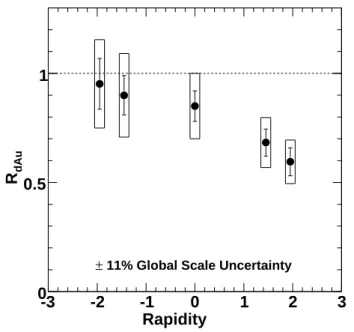
Within uncertainties, the nuclear modification factors
are consistent with RdAu = 1.0 at negative and
midra-pidities, and are significantly lower than 1.0 at forward rapidity only, that is, in the deuteron-going direction. This trend is similar to that shown in Figure 1 of [4], al-though the new values are systematically smaller for all rapidity bins.
Figure 7 shows the J/ψ nuclear modification factor in d + Au collisions as a function of the number of bi-nary collisions for three rapidity ranges and four central-ity classes. Only at forward rapidcentral-ity is there statistically significant suppression.
VI. DISCUSSION
As stated in the Introduction, the d + Au data is interesting both to fundamentally understand issues of
Rapidity
-3
-2
-1
0
1
2
3
dAu
R
0
0.5
1
11% Global Scale Uncertainty ±
FIG. 6: J/ψ nuclear modification factor RdAu as a function
of rapidity.
quarkonia and cold nuclear matter and also to separate these effects from hot nuclear matter effects in heavy ion collisions. In order to address both issues, we compare the experimental data with two different models includ-ing both modification of the initial parton distribution functions (PDF) and a free parameter to account for the breakup of correlated c¯c pairs that might have otherwise formed J/ψ mesons. Note that often in the literature, this breakup process in cold nuclear matter is referred to as an absorption cross section of the J/ψ particles on the nucleons in the nucleus. Here we avoid this nomenclature both because the object that is “absorbed” is generally not a fully-formed J/ψ but rather a c¯c pair, and because the actual process is more a breakup of this pair, rather than the absorption of it.
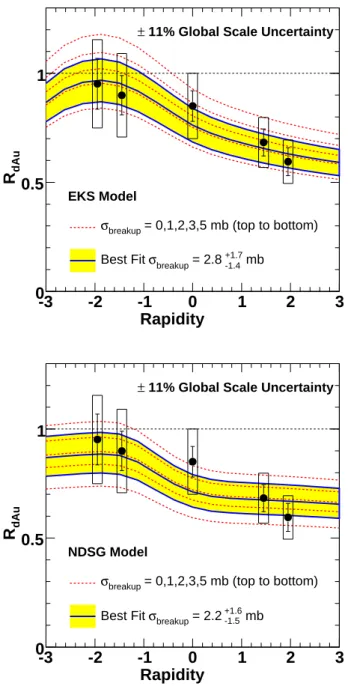
Shown in Figure 8 is the nuclear modification factor
RdAu as a function of rapidity in comparison to
theo-retical calculations [3] that include either EKS [12] or NDSG [13] shadowing models for the nuclear PDFs. In each case an additional suppression associated with a σbreakup is also included. Note that there is no ab
ini-tio calculation of this cross section, and while one might expect a similar value to results at lower energy [14], it need not be identical.
Taking full account of the statistical and systematic uncertainties on the experimental data, the breakup cross section is determined under certain assumptions. We have followed the statistical procedure detailed in [15]. If we assume that the EKS modified nuclear PDFs are exactly correct, and that the only additional suppression
is accounted for by σbreakup, then the data constrains
σbreakup = 2.8+1.7−1.4mb with the uncertainties as one
stan-dard deviation. Similarly, if we assume the NDSG
modi-0 2 4 6 8 10 12 14 16 18 0.5 1 11% Global Systematic ± -2.2 < y < -1.2 0 2 4 6 8 10 12 14 16 18
dAu
R
0.5 1 10% Global Systematic ± |y|<0.35 coll N 0 2 4 6 8 10 12 14 16 18 0.5 111% Global Systematic
±
1.2 < y < 2.2
FIG. 7: J/ψ nuclear modification factor RdAu as a function
of Ncollfor three rapidity ranges.
fied nuclear PDFs, then we obtain σbreakup= 2.2+1.6−1.5mb.
These breakup cross-section values are consistent (within the large uncertainties) with the 4.2 ± 0.5 mb determined at lower energies at the CERN-SPS [14]. The extracted breakup cross section at lower energies assumes no con-tribution from the modification of nuclear PDFs. At the lower energies, J/ψ production is sensitive to higher-x partons in the anti-shadowing regime where the modifi-cations are expected to be smaller and in the opposite direction [16].
The modified nuclear PDFs from EKS and NDSG are constrained from other experimental measurements such
Rapidity
-3
-2
-1
0
1
2
3
dAu
R
0
0.5
1
EKS Model = 0,1,2,3,5 mb (top to bottom) breakup σ mb -1.4 +1.7 = 2.8 breakup σ Best Fit11% Global Scale Uncertainty ±
Rapidity
-3
-2
-1
0
1
2
3
dAu
R
0
0.5
1
NDSG Model = 0,1,2,3,5 mb (top to bottom) breakup σ mb -1.5 +1.6 = 2.2 breakup σ Best Fit11% Global Scale Uncertainty ±
FIG. 8: (color online) RdAu data compared to various
the-oretical curves for different σbreakup values. Also, shown as
a band are the range of σbreakupfound to be consistent with
the data within one standard deviation. The top panel is a comparison for EKS shadowing [12], while the bottom panel is for NDSG shadowing [13].
as deep inelastic scattering from various nuclear targets and the resulting F2(A) structure functions. A geometric
parametrization of these PDFs based on the path of the parton through the nucleus is described in [17] and [3]. One can test this geometric dependence by comparison with the d+Au nuclear modification factors as a function of Ncoll. Using this geometric dependence, the most
prob-able σbreakupis calculated independently in three rapidity
0 2 4 6 8 10 12 14 16 18 0 0.5 1 11%) ± global PHENIX Data -2.2<y<-1.2 (syst
mb -1.8 +1.6 = 5.2 breakup σ EKS Shadowing + mb -1.7 +2.0 = 3.3 breakup σ NDSG Shadowing + 0 2 4 6 8 10 12 14 16 18
dAu
R
0 0.5 1 10%) ± global PHENIX Data |y|<0.35 (systmb -1.6 +1.9 = 2.4 breakup σ EKS Shadowing + mb -1.7 +1.8 = 1.0 breakup σ NDSG Shadowing + coll N 0 2 4 6 8 10 12 14 16 18 0 0.5 1 11%) ± global PHENIX Data 1.2<y<2.2 (syst
mb -1.5 +1.6 = 3.2 breakup σ EKS Shadowing + mb -1.5 +1.5 = 3.3 breakup σ NDSG Shadowing +
FIG. 9: (color online) RdAu data as a function of Ncoll
for three different rapidity ranges. Overlayed are theoreti-cal curves representing the best fit σbreakup values as
deter-mined in each rapidity range separately, utilizing EKS and NDSG nuclear PDFs and a simple geometric dependence. Also, shown as bands are the range of σbreakup found to be
consistent with the data within one standard deviation.
ranges (see Table V). The corresponding nuclear modifi-cation values and their one standard deviation bands are
shown as a function of Ncoll in Figure 9. The two
calcu-lations with EKS and NDSG nuclear PDFs yield almost identical bands since the same geometric dependence is used in both cases. However, each band represents a dif-ferent balance of modification due to the nuclear PDF
TABLE V: Most probable values and one standard deviations of σbreakupassuming two different shadowing models, from a
fit to minimum bias RdAu points as a function of rapidity
(Figure 8), and fits to RdAu as a function of Ncoll in three
separate rapidity bins (Figure 9).
Fit Range in y EKS (mb) NDSG (mb)
All 2.8+1.7−1.4 2.2+1.6−1.5
[−2.2, −1.2] 5.2+1.6−1.8 3.3+2.0−1.7
[−0.35, 0.35] 2.4+1.9
−1.6 1.0+1.8−1.7
[1.2, 2.2] 3.2+1.6−1.5 3.3+1.5−1.5
and the breakup cross section.
For both the EKS and the NDSG PDFs, the values of σbreakup extracted from the overall rapidity dependence
of RdAu and from the Ncoll dependence of RdAu within
the different rapidity ranges are consistent within the large systematic uncertainties. It should be noted that though the 1−p-value for the best fit is poor at backward rapidity (as can be seen in Fig. 9), there is still a well
de-fined maximum in the likelihood function for σbreakup.
A future higher precision RdAu measurement as a
func-tion of centrality will be crucial to constrain the exact geometric dependence.
One can also utilize this model to do a consistent cal-culation of the contribution from cold nuclear matter ef-fects that should be present in Cu + Cu and Au + Au collisions. These contributions, using the best fit value of σbreakup and their one standard deviation values
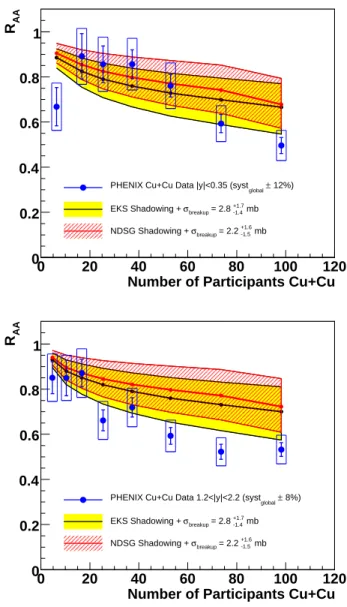
ex-tracted from the data in Figure 8 for each of the two shadowing models, are shown in Figures 10 and 11. In the Cu + Cu case, J/ψ production is not suppressed be-yond cold nuclear matter effects at midrapidity or at for-ward rapidity, within the limits of the large error bands, and the midrapidity data in the Au + Au case is similarly inconclusive. However, there is a significant suppression in the data at forward rapidity, beyond the uncertain-ties in both the data and the projection. It should be noted that the uncertainty band at forward and midra-pidities are entirely correlated, as they reflect only the
uncertainty in the σbreakup. There is no systematic
un-certainty included for the choice of modified nuclear PDF model, which is the only way to change the relative sup-pression between forward and midrapidities within the context of this calculation. The more data-driven cal-culation described later in this section, however, is per-formed independently at different rapidities and does not suffer the same stipulation.
It should also be noted that the theoretical calcula-tions yield RAAas a continuous function of the number of
participants, whereas the data points are at discrete val-ues representing a convolution of the modification factor with the Npartdistribution within a particular centrality
category. A Glauber simulation combined with a Monte Carlo of the PHENIX experimental trigger and central-ity selection is utilized to convert the continuous
the-Number of Participants Cu+Cu
0 20 40 60 80 100 120 AA R 0 0.2 0.4 0.6 0.8 1 12%) ± global
PHENIX Cu+Cu Data |y|<0.35 (syst
mb -1.4 +1.7 = 2.8 breakup σ EKS Shadowing + mb -1.5 +1.6 = 2.2 breakup σ NDSG Shadowing +
Number of Participants Cu+Cu
0 20 40 60 80 100 120 AA R 0 0.2 0.4 0.6 0.8 1 8%) ± global
PHENIX Cu+Cu Data 1.2<|y|<2.2 (syst
mb -1.4 +1.7 = 2.8 breakup σ EKS Shadowing + mb -1.5 +1.6 = 2.2 breakup σ NDSG Shadowing +
FIG. 10: (color online) RAA for Cu+Cu [5] collisions
com-pared to a band of theoretical curves for the σbreakup values
found to be consistent with the d + Au data as shown in Fig-ure 8. The top figFig-ure includes both EKS shadowing [12] and NDSG shadowing [13] at midrapidity. The bottom figure is the same at forward rapidity.
ory predictions into discrete predictions in the simulated PHENIX centrality categories. Thus, the results shown in the figures are in fact predictions for the matched event selection categories of the experimental data points.
In order to explore the cold nuclear matter constraints further, an alternative data-driven method proposed in [18] is used. This approach assumes that there is a single modification factor parameterizing all cold nuclear matter effects that is a simple function of the radial posi-tion in the nucleus. This computaposi-tion has the advantage of not having to assume a specific shadowing scheme and a specific breakup cross section, but instead relies only on the measured impact parameter dependence. It assumes
Number of Participants Au+Au 0 50 100 150 200 250 300 350 400 AA R 0 0.2 0.4 0.6 0.8 1 12%) ± global
PHENIX Au+Au Data |y|<0.35 (syst mb -1.4 +1.7 = 2.8 breakup σ EKS Shadowing + mb -1.5 +1.6 = 2.2 breakup σ NDSG Shadowing +
Number of Participants Au+Au
0 50 100 150 200 250 300 350 400 AA R 0 0.2 0.4 0.6 0.8 1 7%) ± global
PHENIX Au+Au Data 1.2<|y|<2.2 (syst
mb -1.4 +1.7 = 2.8 breakup σ EKS Shadowing + mb -1.5 +1.6 = 2.2 breakup σ NDSG Shadowing +
FIG. 11: (color online) RAA for Au+Au [1] collisions
com-pared to a band of theoretical curves for the σbreakup values
found to be consistent with the d + Au data as shown in Fig-ure 8. The top figFig-ure includes both EKS shadowing [12] and NDSG shadowing [13] at midrapidity. The bottom figure is the same at forward rapidity.
that the cold nuclear matter effects suffered by a J/ψ in a Au + Au collision at a given rapidity are the prod-uct of the modifications measured in d + Au collisions at the same rapidity and the modifications measured at the opposite rapidity (or equivalently in a Au + d colli-sion). This assumption holds for the two effects consid-ered so far, namely shadowing and subsequent breakup. It also assumes that the same parton distributions are sampled by the J/ψ particles observed in the (wide) ra-pidity range in Au + Au and d + Au collisions. Note that since this model implicitly includes any possible modi-fied nuclear PDFs, the modification factors may have an x-dependence that is accounted for by considering the
backward, mid and forward rapidity d + Au data. The different rapidity regions are sensitive to the initial-state partons in the gold nucleus in three broad ranges of x, corresponding to x ≈ 0.002-0.01, 0.01-0.05, and 0.05-0.2, as determined from PYTHIA.
A Glauber Monte Carlo and a simulation of the BBC detector used for centrality determination and triggering are done. The resulting four centrality categories (0-20%, 20-40%, 40-60%, 60-88%) in d + Au collisions are char-acterized by a distribution in the number of binary colli-sions, as shown in the top panel of Figure 12. In addition, the distribution of radial positions r in the Au nucleus of binary collisions is calculated and shown in the bottom panel of Figure 12.
The procedure is to use the forward, mid, and
back-ward rapidity centrality-dependent RdAu to constrain
the modification factor ℜ(r) for three broad regions of initial parton x (ℜlow, ℜmid, ℜhigh respectively). Then
one can use these parameterizations to project the cold nuclear matter effect in the Au + Au case. The current d + Au data are insufficient to constrain the functional form of ℜ(r). As a simplifying case, ℜ(r) is assumed to be linear in r and to be fixed at ℜ(r ≥ 8 fm) = 1.0 at the edge of the gold nucleus. Thus, the only free pa-rameter is the slope (or equivalently the magnitude of the modification factor at r = 0). Other functions were tried and essentially differ by their extrapolation to lower and higher radial positions, since the data are not precise enough to constrain the shape. This has a particularly strong impact on the most peripheral collisions for which our assumption that ℜ(r ≥ 8 fm) = 1.0 adds a significant constraint to the shape.
For all possible slope parameters, consistency with the experimental data is checked using the procedure de-tailed in [15], which utilizes the full statistical and sys-tematic uncertainties. The range of parameters within one standard deviation of the uncertainties is deter-mined separately for backward, mid, and forward ra-pidity. Using this range of parameters, the cold nuclear matter suppression expected in Au + Au collisions is pro-jected as a function of collision centrality and for mid and forward rapidity. Note that the forward rapidity Au + Au J/ψ production is sensitive to the low-x par-tons in one gold nucleus and the high-x parpar-tons in the other gold nucleus. Thus, in the Monte Carlo, for ev-ery binary collision at r1 and r2 (the radii with respect
to the center of each nucleus) the expected modification is ℜlow(r1) × ℜhigh(r2). The midrapidity Au + Au J/ψ
production is predominantly sensitive to the mid-x par-tons from both gold nuclei and therefore the expected modification is ℜmid(r1) × ℜmid(r2). The total
modifica-tion expected is calculated by taking the average over all correlated r1 and r2 positions for binary collisions
within overall Au + Au collisions in each Au + Au cen-trality class.
The results of these calculations matched to the exper-imentally measured Au + Au centrality bins are shown in Figure 13. It is notable that the midrapidity cold nuclear
matter extrapolation agrees within the uncertainty of the experimental data at midrapidity. Thus, it is not possible within the current constraints to determine the potential extent of hot nuclear matter effects. This conclusion is qualitatively similar to that reached from the previous model calculations as shown in Figure 11. However, at forward rapidity, this method projects a somewhat larger range of possible cold nuclear matter effects than the pre-vious models.
Neither the predictions of cold nuclear matter effects in heavy ion collisions based on fitting of the d + Au data with theoretical curves (Figures 10 and 11), nor those ob-tained directly from the d + Au data points (Figure 13) are well enough constrained to permit quantitative con-clusions about additional hot nuclear matter effects.
coll N 5 10 15 20 25 30 3 10 4 10 d-Au 0-20% Central d-Au 20-40% Central d-Au 40-60% Central d-Au 60-88% Central
Au Radial Impact Positions (fm)
0 1 2 3 4 5 6 7 8 9
4
10
FIG. 12: Results from a Glauber Model Monte Carlo includ-ing simulation of the d+Au centrality selection and triggerinclud-ing based on the PHENIX BBC. The top panel shows the distri-bution of the number of binary collisions for events in each of the four centrality classes 0-20%, 20-40%, 40-60%, 60-88%. The distribution for radial impact points in the gold nucleus of binary collisions is shown in the lower panel.
Number of Participants Au+Au
0 50 100 150 200 250 300 350 400 AA R 0 0.2 0.4 0.6 0.8 1 12%) ± global
PHENIX Au+Au Data |y|<0.35 (syst
Data Driven Projection of Cold Nuclear Matter Effect
Number of Participants Au+Au
0 50 100 150 200 250 300 350 400 AA R 0 0.2 0.4 0.6 0.8 1 7%) ± global
PHENIX Au+Au Data 1.2<|y|<2.2 (syst
Data Driven Projection of Cold Nuclear Matter Effect
FIG. 13: Predictions of the data driven method [18] con-strained by the RdAu as a function of collision centrality for
the Au+Au RAAfor midrapidity (top) and at forward
rapid-ity (bottom).
VII. CONCLUSIONS
A new analysis of J/ψ production in d+Au collisions at √s
NN= 200 GeV has been presented using the PHENIX
2003 d+Au data set. Cuts and analysis techniques that are consistent with the previously published results for p + p, Cu + Cu and Au + Au collisions at the same en-ergy [1, 2, 5] are used. The new analysis also benefits from the significantly larger p+p data set from Run-5.
A statistical comparison of these new results to theo-retical calculations has been performed with a detailed handling of the experimental uncertainties to estimate a J/ψ (or precursor) breakup cross section in cold nuclear matter on top of models for the modifications of the par-ton distribution functions in the nucleus. Using EKS
(NDSG) shadowing, a breakup cross section of 2.8+1.7−1.4
(2.2+1.6−1.5) mb is obtained. These breakup cross-section
values are consistent within large uncertainties with the 4.2 ± 0.5 mb determined at lower energies at the CERN-SPS [14]. The measured values are then used to predict the expected cold nuclear matter effects on J/ψ produc-tion in Cu + Cu and Au + Au collisions, and these are compared to the measured nuclear modification factors for those systems. These predictions are found to be similar to those from a less model-dependent and more data-driven method based on the variation of the nu-clear modification factor measured in d + Au collisions as a function of both rapidity and centrality [18]. It is notable that the latter method yields a somewhat larger possible suppression in the forward rapidity case. In all cases the large error bars associated with the extrapo-lation prevent making firm quantitative statements on any additional J/ψ suppression in Au + Au collisions be-yond that expected from cold nuclear matter effects. A d + Au data set with much improved statistical precision is needed to both reduce the statistical uncertainties and permit better control over the systematic uncertainties.
Acknowledgments
We thank the staff of the Collider-Accelerator and Physics Departments at Brookhaven National Labora-tory and the staff of the other PHENIX participating institutions for their vital contributions. We also thank Ramona Vogt for useful discussions and for the
calcu-lations used to set the level of the breakup cross sec-tions. We acknowledge support from the Office of Nu-clear Physics in the Office of Science of the Department of Energy, the National Science Foundation, Abilene Chris-tian University Research Council, Research Foundation of SUNY, and Dean of the College of Arts and Sciences, Vanderbilt University (U.S.A), Ministry of Education, Culture, Sports, Science, and Technology and the Japan Society for the Promotion of Science (Japan), Conselho Nacional de Desenvolvimento Cient´ıfico e Tecnol´ogico
and Funda¸c˜ao de Amparo `a Pesquisa do Estado de S˜ao
Paulo (Brazil), Natural Science Foundation of China (People’s Republic of China), Ministry of Education, Youth and Sports (Czech Republic), Centre National
de la Recherche Scientifique, Commissariat `a l’´Energie
Atomique, and Institut National de Physique Nucl´eaire et de Physique des Particules (France), Ministry of
In-dustry, Science and Tekhnologies, Bundesministerium f¨ur
Bildung und Forschung, Deutscher Akademischer Aus-tausch Dienst, and Alexander von Humboldt Stiftung (Germany), Hungarian National Science Fund, OTKA (Hungary), Department of Atomic Energy (India), Israel Science Foundation (Israel), Korea Research Foundation and Korea Science and Engineering Foundation (Korea), Ministry of Education and Science, Rassia Academy of Sciences, Federal Agency of Atomic Energy (Russia), VR and the Wallenberg Foundation (Sweden), the U.S. Civil-ian Research and Development Foundation for the In-dependent States of the Former Soviet Union, the US-Hungarian NSF-OTKA-MTA, and the US-Israel Bina-tional Science Foundation.
[1] A. Adare et al., Phys. Rev. Lett. 98, 232301 (2007). [2] A. Adare et al., Phys. Rev. Lett. 98, 232002 (2007). [3] R. Vogt, Phys. Rev. C71, 054902 (2005).
[4] S. S. Adler et al., Phys. Rev. Lett. 96, 012304 (2006). [5] A. Adare et al., (to be published).
[6] K. Adcox et al., Nucl. Instrum. Meth. A499, 469 (2003). [7] S. N. White, AIP Conf. Proc. 792, 527 (2005).
[8] M. L. Miller, K. Reygers, S. J. Sanders, and P. Steinberg (2007).
[9] A. Spiridonov, hep-ex/0510076.
[10] GEANT 3.2.1 Manual (1994), CERN W5013, URL wwwasdoc.web.cern.ch/wwwasdoc/pdfdir/geant.pdf.
[11] T. Sj¨ostrand et al., J. High Energy Phys. 05, 026 (2006). [12] K. J. Eskola, V. J. Kolhinen, and R. Vogt, Nucl. Phys.
A 696, 729 (2001).
[13] D. deFlorian and R. Sassot, Phys. Rev. D 69, 074028 (2004).
[14] B. Alessandro et al., Euro. Phys. J. C 48, 329 (2006). [15] A. Adare et al., (to be published).
[16] C. Lourenco, Nucl. Phys. A783, 451 (2007).
[17] S. R. Klein and R. Vogt, Phys. Rev. Lett. 91, 142301 (2003).

![FIG. 11: (color online) R AA for Au+Au [1] collisions com- com-pared to a band of theoretical curves for the σ breakup values found to be consistent with the d + Au data as shown in Fig-ure 8](https://thumb-eu.123doks.com/thumbv2/123doknet/14011708.456582/13.918.98.440.83.689/color-online-collisions-theoretical-curves-breakup-values-consistent.webp)
![FIG. 13: Predictions of the data driven method [18] con- con-strained by the R d Au as a function of collision centrality for the Au+Au R AA for midrapidity (top) and at forward rapid-ity (bottom).](https://thumb-eu.123doks.com/thumbv2/123doknet/14011708.456582/14.918.100.410.391.930/predictions-driven-strained-function-collision-centrality-midrapidity-forward.webp)
