HAL Id: insu-01877503
https://hal-insu.archives-ouvertes.fr/insu-01877503
Submitted on 5 Nov 2020
HAL is a multi-disciplinary open access
archive for the deposit and dissemination of
sci-entific research documents, whether they are
pub-lished or not. The documents may come from
teaching and research institutions in France or
abroad, or from public or private research centers.
L’archive ouverte pluridisciplinaire HAL, est
destinée au dépôt et à la diffusion de documents
scientifiques de niveau recherche, publiés ou non,
émanant des établissements d’enseignement et de
recherche français ou étrangers, des laboratoires
publics ou privés.
67P/Churyumov-Gerasimenko measured with the
Rosetta/ROSINA double-focusing mass spectrometer
Isaac Schroeder I, Kathrin Altwegg, Hans Balsiger, Jean-Jacques Berthelier,
Johan de Keyser, Björn Fiethe, Stephen A. Fuselier, Sébastien Gasc, Tamas I.
Gombosi, Martin Rubin, et al.
To cite this version:
Isaac Schroeder I, Kathrin Altwegg, Hans Balsiger, Jean-Jacques Berthelier, Johan de Keyser, et
al.. 16O/18O ratio in water in the coma of comet 67P/Churyumov-Gerasimenko measured with the
Rosetta/ROSINA double-focusing mass spectrometer. Astronomy and Astrophysics - A&A, EDP
Sciences, 2019, 630, A29 (11 p.). �10.1051/0004-6361/201833806�. �insu-01877503�
&
Astrophysics
Special issue
https://doi.org/10.1051/0004-6361/201833806 © ESO 2019
Rosetta mission full comet phase results
16
O/
18
O ratio in water in the coma of comet
67P/Churyumov-Gerasimenko measured with the
Rosetta/ROSINA double-focusing mass spectrometer
Isaac R. H. G. Schroeder I
1, Kathrin Altwegg
1,2, Hans Balsiger
1, Jean-Jacques Berthelier
3,
Johan De Keyser
4, Björn Fiethe
5, Stephen A. Fuselier
6,7, Sébastien Gasc
1, Tamas I. Gombosi
8, Martin Rubin
1,
Thierry Sémon
1, Chia-Yu Tzou
1, Susanne F. Wampfler
2, and Peter Wurz
1,21Physikalisches Institut, University of Bern, Sidlerstrasse 5, 3012 Bern, Switzerland
e-mail: isaac.schroeder@space.unibe.ch
2Center for Space and Habitability, University of Bern, Gesellschaftsstrasse 6, 3012 Bern, Switzerland 3LATMOS, 4 Avenue de Neptune, 94100 Saint-Maur, France
4Royal Belgian Institute for Space Aeronomy (BIRA-IASB), Ringlaan 3, 1180 Brussels, Belgium 5Institute of Computer and Network Engineering (IDA), TU Braunschweig, Hans-Sommer-Straße 66,
38106 Braunschweig, Germany
6Space Science Division, Southwest Research Institute, 6220 Culebra Road, San Antonio, TX 78228, USA 7Physics and Astronomy Department, University of Texas at San Antonio, San Antonio, TX 78249, USA
8Department of Atmospheric, Oceanic and Space Sciences, University of Michigan, 2455 Hayward, Ann Arbor, MI 48109, USA
Received 9 July 2018 / Accepted 30 August 2018
ABSTRACT
The European Space Agency spacecraft Rosetta accompanied the Jupiter-family comet 67P/Churyumov-Gerasimenko for over 2 yr along its trajectory through the inner solar system. Between 2014 and 2016, it performed almost continuous in situ measurements of the comet’s gaseous atmosphere in close proximity to its nucleus. In this study, the 16O/18O ratio of H2O in the coma of
67P/Churyumov-Gerasimenko, as measured by the ROSINA DFMS mass spectrometer onboard Rosetta, was determined from the ratio of H216O/H218O and16OH/18OH. The value of 445 ± 35 represents an ∼11% enrichment of18O compared with the terrestrial ratio
of 498.7 ± 0.1. This cometary value is consistent with the comet containing primordial water, in accordance with leading self-shielding models. These models predict primordial water to be between 5 and 20% enriched in heavier oxygen isotopes compared to terrestrial water.
Key words. comets: general – comets: individual: 67P/Churyumov-Gerasimenko
1. Introduction
Comets are widely considered to contain some of the most pristine material in the solar system (Wyckoff 1991). The degree of isotopic fractionation, that is, the enrichment or depletion of an isotope in a molecule relative to its initial abundance, observed in a comet is sensitive to the environmental conditions at the time of the comet’s formation (Hässig et al. 2017). There-fore, measurements of isotopic abundances in cometary ices reveal important information regarding the composition, density, and temperature of the early solar system. These measurements also indicate the amount of radiation that was present during the accretion of solid bodies, when the molecules were being formed during the chemical evolution of the presolar cloud to the protosolar nebula and protoplanetary disk. They are there-fore vital to understanding and reconstructing the history and origins of material in the solar system, which was one of the major scientific goals of the Rosetta mission (Glassmeier et al. 2007). Oxygen is of particular interest to us because large hetero-geneities in its relative isotopic abundance in meteoritic samples have frustrated efforts to determine the primordial composi-tion of the solar system, and a lack of correlacomposi-tion with presolar
components suggests that isotope-selective chemistry occurred within the protosolar nebula (McKeegan et al. 2011).
The European Space Agency (ESA) spacecraft Rosetta accompanied the Jupiter-family comet (JFC) designated 67P/Churyumov-Gerasimenko (hereafter 67P) for a period of 2 yr. Between August 2014 and September 2016, the spacecraft studied its coma and nucleus in great detail during its orbit around the Sun from its approach at around 3.5 AU to its perihelion passage and then out to 3.5 AU. The Rosetta Orbiter Spectrometer for Ion and Neutral Analysis (ROSINA) mass spec-trometers onboard, designed to measure isotopic abundances (Balsiger et al. 2007), continuously analyzed the volatile species in the cometary coma for almost the entirety of this duration.
With its high mass resolution, dynamic range, and sensitivity, ROSINA was able to detect rare species such as HD18O alongside their most abundant isotopologs (Hässig et al.
2013), and measure isotopic ratios in water such as D/H and
16O/18O independently. It was already able to measure the
deuterium-to-hydrogen (D/H) ratio in cometary water very early on in its mission, finding a D/H ratio of more than three times the terrestrial value. This vital result revealed much about the comet’s origin, the water formation temperature, and the
conditions under which the early solar system formed (Altwegg et al. 2017). It also showed that JFCs have a wide range of D/H ratios and was thus an important measurement for the discussion of the origins of terrestrial oceans.
Oxygen is the most abundant element not only in the solid phases that formed early in the development of the solar sys-tem (Yurimoto & Kuramoto 2004), but also in rocky materials in general, because its cosmic abundances and the affinity between O and Si are high. The 16O/18O ratio of CO2 in the coma of
comet 67P was previously measured by Hässig et al. (2017) with Rosetta’s ROSINA instrument package Double Focusing Mass Spectrometer (DFMS) and found to be 494 ± 8, which is consistent within 1σ uncertainty with the terrestrial value of 498.7 ± 0.1 calculated byBaertschi(1976). In contrast, the solar wind has a16O/18O ratio of 530 ± 2 (McKeegan et al. 2011). A
more detailed list of measurements for other comets is provided in Fig.3.
Here, we report on the results of direct in situ measurements of the16O/18O ratio in H2O from the coma of 67P, performed
with the Rosetta/ROSINA DFMS.
2. Instrumentation and method
The ROSINA DFMS is a double-focusing mass spectrometer with a high mass resolution of m/∆m ∼ 3000 at 1% peak height (Balsiger et al. 2007). Neutral gas entering the DFMS is ion-ized via electron impact ionization with an electron energy of 45 eV, which causes a certain percentage of parent molecules to split into charged fragments (fragmentation patterns are species-specific, unique to each spectrometer, and dependent on the electron energy). The ions and fragments then pass through an electrostatic analyzer and permanent magnet and are filtered by their mass-to-charge ratio before reaching the detectors.
The primary detector, MCP/LEDA, is a position-sensitive imaging detector comprised of two micro-channel plates (MCPs) in a chevron configuration. When ions impinge on the MCPs, they release a cascade of secondary electrons, thereby amplifying their signal, which is then detected by two independent rows (Rows A and B) of 512 anodes on a linear electron detector array (LEDA). Row B serves as a redundancy to Row A. The voltage applied between the front and back of the MCP can be adjusted to vary the gain (degree of amplification) of the MCP detector. Measurements are not all obtained at the same detector gain: there are 16 predefined voltage settings referred to as gain steps (GS1 to GS16), and the DFMS measures by scanning over a range of masses one at a time, automatically selecting the gain step for each mass that maximizes the signal without causing saturation.
The gain corresponding to a certain gain step changes over time because the detector ages. This time-dependency necessitated dividing the mission into intervals and using time-interpolation between tables of different gain correction factors that were separately derived for each interval.
An additional flat-field correction was also required to account for the uneven degradation of the 512 LEDA anodes (pixels) with use because those in the center were used more fre-quently and were consefre-quently more degraded. This was referred to as the pixel gain to distinguish it from the (overall) gain. Spe-cial modes of the DFMS were dedicated to the measurement of pixel gain; they measured water at a fixed gain step by slowly shifting the center of the peak from one end of the array to the other so as to compare the amplitude of the signal detected by each of the pixels. Campaigns to measure the pixel gain were
conducted at regular intervals, and linear time-interpolation was applied to derive the correction factors at other times.
As a result of spacecraft outgassing, Rosetta had a neu-tral gaseous background (primarily water with traces of organic material, hydrazine from thruster exhaust and fluorine from vacuum grease). This background had a permanent particle den-sity of ∼106 cm-3 in the immediate vicinity of the spacecraft,
even prior to its rendezvous with the comet (Altwegg et al. 2015). Even after 10 yr of traveling through the vacuum of space while en route to 67P, the gaseous background from Rosetta could still be measured and characterized with ROSINA (Schläppi et al. 2010), demonstrating its ability to analyze even trace amounts of gases. The isotopic composition of the water outgassed from the Rosetta spacecraft itself was consistent, as expected, with terrestrial values (Hässig et al. 2013), and it did not vary with the time of degassing, indicating negligible isotope frac-tionation. Exploiting this fact, we were able to use the fragmentation pattern of outgassed water, from pre-encounter measurements acquired during a sniff test on 19 June 2014, as a reference for correcting subsequent measurements.
The DFMS is not equally sensitive to all masses. It has different relative sensitivities for each mass, which apparently changed as it aged. Abrupt changes, such as one observed on 3 June 2015, can also be caused by damage. By comparing iso-topic ratios measured during the sniff test with their expected (terrestrial) values, corrections for changes in relative sensitiv-ity were derived. These were then used to correct the measured fragmentation pattern of water.
An accurate determination of how water fragments in the DFMS is important for the calculation of the gain. The ratio of
18OH/H218O from the sniff test was 0.33 ± 0.04. We chose to
compare the amount of H218O detected with that of the18OH
produced by its fragmentation because (unlike H216O and16OH)
they were often both measured on the same gain step (GS16), and their ratio in such instances would not be affected even if the gain factors were incorrect. However, this fragmentation pat-tern should be the same for16OH/H
216O, in addition to staying
constant throughout the mission. Thus, any differences between later measurements and this value reflect changes in the gain and were accordingly used to derive corrections to it. Further details regarding the data analysis and corrections we applied may be found in the appendix.
By incorporating all these corrections to the gain, pixel gain, and relative sensitivity in our model of the instrument aging, we calculated the16O/18O ratio of H2O by taking the average ratio
of H216O/H218O and 16OH/18OH over both rows of the DFMS
MCP/LEDA detector between 1 October 2014 and 5 September 2016. This period spans almost the entirety of the duration in which Rosetta was in close proximity to comet 67P.
3. Results
We found an average16O/18O ratio of H
2O in the coma of comet
67P of 445 ± 35. This result was based on 3820 measurements of H216O/H218O and 16OH/18OH, which were in close
agree-ment with each other. The measureagree-ments were made from 1 October 2014 to 5 September 2016 with both rows (A and B) of the MCP/LEDA. That both ratios were consistent with each other despite having been measured on different gain steps shows that the detector aging model is accurate.
The 16O/17O ratio, however, could not be estimated,
unfortunately, as the signal from H217O was too low in addition
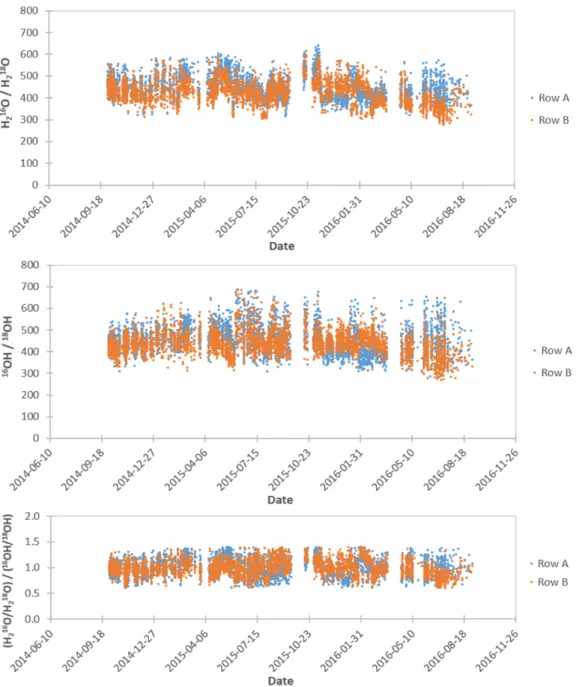
Fig. 1.H216O/H218O ratio (top),16OH/18OH ratio (middle), andH2
16O/H218O
16OH/18OH ratio (bottom) over the course of the mission. See Fig.A.4for an idea
of the typical error bars on a single isotopic ratio measurement.
The 3820 individual values of the isotopic ratio measured over the course of the main part of the Rosetta mission are shown in Fig.1 for the H216O/H218O and 16OH/18OH ratios. Despite
the large spread in the data, no obvious change over time could be discerned from the isotopic ratios. Here, we also made the assumption that the detected OH is predominantly a product of H2O fragmentation. This assumption is justified on the grounds
that contributions from other possible parent molecules (e.g. alcohols) are negligible, as they are several orders of mag-nitude less abundant than H2O and their fragmentation only
produces OH at low to intermediate levels (2% for methanol, 12% for ethanol), which we established in our calibration experiments.
The individual measurements from Fig.1are also shown in Fig.2in the form of histograms depicting the range of measured values.
Many factors contributed to the large spread seen in the distribution of data points over the course of the mission and the consequently large uncertainties in the isotopic ratios. As the
DFMS measures each mass separately, factors such as spacecraft motion and measurement time affected the data analysis. Also affecting the analysis were instrument effects arising from difficulties in correcting for the pixel-dependent degradation of the MCP/LEDA detector (the pixel gain correction) and changes in the gain of the detector over time. The uncertainties in the gain (6%) and pixel gain (5%) were the dominant sources of error, while the statistical uncertainty is roughly two to three orders of magnitude smaller because of averaging over a large number of measurements.
4. Discussion
The value of 445 ± 35 found for the16O/18O ratio of cometary
H2O from the coma of 67P represents an enrichment of
approx-imately 11% of 18O compared with the terrestrial value of
498.7 ± 0.1 measured by Baertschi (1976). However, the two measurements are also statistically compatible within a 1.5 σ uncertainty. The present value differs from an earlier result,
Fig. 2. Histograms of individual measurements. Top: H216O/H218O.
Bottom:16OH/18OH.
556 ± 62, reported byAltwegg et al.(2015) because of the recent development of a more sophisticated detector aging model.
In contrast, the 16O/18O ratio from CO
2 measurements of
the coma of 67P, as previously performed by Hässig et al.
(2017), was 494 ± 8, which is consistent with the terrestrial value within the uncertainties. The solar wind measurement by
McKeegan et al.(2011), on the other hand, had a16O/18O ratio
of 530 ± 2.
A comparison of the16O/18O ratio of H
2O from the coma
of comet 67P with the16O/18O ratios from several other sources
and results from preceding publications (Bockelée-Morvan et al. 2015) is provided in Fig. 3. That the isotopic fractionation of CO2should differ from that of water is unsurprising, since CO2
freezes out at 81 K, a lower temperature than water (160 K) but higher than CO (29 K), in the solar nebula (Yurimoto & Kuramoto 2004; Marboeuf et al. 2014) and is also chemi-cally derived from CO, which the self-shielding phenomenon discussed below fractionates differently than water.
According to leading self-shielding models (Lyons & Young 2005; Young 2007; Lee et al. 2008), primordial water is pre-dicted to be enriched in18O by 5–20% compared to terrestrial
water, whereas the solar wind is expected to be depleted in18O
by ∼5% (Yurimoto & Kuramoto 2004;Sakamoto et al. 2007). The considerable isotopic fractionation observed for oxygen and carbon in molecular clouds is thought to be the result of self-shielding in the ultraviolet photodissociation of CO (Bally & Langer 1982;van Dishoeck & Black 1988). The same effect is expected to have occurred during the T-Tauri stage in the evolu-tion of our Sun (Clayton 2002), where the proto-sun provided a strong source of ultraviolet radiation and the gas in the disk was comprised primarily of H2, CO, and N2.
Self-shielding of CO in the solar nebula involves the isotope-selective photodissociation of CO, which occurs at far-ultraviolet (FUV) wavelengths between 91.2 and 110 nm (Warin et al. 1996;
Lyons & Young 2005). CO can transition (prior to dissociation) to a bound excited state with a lifetime long enough to exhibit vibrational and rotational structure. The resulting absorption
spectrum has many narrow absorption lines that are shifted when the molecular mass is altered as a result of isotopic substi-tution. Additionally, the absorption spectra of the various CO isotopologs do not overlap significantly (Lyons & Young 2005). Thus, when a cloud is irradiated by an ultraviolet continuum, the wavelengths corresponding to the most abundant isotopolog,
12C16O, are more rapidly attenuated (Clayton 2002) by the
sur-face layer of the cloud than those for the less abundant12C18O.
The latter thus penetrate deeper into the cloud, enabling the dis-sociation of12C18O to continue even deep in the cloud interior.
The dissociation of 12C16O in the interior is meanwhile
sup-pressed as a result of the lack of UV photons with its requisite wavelengths. This produces a zone of18O-enriched atomic
oxy-gen (CO dissociates into C and O) and leaves the remaining undissociated CO correspondingly18O-depleted. We were
unfor-tunately unable to test this prediction with direct measurements of12C18O as the resolving power of the DFMS was insufficient to
distinguish it from the more abundant14N16O (Rubin et al. 2017).
However, the protostar VV CrA in Fig.3does indeed conform to this expectation, though the protostar Reipurth 50 does not. The reason for this seeming discrepancy is that the protoplane-tary disk was probed in the case of VV CrA, whereas it was the protostellar envelope that was being probed by the observed CO absorption lines for Reipurth 50 (Smith et al. 2009).
The dominant oxygen-bearing species of ice, H2O (Langer
et al. 2000;Yurimoto & Kuramoto 2004), nucleates and grows on silicate dust grains via surface hydrogenation reactions between atomic H and O (Greenberg 1998; Ruffle & Herbst 2001). Its oxygen isotopic composition should therefore be sim-ilar to that of the aforementioned gaseous18O-enriched atomic
oxygen (Yurimoto & Kuramoto 2002). The formation timescale for H2O is about 105yr (Bergin et al. 2000). During this time,
most of the atomic oxygen reacts to form H2O ice, thus
enrich-ing the solid ice in18O while simultaneously depleting the gas
of18O and also leaving CO as the most dominant gas species. In
the case of CO2, because it is produced via the reaction of CO
with atomic O, its isotopic composition is between that of the
18O-enriched water and the18O-depleted CO.
The isotopic fractionation of oxygen is subsequently preserved even if CO eventually becomes frozen onto the grains. This is because the isotopic exchange of oxygen between H2O
and CO ices is inefficient at low temperatures, according to
Yurimoto & Kuramoto(2004). Their model further predicts that a direct measurement of cometary ices would yield a compo-sition 5–20% enriched in 18O compared to terrestrial water.
Our result, a16O/18O ratio of 445 ± 35 for cometary H 2O from
67P’s coma (an enrichment of 11%), falls within this range and supports the prediction.
5. Conclusions
From measurements of H216O/H218O and16OH/18OH obtained
with the ROSINA DFMS onboard the Rosetta spacecraft, and with our improved detector aging model, a 16O/18O ratio of
445 ± 35 was found for H2O in the coma of comet 67P. The
evolution of our detector aging model to incorporate more sophisticated corrections to the gain of the detector is respon-sible for the differences between our result and an earlier report (Altwegg et al. 2015). Our result, an enrichment of roughly 11% of 18O as compared with the 16O/18O ratio of 498.7 ± 0.1 for
terrestrial water (Baertschi 1976), is within the 5–20% range that leading self-shielding models (Yurimoto & Kuramoto 2004;
Sakamoto et al. 2007) predict for the composition of primordial water.
Fig. 3.Comparison of16O/18O ratios from various sources. References: (1)Hässig et al.(2017); (2)Baertschi(1976); (3)McKeegan et al.(2011);
(4)Eberhardt et al.(1995);Balsiger et al.(1995); (5)Ogliore et al.(2015); (6)Hutsemékers et al.(2008); (7)Decock et al.(2014); (8)Biver et al. (2016); (9)Iwagami et al.(2015); (10)Webster et al.(2013); (11)Serigano et al.(2016); (12)Smith et al.(2009); (13)Wilson(1999).
Fig. 4.Sample DFMS mass spectrum from 2016-03-03 T 03:45 illustrating the use of manual peak-fitting with equal-width Gaussians to separate the H217O peak from that of HDO. Dotted line: mass spectrum, green lines: fitted Gaussians, red line: sum of fitted Gaussians.
Acknowledgements.ROSINA would not have produced such outstanding results without the work of the many engineers, technicians, and scientists involved in the mission, in the Rosetta spacecraft, and in the ROSINA instrument team over the last 20 years, whose contributions are gratefully acknowledged. Rosetta is a European Space Agency (ESA) mission with contributions from its member states and NASA. We acknowledge herewith the work of the entire ESA Rosetta team. Work at the University of Bern was funded by the Canton of Bern, the Swiss National Science Foundation and the ESA PRODEX (PROgramme de Développement d’Expériences scientifiques) programme. Work at the South-west Research Institute was supported by subcontract #1496541 from the Jet Propulsion Laboratory (JPL). Work at the Royal Belgian Institute for Space Aeronomy (BIRA-IASB) was supported by the Belgian Science Policy Office via PRODEX/ROSINA PRODEX Experiment Arrangement 90020. Work at the University of Michigan was funded by NASA under contract JPL-1266313.
Note added in proof.Unlike the16O/18O ratio, the16O/17O ratio of H2O in the coma of 67P could not be directly measured. This
was because the signal from H217O was often too low in addition
to being buried in the shoulder of the much larger HDO peak. Thus, to estimate the 16O/17O ratio, it was first necessary
to select spectra with sufficiently strong signals to facilitate the distinction of H217O from HDO by manual peak-fitting. Such
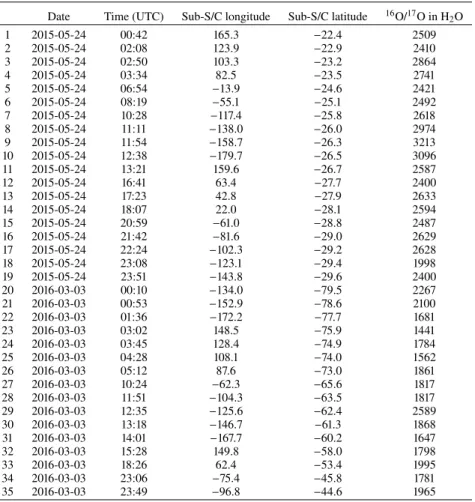
spectra were rare, but 35 were eventually identified as suitable (Table1). These had been acquired on dates close to the inbound and outbound equinoxes of 67P in May 2015 and March 2016, respectively.
Table 1. Analysed spectra.
Date Time (UTC) Sub-S/C longitude Sub-S/C latitude 16O/17O in H 2O 1 2015-05-24 00:42 165.3 −22.4 2509 2 2015-05-24 02:08 123.9 −22.9 2410 3 2015-05-24 02:50 103.3 −23.2 2864 4 2015-05-24 03:34 82.5 −23.5 2741 5 2015-05-24 06:54 −13.9 −24.6 2421 6 2015-05-24 08:19 −55.1 −25.1 2492 7 2015-05-24 10:28 −117.4 −25.8 2618 8 2015-05-24 11:11 −138.0 −26.0 2974 9 2015-05-24 11:54 −158.7 −26.3 3213 10 2015-05-24 12:38 −179.7 −26.5 3096 11 2015-05-24 13:21 159.6 −26.7 2587 12 2015-05-24 16:41 63.4 −27.7 2400 13 2015-05-24 17:23 42.8 −27.9 2633 14 2015-05-24 18:07 22.0 −28.1 2594 15 2015-05-24 20:59 −61.0 −28.8 2487 16 2015-05-24 21:42 −81.6 −29.0 2629 17 2015-05-24 22:24 −102.3 −29.2 2628 18 2015-05-24 23:08 −123.1 −29.4 1998 19 2015-05-24 23:51 −143.8 −29.6 2400 20 2016-03-03 00:10 −134.0 −79.5 2267 21 2016-03-03 00:53 −152.9 −78.6 2100 22 2016-03-03 01:36 −172.2 −77.7 1681 23 2016-03-03 03:02 148.5 −75.9 1441 24 2016-03-03 03:45 128.4 −74.9 1784 25 2016-03-03 04:28 108.1 −74.0 1562 26 2016-03-03 05:12 87.6 −73.0 1861 27 2016-03-03 10:24 −62.3 −65.6 1817 28 2016-03-03 11:51 −104.3 −63.5 1817 29 2016-03-03 12:35 −125.6 −62.4 2589 30 2016-03-03 13:18 −146.7 −61.3 1868 31 2016-03-03 14:01 −167.7 −60.2 1647 32 2016-03-03 15:28 149.8 −58.0 1798 33 2016-03-03 18:26 62.4 −53.4 1995 34 2016-03-03 23:06 −75.4 −45.8 1781 35 2016-03-03 23:49 −96.8 −44.6 1965
The same gain and pixel gain corrections as were applied in the measurement of the 16O/18O ratio were equally
appli-cable to these 35 spectra. However, in addition to that, it was also necessary to separate the H217O peak from that of HDO
by manually fitting these peaks with equal-width Gaussians, as exemplified in Fig.4. Changes in relative sensitivity between m/z 18 and 19 u/e were accounted for by comparing the average D/H ratio from HDO/H2O in each period with the expected (5.3 ±
0.7) × 10−4(Altwegg et al. 2015,2017) and scaling the spectra
accordingly.
The average16O/17O ratio thus estimated from H
216O/H217O
was 2182 ± 170. This represents an approximately 17% enrich-ment (2.6 σ) of 17O compared with the terrestrial value of
2632 ± 69 (Berglund & Wieser 2011).
References
Altwegg, K., Balsiger, H., Bar-Nun, A., et al. 2015,Science, 347, 1261952 Altwegg, K., Balsiger, H., Berthelier, J. J., et al. 2017,Phil. Trans. R. Soc.
London, Ser. A, 375, 20160253
Baertschi, P. 1976,Earth Planet. Sci. Lett., 31, 341 Bally, J., & Langer, W. D. 1982,ApJ, 255, 143
Balsiger, H., Altwegg, K., & Geiss, J. 1995,J. Geophys. Res., 100, 5827 Balsiger, H., Altwegg, K., Bochsler, P., et al. 2007,Space Sci. Rev., 128, 745 Bergin, E. A., Melnick, G. J., Stauffer, J. R., et al. 2000,ApJ, 539, L129 Berglund, M., & Wieser, M. 2011,Pure Appl. Chem., 83, 397
Biver, N., Moreno, R., Bockelée-Morvan, D., et al. 2016,A&A, 589, A78 Bockelée-Morvan, D., Calmonte, U., Charnley, S., et al. 2015,Space Sci. Rev.,
197, 47
Clayton, R. N. 2002,Nature, 415, 860
Decock, A., Jehin, E., Rousselot, P., et al. 2014,International Comet Workshop De Keyser, J., Dhooghe, F., Gibbons, A., et al. 2016,EGU General Assembly,
18, EPSC2016-2756
Eberhardt, P., Reber, M., Krankowsky, D., & Hodges, R. R. 1995,A&A, 302, 301
Gasc, S., Altwegg, K., Fiethe, B., et al. 2017,Planet. Space Sci., 135, 64 Glassmeier, K.-H., Boehnhardt, H., Koschny, D., Kührt, E., & Richter, I. 2007,
Space Sci. Rev., 128, 1
Greenberg, J. M. 1998,A&A, 330, 375
Hässig, M., Altwegg, K., Balsiger, H., et al. 2013,Planet. Space Sci., 84, 148 Hässig, M., Altwegg, K., Balsiger, H., et al. 2017,A&A, 605, A50
Hutsemékers, D., Manfroid, J., Jehin, E., Zucconi, J.-M., & Arpigny, C. 2008, A&A, 490, L31
Iwagami, N., Hashimoto, G. L., Ohtsuki, S., Takagi, S., & Robert, S. 2015, Planet. Space Sci., 113, 292
Langer, W. D., van Dishoeck, E. F., Bergin, E. A., et al. 2000,Protostars and
Planets IV(Tucson: University of Arizona Press),29
Lee, J.-E., Bergin, E. A., & Lyons, J. R. 2008,Meteor. Planet. Sci., 43, 1351 Lyons, J. R., & Young, E. D. 2005,Nature, 435, 317
Marboeuf, U., Thiabaud, A., Alibert, Y., Cabral, N., & Benz, W. 2014,A&A, 570, A35
McKeegan, K. D., Kallio, A. P. A., Heber, V. S., et al. 2011,Science, 332, 1528 Ogliore, R. C., Nagashima, K., Huss, G. R., et al. 2015, Geochim.
Cos-mochim. Acta, 166, 74
Rubin, M., Altwegg, K., Balsiger, H., et al. 2017,A&A, 601, A123 Ruffle, D. P., & Herbst, E. 2001,MNRAS, 324, 1054
Sakamoto, N., Seto, Y., Itoh, S., et al. 2007,Science, 317, 231
Schläppi, B., Altwegg, K., Balsiger, H., et al. 2010,J. Geophys. Res. Space Phys., 115, A12313
Serigano, J., Nixon, C. A., Cordiner, M. A., et al. 2016,ApJ, 821, L8
Smith, R. L., Pontoppidan, K. M., Young, E. D., Morris, M. R., & van Dishoeck E. F. 2009,ApJ, 701, 163
van Dishoeck, E. F., & Black, J. H. 1988,ApJ, 334, 771 Warin, S., Benayoun, J. J., & Viala, Y. P. 1996,A&A, 308, 535
Webster, C. R., Mahaffy, P. R., Flesch, G. J., et al. 2013,Science, 341, 260 Wilson, T. L. 1999,Rep. Prog. Phys., 62, 143
Wyckoff, S. 1991,Earth Sci. Rev., 30, 125 Young, E. D. 2007,Earth Planet. Sci. Lett., 262, 468
Yurimoto, H., & Kuramoto, K. 2002,Meteor. Planet. Sci. Suppl., 37, A153 Yurimoto, H., & Kuramoto, K. 2004,Science, 305, 1763
Appendix A: Supplementary material
Fig. A.1. Particle density measured by COPS and heliocentric and cometocentric distance of the Rosetta spacecraft during its main mission duration.
The Cometary Pressure Sensor (COPS) onboard the Rosetta spacecraft (Balsiger et al. 2007) measured the ambient particle density in the surrounding cometary coma that engulfed Rosetta as it accompanied comet 67P. The particle density measured by COPS, as well as the distance of Rosetta from comet 67P and its distance from the sun, are shown plotted over the main duration of the mission in Fig.A.1. The figure shows that Rosetta gener-ally remained within a few hundred kilometers of the comet after rendezvousing with it at around 3.5 AU from the Sun, accompa-nying it to its perihelion at 1.24 AU and then back out again to 3.5 AU away from the Sun. The ambient particle density during this time was, according to COPS, typically in the range between 107and 108cm-3.
To give the reader an idea of what typical ROSINA DFMS mass spectra look like, a sample of DFMS mass spectra measured in 2014-10-20 is provided in Fig. A.2 for mass-to-charge ratios of 17 to 20 u/e. Minor deformation is seen in the shape of the peaks at m/z 17 u/e as a result of a slight instability in an electric potential in the electrostatic analyzer, the details and remedy for which were covered by De Keyser et al.(2016).
As previously mentioned, several additional layers of correc-tions for changes in relative sensitivities, gain and pixel gain over time had to be applied to the DFMS data. To illustrate this, the uncorrected measurements of the fragmentation of water (the
18OH/H218O ratio) are shown plotted against the time at which
they were measured in Fig. A.3, using the original gain fac-tors based on pre-flight calibrations. The fragmentation pattern
of water should be constant, since the electron energy used by the DFMS for electron impact ionization was always 45 eV. It is clear from the figure, however, that there are sudden changes, the most abrupt being the one on 3 June 2015, which was likely the result of damage. Although the nature and origin of the dam-age remain under debate, it is clear that it caused a change in instrument sensitivity.
Thus, to determine what the actual fragmentation pattern of water was, data from a sniff test conducted on 19 June 2014 prior to Rosetta’s rendezvous with 67P had to be used. Because the water measured during this period was terrestrial background outgassed from Rosetta itself (Schläppi et al. 2010), its isotopic composition, as previously demonstrated byHässig et al.(2013), was the well-known terrestrial one, a fact that we exploited. The
16OH/18OH and H
216O/H218O ratios measured during the sniff
test are shown in Fig.A.4. The mean16OH /18OH from the sniff
test was 450 ± 22 and 445 ± 22 for Rows A and B, respectively, while the mean H216O/H218O was 470 ± 36 and 487 ± 38 for
Rows A and B, respectively. By comparing this with the expected
16O/18O of 498.7 ± 0.1 (Baertschi 1976) of terrestrial water, we
derived the following relative sensitivity corrections as given in TableA.1.
The uncorrected mean 18OH/H
218O from the sniff test was
0.461 ± 0.023 and 0.465 ± 0.023 for Rows A and B, respec-tively. We chose to use18OH/H
218O because, unlike16OH and
H216O, both 18OH and H218O were always measured on the
same gain step (GS16) and their ratio would thus not be affected even if the gain (amplification) factors used were incorrect.
Fig. A.2. Sample DFMS mass spectra (from 2014-10-20) for m/z 17–20 u/e.
Table A.1. Sensitivity relative to m/z 17 u/e.
m/z (u/e) Species Row A Row B
17 16OH 1 1
18 H216O 0.753 ± 0.070 0.761 ± 0.071
19 18OH 1.108 ± 0.055 1.119 ± 0.056
20 H218O 0.799 ± 0.097 0.779 ± 0.094
Table A.2. Scaling factors for fragmentation of water.
Interval Row A Row B date < 2014-12-29 1.076 0.994 2014-12-29 ≤ date < 2015-06-03 0.957 0.849 2015-06-03 ≤ date < 2016-01-27 1.166 1.098 2016-01-27 ≤ date < 2016-04-26 1.198 1.332 2016-04-26 ≤ date 1.159 1.237
Applying the relative sensitivity corrections from TableA.1to the fragmentation pattern from the sniff test yields a corrected
18OH/H
218O of 0.33 ± 0.04. Having thus accurately determined
the correct fragmentation pattern of water from the sniff test, we then proceeded to use it as a reference with which to derive corrections to account for subsequent changes in the relative sensitivities and gain that were caused by the aging of the detector.
By comparing the fragmentation of water in Fig. A.3with the expected value of 0.33 ± 0.04, the following (multiplicative) correction factors, as presented in Table A.2, were derived to scale each approximately half-year interval to the correct value.
Finally, to determine the gain factors for each period, the
16OH/H
216O ratio was used. Unlike18OH and H218O,16OH and
H216O were almost always measured on different gain steps and
could therefore be used to compare the varying differences in the gain corresponding to different gain steps. After application of the scaling factors from TableA.2to account for sensitivity changes over time, any remaining deviation of 16OH / H
216O
from its expected value of 0.33 ± 0.04 would be due to changes in the gain. In this way, the gain factors, as presented in TableA.3, could be derived from the fragmentation pattern of water.
For our intended purposes, only the ratio between gain steps is important, since we used the DFMS to derive only the relative abundances of volatiles in the cometary coma. To derive total abundances, the relative abundances were then scaled such that the total particle density matched the total density measured by COPS, in the manner pioneered byGasc et al.(2017). Thus, for the derivation of the gain factors shown in TableA.3, GS16 was chosen as the starting point and the corrections to the gain for the other gain steps were derived relative to GS16. Although several of the lower gain steps in certain intervals could not be corrected for changes over time due to a lack of data and were thus forced to retain their original gain factors, this is not an issue as they were seldom used, if ever. The evident changes in the gain reflect a decrease in the detector amplification of the higher gain steps with respect to the lower ones over time.
Considering that both abrupt and gradual changes were observed over the course of the Rosetta space mission, the cor-rections in TableA.3had to be applied via a combination of step
Fig. A.3.Uncorrected18OH/H218O plotted against time of measurement.
Fig. A.4.16OH/18OH (left) and H
216O/H218O (right) measured during the sniff test on 19 June 2014. Error bars reflect the uncertainties in the gain
(6%) and pixel gain (5%) and the counting error.
functions and linear interpolation over time. Step functions gen-erally worked well for most of the intervals, with the exception of the period from 2016-01-27 to 2016-04-26. For this interval in particular, the median date (2016-03-12) represented the date when the gain factors were as displayed in Table A.3and the gain at any other time in this period was found by interpola-tion between this median date and the start or end of an adjacent interval. The result of this process is shown in Fig.A.5, where the corrected measurements of the fragmentation of water are plotted against the time at which they were measured.
The final correction we shall mention, namely the pixel gain, was actually applied to the space data before the gain. We men-tion it last merely because it was directly measured at regular intervals throughout the mission. It accounts for the uneven degradation of individual pixels on the MCP/LEDA detector of the DFMS caused by uneven usage. To illustrate this, a sample of two pixel gain curves is shown in Fig.A.6. One was measured
early in the mission (2014-07-25) and the other near the end (2016-06-07). Both were measured for GS16 and show the pixel gain factors for each of the 512 individual pixels on Row A of the MCP/LEDA detector. Comparing the two curves, it is clear that the pixels in the center, which were used more frequently, were also the pixels that became the most heavily and quickly degraded over time as a result.
The DFMS had dedicated modes especially designed for the measurement of pixel gain, which were run during frequent cam-paigns conducted solely for that specific purpose. At times in between campaigns, linear interpolation over time was applied to derive appropriate pixel gain factors.
Our detector aging model incorporated all of these changes in relative sensitivity, gain, and pixel gain over time. The accu-rate determination of the isotopic composition of the cometary water of 67P subsequently depended upon the application of this model for the correction of measurements made with the DFMS.
Table A.3. Gain (i.e., amplification) factors. date < 2014-12-29 2014-12-29≤ date < 2015-06-03 2015-06-03 ≤ date < 2016-01-27 2016-01-27 ≤ date < 2016-04-26 2016-04-26 ≤ date Gain
Step Row A Row B Row A Row B Row A Row B Row A Row B Row A Row B 1 6.93 1.71 6.93 1.71 6.93 1.71 6.93 1.71 6.93 1.71 2 9.48 3.43 9.48 3.43 9.48 3.43 9.48 3.43 9.48 3.43 3 14.6 7.23 14.6 7.23 14.6 7.23 14.6 7.23 14.6 7.23 4 24.9 15.6 24.9 15.6 24.9 15.6 24.9 15.6 24.9 15.6 5 48.5 36.7 48.5 36.7 48.5 36.7 48.5 36.7 48.5 36.7 6 107 93.5 107 93.5 107 93.5 107 93.5 107 93.5 7 248 238 248 238 248 238 248 238 248 238 8 640 652 640 652 640 652 640 652 640 652 9 1650 1730 1650 1730 1650 1730 1650 1730 1650 1730 10 6531 6877 4250 4480 5353 5007 5353 5007 5353 5007 11 13338 14732 19282 29026 14219 15005 13641 13404 15774 14090 12 26718 29130 40549 57124 38760 47575 28851 27257 33457 29165 13 76942 88234 104153 145105 108932 128053 83662 84038 95896 90543 14 197041 230712 246519 319780 237212 269549 206922 217531 225348 223725 15 471664 576457 554645 713801 582421 711066 615175 722174 647929 733282 16 1370000 1680000 1370000 1680000 1370000 1680000 1370000 1680000 1370000 1680000
Notes. GS16 was kept fixed in the correction process.
Fig. A.5.Corrected18OH/H
Fig. A.6.Pixel gain factors for each individual pixel on Row A for GS16. The 2014-07-25 and 2016-06-07 curves were measured early and late in the mission, respectively.