Effect of Engine Operating Parameters and Fuel Characteristics on Diesel Engine Emissions
by
Joseph Acar
B.S., Physics and Computer Science Kent State University, 1999
Submitted to the Department of Mechanical Engineering in Partial Fulfillment of the Requirements for the Degree of
Master of Science in Mechanical Engineering at the
Massachusetts Institute of Technology
February 2005
02005 Massachusetts Institute of Technology
All rights reserved MASSACHUSETTS INSTI E
OF TECHNOLOGY
MAY
5
O
2005
LIBRARIES
Signature of Author:I
Certified by:A
Accepted by:Department of Mechanical Engineering November, 2004
Victor W. Wong Senior Lecturer in Mechanical Engineering Thesis Supervisor
Lallit Anand Professor, Department of Mechanical Engineering Chairman, Department of Graduate Committee
Effect of Engine Operating Parameters and Fuel Characteristics on Diesel Engine Emissions
by
Joseph Acar
Submitted to the Department of Mechanical Engineering on December 14, 2004 in Partial Fufillment of the Requirements for the Degree of Master of Science in
Mechanical Engineering
ABSTRACT
To examine the effects of using synthetic Fischer-Tropsch (FT) diesel fuel in a modern compression ignition engine, experiments were conducted on a MY 2002 Cummins 5.9 L diesel engine outfitted with high pressure, common rail fuel injection, a variable geometry turbo charger, cooled EGR and a fully configurable engine management computer. Additionally, the effect of varied injection timing and EGR rates were studied to examine how the engine can be optimized for FT fuel. The test fuels included two standard diesel fuels, one with 400 PPM sulfur content and the other 15 PPM sulfur. The experimental fuels were Syntroleum Corporation's S-1 fuel, as well as blends of 25% S-1 with a balance of 15 or 400 PPM D2. Tests were conducted with three engine operating conditions: 1682 RPM, 474 kPa BMEP; 2011
RPM, 1000 kPa BMEP; 2011 RPM, 1400 kPa BMEP.
It was found that FT fuel reduced NO, emissions 19% in low load tests, but alone had little effect in higher load tests. FT fuel reduced particulate matter (PM) emissions in almost all test case, on the order of
25 to 75%. Retarding injection timing and increasing EGR both reduce NO, emissions. In the case of
standard fuels, these reduction come at the expense of increased PM. However, FT fuel reduced this effect and allows for more retarded timing and further increased EGR rates to control NO. Blended fuels, containing 25% FT, by volume, and a balance of 15 PPM or 400 PPM fuel, were found to provide most of the benefit of straight FT fuel. The FT/I 5 blend reduced PM 40% and the FT/400 blend reduced PM 60%.
Thesis Advisor: Doctor Victor Wong
Table of Contents
List of Figures
4
List of Tables
5
1
Introduction
6
1.1
Project Background
6
1.2
Prior Project Recommendations
6
2
Experimental Fuels
7
2.1
Number 2 Diesel Fuel
7
2.1.1
Ultra-Low Sulfur Diesel Fuel
7
2.2
Syntroleum Fischer-Trosch Fuel
9
2.3
Fuel Blends
10
3
Experimental Setup
11
3.1
Fuel Flow Measurements
11
3.2
Gaseous Emissions Analyzers
11
3.3
Mini Dilution Tunnel
13
3.4
Gravimetric Particulate Matter Sampling System
13
4
Experimental Test Matrix and Procedure
14
4.1
Experimental Test Matrix
14
4.2
Particulate Matter Sampling Conditions
16
4.2.1
Dilute Exhaust Sampling
16
4.2.2
Raw Exhaust Sampling
16
4.3
Data Collection Procedures
17
5
Results and Discussion
18
5.1
Emissions Characteristics
18
5.1.1
NO, Emissions Trends
18
5.1.1.1
Fuel Effects
19
5.1.1.2
EGR and Timing Effect on NO, Emissions
22
5.1.2
Particulate Matter Emissions Trends
23
5.1.2.1
Fuel Effects
24
5.1.2.2
Engine Operating Parameter Effects
26
5.1.3
Tradeoffs
28
6
Conclusions
30
6.1
Fuel Effects
30
6.2
Operating Parameter Effects
30
6.3
Recommendations
31
List of Figures
Figure 3.1
Figure 5.1
Figure 5.2
Figure 5.3
Figure 5.4
Figure 5.5
Figure 5.6
Figure
Figure
Figure
Figure
Figure
5.7
5.8
5.9
5.10
5.11
Figure 5.12
Figure 5.13
Figure 5.14
Figure 5.15
Emission sampling system schematic
Summary of BSNOx results for several conditions
BSNOx vs timing for the low-speed, low load condition with FT and
15 PPM D2 fuels
Cylinder temperature vs crank angle for two fuels and three timings
Fuel effect on NOx production: BSNOx output for six fuels
BSNOx for four fuels and five timing points
Cylinder temperature vs crank angle for 15 PPM D2 and FT/ 15
blend
BSNOx vs injection timing at high speed, high load
Change in BSNOx output with increased EGR rate for four fuels
Summary of BSNOx results for several conditions
BSPM output for four fuels over five injection timings
Relative reduction in PM emissions for 400 PPM, FT fuel and their
blend
Relative reduction in PM emissions for 15 PPM, FT fuel and their
blend
BSPM vs timing for FT, 15 PPM and 400 PPM fuels
Relative increase in PM output with EGR increase for different fuels
BSPM
-
BSNOx tradeoff for the low speed, mid load data
12
18
19
20
20
21
21
22
23
24
24
25
26
27
28
28
List of Tables
Table 2.1
Fleetline Ultra-Low Sulfur Diesel properties
8
Table 2.2
Syntroleum S-I fuel properties
9
Table 4.1
Test matrix for initial investigation
14
Table 4.2
Test matrix for current work
14
Table 4.3
Definitions or operating conditions and data set labeling convention
15
Chapter 1 Introduction
1.1 Project Background
The goal of this thesis research was to study the fundamental combustion and emissions characteristics of Fischer-Tropsch (FT) diesel fuel compared to a baseline "standard" diesel fuel. This work represents a follow-up study to the research that began in September, 2001, and was later reported in a thesis by Llaniguez (2001-2003). Presented here are the recent results, as well as the changes in experimental setup and test procedure since the previous thesis was written. For complete background on this project, see reference [1], by the author's predecessor.
1.2 Prior Project Recommendations
The recommendations made in [1] were taken as a starting point for this work. Namely, an effort was made to push EGR ratio to its practical limit and expand the test matrix to include higher load test conditions. Unfortunately, it was not possible to increase the EGR rate as much as originally planned in higher load test because doing so increased the intake temperature too much and caused the engine to derate itself as a protective measure.
Chapter 2 Experimental Fuels
2.1 Number 2 Diesel Fuel
To provide a performance and emissions baseline, tests were conducted with two varieties of readily available commercial D2 diesel fuel. This allowed for direct evaluation of the performance and emissions change effected by the experimental fuels. Two fuels, both Fleetline products, were used: Low Sulfur Diesel (400 PPM sulfur) and Ultra-Low Sulfur Diesel (15 PPM sulfur). These fuels were also used
for FT-D2 blends.
2.1.1 Ultra-Low Sulfur Diesel Fuel
Initial work on this project used Fleetline's "Low Sulfur Diesel Fuel." Although this diesel fuel has a fuel-sulfur content of 400 PPM, it still meets the EPA Low-Sulfur Fuel requirement (<500 PPM). This was considered as a worst-case fuel, since it is still widely available today. However, to provide a more realistic baseline for comparison for FT fuel, baseline tests were also performed with Fleetline's
"Ultra-Low Sulfur Diesel Fuel," which meets the 2006 standard of 15 PPM sulfur by volume (Table 2.1).
The purpose of using this fuel is twofold: first, to allow for evaluation of fuel sulfur effect on emissions and second to compare FT fuel to a fuel that will be widely available.
The lower heating value of this fuel was not reported in the product literature, so the value reported for D2 in Syntroleum's literature [2] was taken: QLHV,NO.2 = 129,400 Btu/gal. Converting this to
SI units, and considering the measured fuel density of 845 kg/M3
, yields QLHV,NO.2 = 42.7 MJ/kg.
For combustion analysis of standard diesel fuel, the simplified chemical composition was taken as CH1.8 and the molecular weight 170g/mol [3]. The resulting ideal combustion equation is:
Equation 2.1 12.3CH.8 +17.835 (02 +3.773N2)-+12.3CO2+1.07H 20+17.835 -1 02+ 67.29 N2
Using Equation 2.1, the stoichiometric air/fuel ratio of No. 2 diesel fuel is 14.50:1. This equation was used in the analysis of both the 400 PPM and 15 PPM fuel
FLEETLINEF
SPEC IFICATIONS
PRODUCT
ULTRA LOW SULFUR DIESEL
TEST DESCRIPTION
Cetane Index (Calculated)
Cetane Number
API Gravity at 16*C (60*.F) Density, lbs./gallon
Pour Point, 'C (*F)
Cloud Point, *C (*F)
Flash Point (Pensky-Martens), *C (*F) Heat of Combustion, BTU/gallon
Viscosity, Saybolt, SUS at 38*C (100*F) Viscosity. Kinematic, cSt at 40*C (104*F)
Sulfur, parts per million
Nitrogen, parts per million Corrosion, Copper Strip
Alkali or Miieral Acids
Distillation (Evap.), 'C (*F) 10% Recovered 50% Recovered 90% Recovered End Point Recovery % Residue % Loss %
Carbon Residue, Wt. % (10% Bottoms) Water and Sediment, Vol. %
Ash, Weight % Color (Visual)
Date Approved: 2/15/04
(Specific-ASTM
METHOD
D 976 D 613 D 4053 Table 8 D 97 D 2500 D 93A D 240 D 2161 D 445 D 5453 D 5762 D 130 D 974 D 86ASTM NO. 2-D
STANDARD (D 975)
40 min. 40 min. 30 min. -6 (20) max. 52 (125) min. 32.6-40.1 1.9-4.1 30 max. imax. 282-338 (540-640) D 524 D 1796 D 482 D 1500 ation valid 0.35 max. 0.05 max. 0.01 max. (Clear to Amber) onlyif
dated)Note: Premium Additive Package includes cetane improvers, lubricity
enhancers and detergents.
DENNIS K. BURKE INC.
Typical test data are average values only. Minor variations which do not affect
performanc may occur.
284 EASTERN AVE. * CHELSEA, MASS. 02150 * PHONE: 1-800-289-2875 a FAX: (617] 884-7638 - WEBSITE: WWW.BURKEOIL.COM
Table 2.1 Fleetline Ultra Low Sulfur Diesel properties (source: www.burkeoil.com).
TYPICAL
ANALYSIS
42.7 50 40.3 6.858 -30 (-22) -30 (-22) 63 (146) 135,514 31.47 1.67 15 5 1 neutral 199 (390) 218 (425) 248 (478) 269 (517) 98.0 1.4 0.6 0.15 0.00 0.00 < 0.5I-2.2 Syntroleum Fischer-Tropsch Fuel
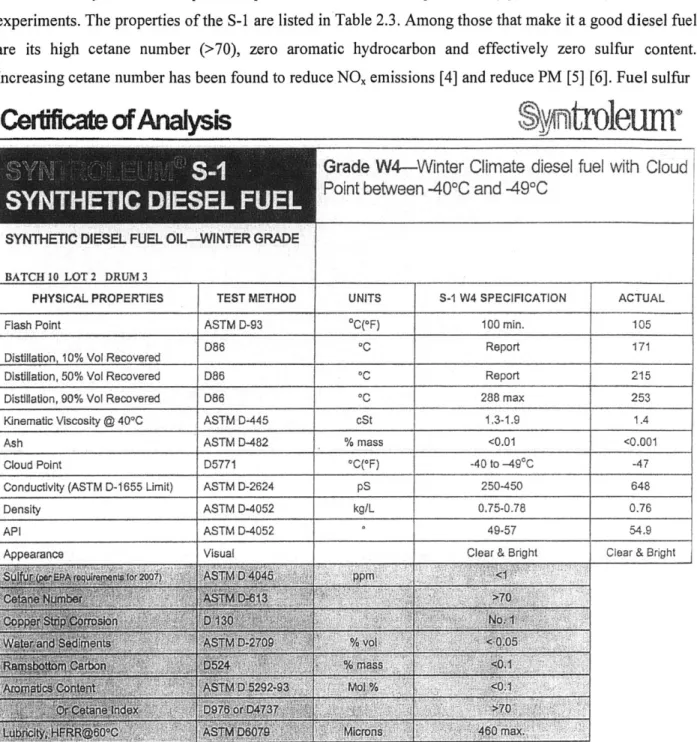
The Syntroleum Corporation provided the Fischer-Tropsch fuel (Syntroleum S-1) used in the experiments. The properties of the S-1 are listed in Table 2.3. Among those that make it a good diesel fuel are its high cetane number (>70), zero aromatic hydrocarbon and effectively zero sulfur content. Increasing cetane number has been found to reduce NO, emissions [4] and reduce PM [5] [6]. Fuel sulfur
Cerificate
ofAnayss
n
troleum-Grade
W4-Winter Climate
diesel fuel with Cloud
Point between -40*C and -491C
SYNTHEI IEEL LFUEL O IINTER GRADE BATCH 10 LOT 2 DRUM 3
PHYSICAL PROPERTIES TEST METHOD UNITS S-1 W4 SPECIFICATION ACTUAL
Flash Point ASTM D-93 OC(OF) 100 min. 105
D86 *C Report 171
Distillation, 10% Vol Recovered
Distillation, 50% Vol Recovered D86 0C Report 215
Distillation, 90% Vol Recovered D86 0C 288 max 253
Kinematic Viscosity @ 400C ASTM D-445 cSt 1.3-1.9 1.4
Ash ASTM D-482 % mass <0.01 <0.001
Cloud Point D5771 *C(*F) -40 to -494C -47
Conductivity (ASTM D-1655 Limit) ASTM D-2624 pS 250-450 648 Density ASTM D-4052 kg/L 0.75-0.78 0.76
API ASTM D-4052 49-57 54.9
Appearance Visual Clear & Bright Clear & Bright
Table 2.2 Syntroleum S-1 fuel properties.
contributes to particulate matter output; according to Cowley and Stradling [7], about 1 to 2% of fuel sulfur ends up as part of the PM output regardless of fuel sulfur level and engine type. Some research shows that increased aromatic content increases both NO, and PM emissions [8]. However, it was also found that increasing the fuel cetane number and injection pressure reduced this effect. Other studies have
found that aromatic content has little or no impact on PM emissions [6][9]. In addition to having favorable chemical properties, Syntroleum FT fuel has similar viscosity to normal diesel and can be handled in the existing infrastructure.
For combustion analysis the lower heating value of Syntroleum S-I was calculated using information from Syntroleum Corporation's product brochure and values listed in Table 6.3. The product brochure lists a lower heating value of QLHV,S-2 = 121,500 Btu/gal. Converting this to a mass basis with
the S-i density listed in Table 6.2 as 760 kg/M3 results in a value of QLHV,S.2= 44.6 MJ/kg.
Syntroleum Corp. provided additional S-1 properties necessary to do combustion calculations. The molecular weight of the FT fuel is 205 g/mol with a chemical composition of 84.9% carbon and
15.1% hydrogen, with no other impurities detectable (i.e. oxygen and nitrogen). This composition gives a
reduced chemical C:H ratio of CH2.12 for the S-I diesel fuel. Using this simplified composition, the ideal
combustion formula for Syntroleum S-i is:
22.17 21(~~ 83.65
Equation 2.2 14.49CH2 12 + (02+3.773N 2
)--+
14.49CO2 +15.36H 20+22.17 -1 02 + N20
0
)
0
Using the above equation nets an air/fuel ratio of 14.95:1 for Syntroleum S-2 diesel.
2.3 Fuel Blends
Fuel blends were studied primarily to allow direct assessment of the effect of fuel sulfur level on particulate emissions. Fuel blends containing 25% FT fuel and 75% D2 were prepared to show whether the advantages of FT fuel could be realized if it's only a portion of the engine's fuel. Other studies have found that the effect on emissions does not go linearly with the portion of FT in the blend, rather that most of the benefit can be had with less than 50% FT in the blend [10]. Given our setup, it was convenient to choose a 3:1 by volume D2 to FT fuel ratio. Derived from the above figures for standard and FT fuel, the following properties were used in the analysis. Converting 25% by volume FT fuel to a mass basis yields a fuel density of 824 kg/M3
and 23.5% FT fuel by mass. Based on a 25% molar fraction of FT, the simplified composition of the blend is CHI.9. Assuming complete combustion, this yields the
ideal combustion:
Equation 2.3 12.88CHI9 + 19*0(02 +3.773N 2) ->12.88CO 2 + 12.24H20 +19.0 I - 2 + 71.69 N2
Chapter 3 Experimental Setup
The experimental setup has remained essentially the same since the inception of this project. However, a couple of key parts have changed, as will be discussed here. For complete information on the rest of the apparatus, please refer to [1].
3.1 Fuel Flow Measurements
Prior work on this project used two Exact Flow Model EFM84 single-rotor turbine flow meters to measure volumetric fuel flow to and from the engine. This system was replaced due to a failure of one of the Exact Flow meters and a gravimetric system of fuel flow measurement was installed in its place. This system consisted of an Ohaus Scout II Pro balance and a four-liter beaker containing some quantity of fuel. The balance was connected to the serial port of the data acquisition computer and continuously polled to display the updated fuel mass every second. Because only about one gallon of fuel could be contained in the beaker, fuel flow data was only taken when gaseous emissions data was recorded. The counter flow heat exchangers installed for the previous system were retained, though they were superfluous as the new system measures the mass flow directly without the need to correct for temperature. To control the fuel supply and return, two three-way ball valves were installed to select either the beaker or tank as fuel source, and likewise for return. The beaker was generally refilled by selecting the tan k as a source and the beaker for the return.
The two 81.4-liter (22-gallon) ATL Inc. SP122B racing fuel cells are retained in order to prevent cross contamination of sulfur and aromatics between the straight FT and D2 fuels used in the experiments. However, blended fuels were typically run from the fuel flow beaker to allow for quick changes. To do so, fuel was prepared in gallon batches and added to the beaker as necessary. To guard against failure, the entire fuel system uses stainless steel-braided Teflon lines.
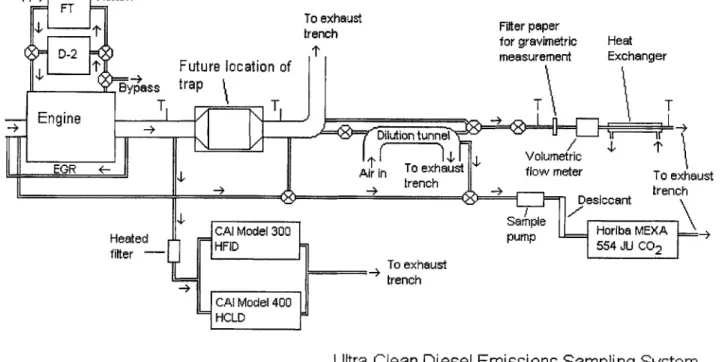
3.2 Gaseous Emissions Analyzers
Figure 3.5 shows a schematic of the emission sampling system. To measure hydrocarbon emissions, a California Analytical Instruments (CAI) Model 300-HFID was retained from prior experiments. The Model 300-HFID had an effective range of 0 - 900 PPM of C1, but was left in the 0
-30 PPM range since HC emissions were so low. To measure HC, a flame ionizes the sample stream and
electrodes in the instrument measure the particles. The flame in the Model 300-HFID is fueled by HC-free air and a fuel mixture of 40%/60% H2/He.
A California Analytical Instruments Model 400 HCLD Heated chemiluminescence NOx
analyzer replaced the TEI Model 42 previously used in this project. This instrument was calibrated with
300 PPM NOx and high grade zero air. The Model 400 was only used to measure NOx concentration in
the raw exhaust.
Supply Return
FT-To exhaust Filter paper
trench for gravimetric Heat
D-2 Future location of measurement Exchanger
To exhaust flow meter tnByhass
trap
T T T T
- Engine _ _ L
--Dilution ~i- tunnel
I I 1 Volumetric
EGR +-Air in To exhaust flow meter To exhmust
->+ trench Desi-+n trench
Desiccant
Sample
Heated CAl Model 300 pump Horiba MEXA =...
fiter HFID pm 554 JU CO2
To exhaust
trench
CAI Model 400 H CLD
Ultra-Clean Diesel Emissions Sampling System
T = Thermocouple Location
Figure 3.1 Emission sampling system schematic.
The sample for both CAI instruments was carried from the sample point through a 25' heated line to a Universal Analyzers Model 270S heated stack filter that removes any large particulate matter that can also clog sample and capillary tubes within the gas analyzers.
For CO2 measurements, a Horiba MEXA 554 JU was used. CO2 measurements were taken from
three sample streams: raw exhaust, intake air and dilution tunnel air. These figures were used to do consistency checks of the fuel and air flow measurements and to calculate EGR and dilution ratios. For intake-mixture CO2 (for EGR fraction calculations), a sample point was installed 4" downstream of the
EGR inlet in the middle of an unused intake air heater. For dilution ratio measurements, a sample point was installed about 30" away from the transfer tube, again ensuring fully developed flow at the sampling point.
Three 3-way valves mounted on a bulkhead on the test bed were used to select which sample stream to be sent to the CO2analyzer. The sample from the bulkhead is drawn through a 0.5 micron filter
by a Gast diaphragm pump. A check valve is installed upstream of the filter and pump to avoid
over-pressurizing the pump when pressurized intake manifold samples are collected. The sample is then passed through a canister containing Drierite desiccant to prepare the sample for the CO2 analyzer.
3.3 Mini Dilution Tunnel
The EPA defines particulate matter as all solid matter and condensable species that can be collected on a paper filter from a diluted exhaust sample held at no higher than 52*C [11]. This requires the use of some system that will simulate the dilution of exhaust gas in the atmosphere to reduce the temperature and stimulate particle growth as it would on-road. Though it is possible to treat the entire exhaust stream in this manner, it is more practical to use a mini dilution tunnel that takes a small portion of the exhaust and dilutes with fresh air. This system has remained virtually unchanged since described in
[1].
3.4 Gravimetric Particulate Matter Sampling System
The gravimetric particulate matter sampling system has been modified slightly to reduce sampling time so that dilute exhaust sampling is more possible. The prior setup forced the sample through two valves and a number of 900 bends between the outlet of the dilution tunnel and the sample filter holder. These restrictions have been eliminated. Additionally, a Gast Model 0823 rotary vane vacuum pump was installed to draw the sample through the sampling lines, a tetra fluorocarbon filter and flow meter at a much higher rate than previous pumps. To protect this pump from being destroyed by hot samples during raw sampling, a counterflow heat exchanger was plumbed in between the flow meter and the pump inlet. This reduced the exhaust stream temperature to the 30-40 C range at the pump inlet, which was well within the safe range, according to the Gast representative.
Chapter 4 Experimental Test Matrix and Procedure
4.1 Experimental Test Matrix
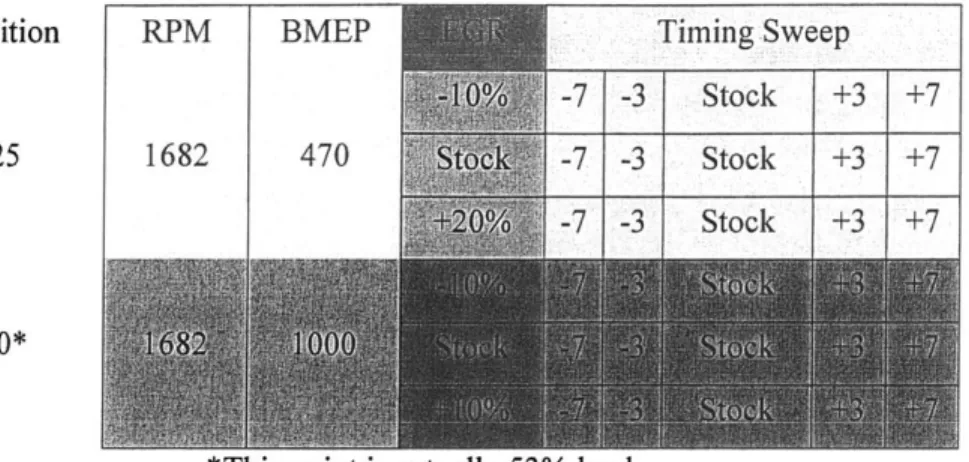
While the prior test matrix, Table 4.1, was constrained by fuel availability, such problems were not predicted for this reporting period, and as such, the test matrix, Table 4.2, was modified to represent a larger portion of the engine's operating range.
Condition RPM BMEP Timing Sweep
-7 -3 Stock +3 +7
A25 1682 470 -7 -3 Stock +3 +7
- 3 Stock +3 +7
A50*
'This point is actually 53u/o load
Table 4.1 Test matrix for initial investigation.
Condition RPM BMEP A25 1682 470 B50 B75 Timing Sweep -7 -3 Stock +3 +7 -7 -3 Stock +3 +7 -7 -3 Stock +3 +7 2011 1400 11 -7 -3 Stock +3 +7
Table 4.2 Test matrix for current work.
As shown in Table 4.2, this test matrix was designed to complement the data previously collected in several ways. As can be seen in Tables 4.1 and 4.2, there is significant overlap in the A25 condition. The purpose of this is two-fold: to provide an opportunity to correlate current results with old data and to
allow a direct comparison of 400ppm and 15ppm sulfur fuel to FT fuel. To complement the A50 data previously taken, the 50% load was retained, but the engine speed was increased to 2011 RPM. Finally,
,!u~mE~w ~
-with a larger supply of FT fuel available, it was possible to take 75% load data at 2011. This extends the scope of the work to cover a representative sample of engine operating conditions.
As noted in [1], FT fuel reduces PM output significantly, thereby avoiding the so-called PM-NOx tradeoff typical in emissions control strategies. Essentially, FT should allow EGR to be pushed to the practical limit, allowing for significant reduction in NOx with little (or no, in an optimized system) PM increase. As such, the EGR sweep for the A25 points was adjusted to include stock+20% absolute EGR rate in lieu of the -10% point.
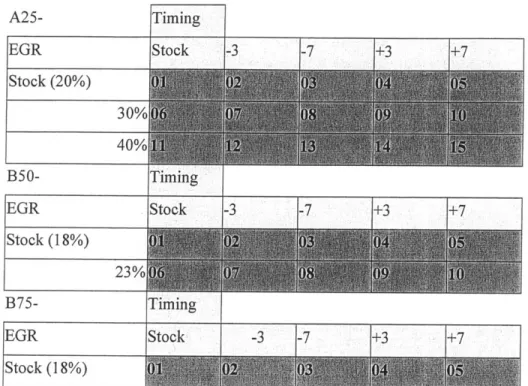
A25- Timing EGR Stock -3 -7 +3 +7 Stock (20%) 30% 40% B50- Timing EGR tok -3 -7 .+3 +7 Stock (18%) 23% B75- Ti ming EGR Stock -3 -7 +3 + 7 Stock (18%)
Table 4.3 Definitions of operating conditions and data set labeling convention.
Data sets recorded in experiments and presented here adhere to a prescribed naming convention that indicates fuel used and engine operating parameters. Excepting data for 15 PPM baseline fuel, a 2 to
3 letter prefix indicates the type of fuel for the data set. FT, BL and HS represent Fischer-Tropsch, FT/i 5 PPM blend and 400 PPM fuel, respectively. There is no prefix for the baseline fuel and ancillary blends used in one experiment also get a digit (e.g., BL2). Following the fuel specification, the general operating condition is indicated by the letter corresponding to the speed and two digits representing the percent load for that speed, as outlined in table 4.3. Following the load/speed information is a hyphen and another pair of digits indicating the timing and EGR rates, relative to stock. For example, BLA25-03 is for 25% load (224 N-m) at the A speed (1682 RPM) with FT/i5 PPM blended fuel, stock EGR rate and timing retarded
4.2 Particulate Matter Sampling Conditions
Unlike prior work reported, this study included particulate data from gravimetric sampling of both dilute and raw exhaust. Before each test, the Pallflex filter papers were placed in individual plastic petri dishes and allowed to condition for at least 8 -56 hours as recommended by the EPA [12]. All filter preparation, conditioning, and settling were done in an air-conditioned room where the temperature was between the EPA mandated range of 68* - 86' and relative humidity of 30% - 70%. However, it was
found that daily variation in room conditions had a substantial effect on filter mass, in some cases on the order of the entire particulate mass sampled. To correct for this, a set of "control" filters were kept in the sample room at all times so that a correction could be calculated based on the variation of the control filters in the period between filter weighing.
4.2.1 Dilute Exhaust Sampling
Though raw sampling was relied upon heavily last year, with the greater availability of fuel, it was possible to perform dilute particulate sampling. Dilution ratios were generally kept between 7 and 12. The goal was to dilute the exhaust just enough to reduce the temperature below the mandated 52C, and not too much more. This was to keep sample time reasonable. With the Gast rotary vane pump installed, sample times were typically around 15 to 30 minutes to collect at least 2 mg of sample. If was observed that filters sitting idle in the climate controlled conditioning room could vary in weight by 0.5 to 1.0 mg. Even though measures were taken to correct for this, the best way to improve data quality was to collect as much sample as possible.
Unused filter papers were allowed to condition in a climate controlled room for at least 24 hours prior to use. After the conditioning period, four PM samples were taken consecutively to have a large enough sample to average. After the filter papers were loaded, they were again allowed to sit for at least 24 hours in order to dry the paper and settle the particulates.
4.2.2 Raw Exhaust Sampling
Though it typically shows lower PM output than dilute sampling, some raw sampling was performed due to time constraints. However, raw sampling yields lower raw PM emission levels than dilute sampling because the hotter environment reduces the driving forces for nucleation and adsorbtion of condensable gas species.
Generally, the dilute sampling produced more consistent results, though both methods are extremely prone to error and leave much room for improvement. Of primary concern is the filter conditioning pre- and post- weighing.
4.3 Data Collection Procedures
Before beginning experiments, the engine and all analyzers were prepared for use. Typically, the analyzers and all sample handling heaters were switched on 2 hours prior to use. Once they had reached operating temperature, the analyzers were zeroed and spanned. They were then left alone for at least 30 minutes to ensure there was no drift in their readings. During this time, the engine was refueled, started and warmed up. Once the engine had reached steady-state idle temperature, the analyzers were re-checked for drift and the experiments were commenced.
Generally, data was collected in sessions that consisted of one timing sweep for a particular EGR rate/fuel combination, depending on what was being varied. This would cut down on the effect of day to day variation when comparing the graphs obtained from timing sweeps. Once the engine and instruments were prepared for use, a set of slow speed data would be recorded. This included readings from all thermocouples on the engine, as well as ambient conditions. This data was generally not used, but would be helpful in the case of trouble-shooting a problem with the setup.
The other data sets recorded were the emissions data, the PM sample flow data and the cylinder pressure data. Typically, the PM sample flow data would be taken over 30 minutes to an hour. Since it was not practical to use the fuel flow measurement system to track fuel flow for this entire time, flow data was "sandwiched" between two emissions data readings and the average fuel flow value was used. As such, if four filters were used, the data sets would be:
emissions 1 - filter 1 - emissions 2 - filter 2 ... filter 4 - emissions 5
During the emissions data runs, the engine's fuel was drawn from the fuel beaker instead of the tank, which provided fuel flow figures for the condition. During the particulate sampling, the data acquisition system recorded the flow through the filter for calculation of actual engine out data. Finally, after all PM flow and emissions data were taken, two high speed data sets were recorded, one of 10 cycles and one of
5
Results and Discussion
5.1 Emissions Characteristics
While there are generally a number of chemical emissions of concern in IC engine exhaust, this discussion focuses on emissions of oxides of nitrogen (NOx) and particulate matter (PM). Carbon monoxide emissions from diesel engines are negligible due to their lean operation. Additionally, unburned hydrocarbon emissions, while measured, were very low and will not be reported.
5.1.1 NO, Emission Trends
It is well understood that the principal factor driving NO, formation is in-cylinder temperature during combustion. The extended Zeldovich mechanism is very sensitive to temperature and NO, control techniques typically attempt to lower peak cylinder temperatures.
BSNOx Comparison For All Conditions
0. 0 U) U. 3 2.5 2 1.5 1 0.5 0 0 0.5 1 1.5 D2 BSNOx, g/hp-hr 2 2.5 3
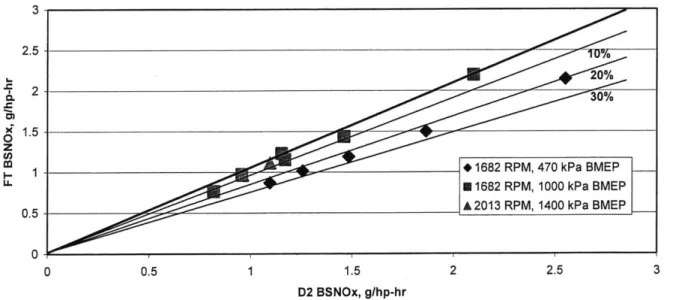
Figure 5.1 Summary of BSNOx results for several conditions.
Figure 5.1 summarizes typical results obtained in NO. experiments in this study. The x-axis corresponds to the NOx output generated by the 15 PPM sulfur baseline fuel and the y-axis shows the FT fuel results. The heavy line on the plot has a slope of unity; any data point on this line is one for which there is no difference in emissions between FT and D2 fuels. Any points below this line indicate an improvement in emissions. For reference, the lines representing 10, 20 and 30 percent improvements are
0
30%
* 1682 RPM, 470 kPa BMEP U 1682 RPM, 1000 kPa BMEP A 2013 RPM, 1400 kPa BMEP
also shown. From this figure, it is clear that FT fuel generally showed a greater positive effect on NO, output at lower loads, and virtually no effect, or a slight increase, at higher loads.
5.1.1.1 Fuel effects
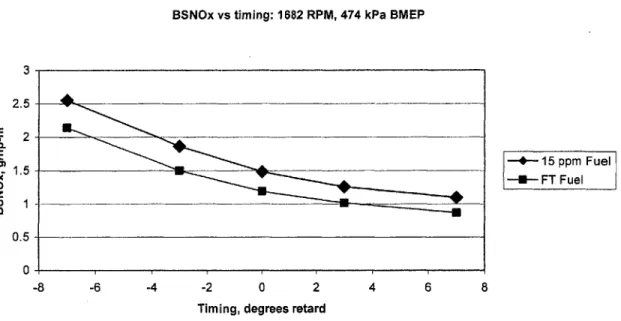
FT fuel showed around a 19% improvement in NO, output for the low load, low speed (A25) condition as shown in Figure 5.2. Prior work [1] showed that NO, output in this low load condition was relatively free from fuel effects. However, it appears that the inaccuracy of the fuel flow measurement system in prior work [1] contributed to an over-correction when converting the dry-basis NO, concentration to a wet basis. Thus, NO, output for this condition should have been lower than previously reported.
BSNOx vs timing: 1682 RPM, 474 kPa BMEP
3 2.5 -IF2 - 1.5 0 z 1 0.5 0 -8 -6 -4 -2 0 2
Timing, degrees retard
-+- 15 ppm Fuel ---- FT Fuel
4 6 8
Figure 5.2 BSNO, vs. timing for the low-speed, low load condition with FT and 15 PPM D2 fuels.
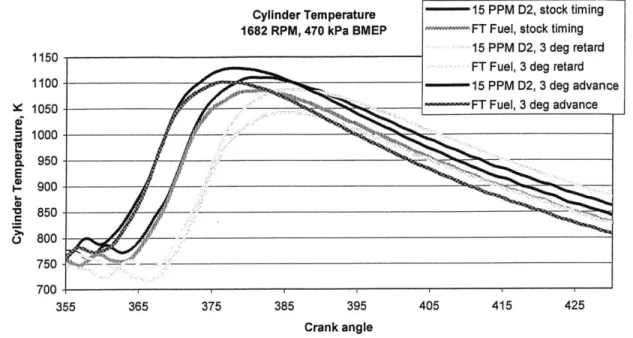
Figure 5.3 shows the peak cylinder temperature calculated from a first-law heat release analysis of the cylinder pressure data from the stock, 3 degrees advanced and 3 degrees retarded timing points. FT fuel lowers peak cylinder temperature in all cases. Given the strong dependence of NO, formation on cylinder temperature, the results shown in Figure 5.2 are consistent with the heat release analysis.
Cylinder Temperature 1682 RPM, 470 kPa BMEP 1150 -1100 -1050 - 1000-950 - 900- 850-800 -750 -700 -1 . -- I- ;
ZZII7~EL
PPMV LI2, 3 deg advance T Fuel, 3 deg advance
355 365 375 385 395 405 415 425
Crank angle
Figure 5.3 Cylinder temperature vs. crank angle for two fuels and three timings.
BSNOx: 1682 RPM, 1000 kPa BMEP
"r
400 ppm 15-400 Blend FT-15 blend
Fuel
T
FT FT-400 Blend
Figure 5.4 Fuel effect on NO, production: BSNO, output for six fuels.
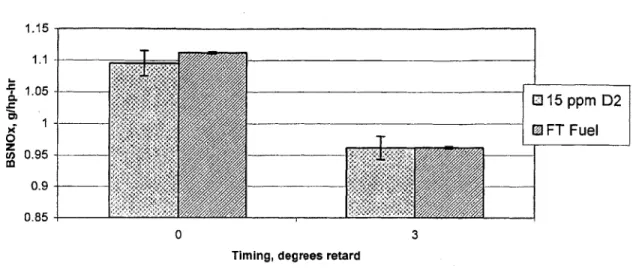
High load NO, data did not show a clear improvement for FT fuel. In fact, in a back-to-back comparison of 3 neat fuels and 3 blends at the low speed, mid load condition, FT fuel and the FT/D2 blends had the highest output.
15 PPM D2, stock timing FT Fuel, stock timing
15 PPM D2, 3 deg retard
FT Fuel, 3 deg retard
(D 0. E I-0 z 1.3 1.25 1.2 1.15 -1.1 1.05 1 -T 15 ppm TF
BSNOx vs timing: 1682 RPM, 474 kPa BMEP 2.5 2.3 - -400 ppm D2 2.1--15 ppm D2 - FT/15 ppm Blend 1.9 - -- FTFuel 1.7 0-co 0.7 0.5 -8 -6 -4 -2 0 2 4 6 8
Timing, degrees retard
Figure 5.5 BSNOX for four fuels and five timing points.
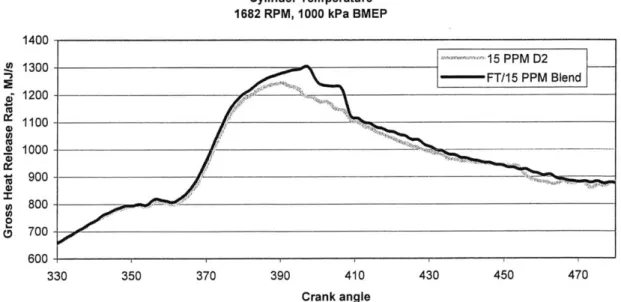
Comparisons of NO, data collected during high load operation on different days show that environmental conditions can impact results significantly. NO, data can be corrected for temperature, humidity and atmospheric pressure, however these corrections did not account for the results seen in Figure 5.5. Looking at the heat release analysis, Figure 5.6, for the 15 PPM fuel and the FT/i 5 blend for the results shown in Figure 5.4 (FT fuel pressure data from this test was unavailable) it is clear that the peak temperature is higher with the blended fuel.
Cylinder Temperature 1682 RPM, 1000 kPa BMEP 1400 . 1300 -- 1 PPM D2 -- FT/15 PPMV Blend 1200 1100 . 1000 900* U) 800 0 C 700 600 -330 350 370 390 410 430 450 470 Crank angle
The peculiar shape of the heavy line in Figure 5.6 between 400 and 410 degrees is most likely a result of noise in the cylinder pressure signal. This seems to be more of a problem at higher loads.
BSNOx vs timing: 2011 RPM, 1400 kPa BMEP
1.15 1.1 1.05 -1 015 ppm D2 [FT Fuel 0 zT Cn0.95 -0.9 -0.85 0 3
Timing, degrees retard
Figure 5.7 BSNO vs. injection timing at high speed, high load.
Figure 5.7 shows the results for the high-speed, high load test of NO, output. Similar to the mid-load condition, fuel had little effect on NO, formation and the output from either fuel was essentially the same. However, retarding timing had a significant effect, as expected. Again, this is due to reduced peak cylinder temperatures.
The results of this study indicate that FT fuel has little direct effect on NO, output at high loads, whereas it has a pronounced effect at low loads. Heat release analysis confirms that NO, output is primarily dependent on cylinder temperature.
5.1.1.2 EGR and Timing Effect on NO, Emissions
As shown in Figures 5.8, NO, output is a strong function of injection timing. This well-known
trend is a function of the peak gas temperatures during combustion. Peak cylinder pressure and temperature increase appreciably as injection timing is advanced from the stock timing point while noticeable temperature reductions occur as timing is retarded. As mentioned, the predominant NO,-formation mechanism in diesel engines is thermally driven; as such, NO, emissions should change in the same direction as peak cylinder temperatures.
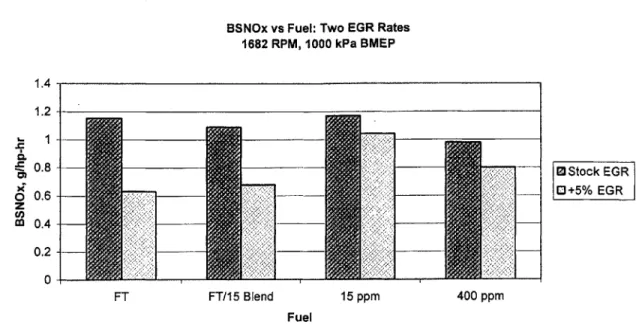
BSNOx vs Fuel: Two EGR Rates 1682 RPM, 1000 kPa BMEP 1.4 1.2 0.80.8 - -Stock EGR d_0.6 0+5% EGR z U) 02 0 FT FT/15 Blend 15 ppm 400 ppm Fuel
Figure 5.8 Change in BSNO, output with increased EGR rate for four fuels.
Very little NO, data was taken at elevated EGR rates due to an equipment failure. However, the small amount available confirms previous findings and indicates that increasing EGR rate reduces NO, output regardless of fuel. This is illustrated in Figure 5.8. These results show that FT fuel gives a greater improvement when EGR rate is increased. Of particular interest is the disproportional improvement the blended fuel yields. Consistent with prior results, NO, outputs dropped from about 15% to 44% when
increasing EGR rate from 18% to 23% for the low-speed, mid-load condition, depending on fuel.
5.1.2 Particulate Matter Emissions Trends
Figure 5.9 shows a summary of the particulate sampling results reported. The x-axis corresponds to the PM output generated by the 15 PPM sulfur baseline fuel and the y-axis shows the FT fuel results. The heavy line on the plot has a slope of unity; any data point on this line is one for which there is no difference in emissions between FT and D2 fuels. Any points below this line indicate an improvement in emissions. For reference, the lines representing 25, 50 and 75 percent improvements are also shown. From this figure, it is clear that FT fuel reduces PM output between about 25 and 50 percent for most every operating condition for which there is data, which is consistent with prior work. By experimenting with different fuel combinations and varied engine operating parameters, an overall strategy for emissions control can be developed.
BSPM Comparison For All Conditions 0.07 0.06 LL 0.05 U-0.04 E 0.03 0) 0.02 0.01 n 0 0.01 0.02 0.03 0.04 0.05 0.06 0.07
Sulfur D2 BSPM, g/hp-hr (No. 2 Diesel)
Figure 5.9 Summary of BSNOx results for several conditions. 5.1.2.1 Fuel Effects
The inclusion of FT/D2 fuel blends in this study allowed us to examine the possibility of obtaining the positive effects of using FT without the cost of using pure FT fuel. As discussed earlier FT was blended with the baseline 15 PPM sulfur fuel, as well as last year's baseline 400 PPM sulfur fuel. This would help show what portion of particulate reduction was due to the fact that FT fuel has essentially zero sulfur and what might be due to the combustion characteristics of FT fuel.
BSPM vs timing: 1682 RPM, 1000 kPa BMEP Dilute Sampling 0.04 - 400 ppm D2 -- 15 ppm D2 0.035 - -LFT/15 ppm Blend 0.03 - -FT Fuel 0.025 -J T 0.02 0.015 0.01 0.005 0 -8 -6 -4 -2 0 2 4 6 8
Timing, degrees retarded
Figure 5.10 BSPM output for four fuels over five injection timings
--50%
50
75%
Figure 5.10 shows the results of low-speed, mid load dilute PM sampling tests with four fuels: neat FT, 15 PPM D2, 400 PPM D2 and the 25%/75% by volume blend of FT and 15 PPM fuels. It can be
seen that FT fuel reduces PM output for all timing points and that the blended fuel can produce a varying amount of reduction, depending on timing.
As discussed earlier, fuel sulfur is a major contributor to PM output, therefore a significant reduction should be seen between the 15 PPM fuel and 400 PPM fuel. According to Kittelson et al [13], fuel with sulfur content of 400 PPM will produce exhaust with sulfuric acid concentrations ranging from
5 - 20 PPM. Using this sulfate-exhaust concentration, the exhaust of the test engine should have sulfate levels between 0.002 - 0.009 g/hp-hr at the stock timing, stock EGR, low load condition. For stock
timing, Figure 5.10 shows a difference in PM output of about 0.005 g/hp-hr between the 400 PPM and 15 PPM fuel, consistent with Kittelson's estimates. As such, if the difference in fuel sulfur content were the principal contributor to reduced PM output with FT fuel, there should be little difference between particulate output with FT and 15 PPM fuel. However, it can be seen that FT fuel reduces PM levels even further than 15 PPM fuel. Thus, the reduction must be due to more than just reduced fuel sulfur.
Results from raw sampling experiments with fuel blends reinforce this conclusion. As shown in Figure 5.11, the fuel blend that contains 25% FT fuel and 75% 400 PPM fuel reduces PM emissions approximately 24%, compared to 49% for neat FT fuel. Additionally, Figure 5.12 shows results for the blend of FT and 15 PPM fuel. The relative reduction is even greater in this case, again affirming that fuel sulfur reduction only contributes partially to the overall PM reduction. As shown, the FT/D2 blends produce 69% and 50% of the particulate reductions of neat FT versus 15 PPM and 400 PPM fuel, respectively. BSPM: 1682 RPM, 1000 kPa BMEP Raw Sampling 120 10 U-4080 400 ppm FT-400 Blend FT Fuel
Figure 5.12 shows a comparison of PM results from raw sampling of 15 PPM fuel, FT fuel and the blend of the two. The relative reduction of neat FT and the blend is greater that in the case of the 400 PPM fuel and blend. It should be noted that these particular experiments were conducted with raw exhaust sampling to reduce the effect of daily temperature and humidity variation.
BSPM: 1682 RPM, 1000 kPa BMEP Raw Sampling 120.00 100.00 0 -J 80.00 U-60.00 a. U- 40.00 0 20.00 a. S 0.00 15 ppm FT-15 blend FT Fuel
Figure 5.12 Relative reduction in PM emissions for 15 PPM, FT fuel and their blend.
5.1.2.2 Engine Operating Parameter Effect
Both raw and dilute particulate data were taken for the low speed, low load condition. Prior data from MIT showed that the stock timing for this condition point was actually a local maximum for PM output, and the current data confirms this for 400 PPM fuel and FT fuel. It is likely that this timing was chosen as a compromise between PM output, NOx output and fuel consumption. (Practically speaking, fuel consumption must be of principal concern to companies in the business of selling engines.) Advancing timing from this point would lower PM and fuel consumption, but increase NO,. Conversely, retarding the timing would improve NOx emissions and PM, but increase fuel consumption. Dilute exhaust sampling data was taken for a number of timing points and the result is shown in Figure 5.13.
As timing is retarded and combustion is pushed into the expansion stroke, cylinder temperatures drop, most likely leading to a decrease in soot formation rate, and therefore a reduction in engine out PM. As injection is advanced before TDC, cylinder temperature and pressure will increase, increasing both the soot formation and oxidation rates. Since PM drops as the cylinder gets hotter, the oxidation rate is most likely dominating as injection timing advances, leading to the drop in PM shown in the data. Combine
this with the fact that the combustion duration grows with injection timing advance, and the time for PM
oxidation increases helping to lower the overall engine-out PM level.
The A50 particulate matter results are shown in Figure 5.10. For all but the most retarded timing
point, the PM dependence on timing is fairly small, yet the same insensitivity appears for each fuel,
regardless of type. As timing is advanced 3 degrees from stock, PM output increases for all fuels; with
further timing advances, PM output decreases as peak cylinder temperatures increase. With 3 degrees
retard in timing, three of the four fuels show a decrease in PM, with the fourth holding about steady.
Addition retard shows a significant increase in PM output. It is likely that the stock timing point exists
where the competing effects of soot formation and oxidation rates are well balanced. It seems that, for this
low-speed, mid-load condition, deviating significantly from this point would have the expected effect of
increasing PM output as timing is phased after TDC and vice versa. Conversely, the low-speed, low-load
stock timing condition is around a local maximum and deviating more than a few degrees in either
direction reduces PM output.
BSPM vs timing: 1682 RPM, 474 kPa BMEP Dilute Sam pling
0.09 0.08 0.07 0.06 -+- 400 ppm D2 :E 0.05 -0-- 15 ppm D2 : 0.04--u F~e 0 03 A FT~ Fuel c,0.03- 0.02-0.01 0 -8 -6 -4 -2 0 2 4 6 8
Timing, degrees retarded
Figure 5.13 BSPM vs. timing for FT, 15 PPM and 400 PPM fuels.
Another trend common to both fuels shown in the aforementioned brake specific particulate
matter results is the increase of PM as EGR rates increase. In general, EGR reduces the overall flame
temperature through the increase in heat capacity of the recycled exhaust gases and reduces the oxygen
concentration of the fresh air by diluting it with burned-gas products. The combination of the reduced
temperature and oxygen concentration lowers the soot oxidation rate.
Figure 5.14 shows the relative increase in PM output with varying EGR rate increase for different
fuels. Compared to 400 PPM, the FT shows a smaller increase in PM out put with a 10% (absolute)
increase in EGR rate in mid-load tests. Likewise, in a low-load test, FT showed a smaller increase in PM when EGR rate was increased by 20% absolute in a low-load test. This is indicative of tendency of FT fuel to reduce dependency of emissions on engine operating parameters. As such, it was predicted that the blended fuel would also yield a smaller relative increase in PM with increased EGR (in stock EGR tests, fuel blends showed some of the improvement given by pure FT). However, this behavior is not seen in the data taken (first two columns in Figure 5.14). In this case, the FT/15 blend gave a larger relative increase in PM output with 5% absolute increase in EGR rate than with 15 PPM fuel. However, it is suspected that this result may actually be due to experimental error. Unfortunately, there is no data comparing FT fuel to 15 PPM and blended fuel for the mid-load condition.
Percent Increase in PM Output with EGR Rate for Different Fuels 1682 RPM, 470 and 1000 kPa BMEP, Raw and Dilute Sampling
400% o. 350% -O 300% - P4P S250% S200% S150% Diu a~50% 0% FT/IS Blend 15 PPMV D2 FT 400 PPMV 02 FT 15 PPM Fuel
Figure 5.14 Relative increase in PM output with EGR increase for different fuels.
5.1.3 Tradeoffs
Typically, NO, reduction strategies increase PM output and vice versa. This is known as a "NO,
- PM tradeoff" and makes it difficult to meet ever-more stringent emissions requirements for both pollutants. Considering that, it is useful to plot NO, output against PM output to examine the potential of a certain emissions control scheme in real-world use. Furthermore, this serves to put the presented data into perspective. Figure 5.14 shows the NO,-PM tradeoff for FT fuel and 15 PPM fuel for the low-speed, mid-load condition. The typical tradeoff behavior can essentially be seen in the 15 PPM fuel curve, though in this case, it appears that advancing timing beyond the stock point increases both PM and NO, output, in contrast to the trend at the low-load condition discussed in 5.1.2.2. Additionally, the stock timing point is nearly optimal in this case (i.e., low-speed, mid-load condition). The FT fuel curve shows
much less of the typical tradeoff when injection timing is retarded. From Figure 5.15, it is clear that FT fuel allows timing to be further retarded for NO, control without significant impact on PM output.
BSPM - BSNOx Tradeoff 1682 RPM, 1000 kPa BMEP 0.5 1 1.5 BSNOx, g/hp-hr 2 -+- FT Fuel -U- 15 PPM D2 2.5
Figure 5.15 BSPM - BSNO, tradeoff for the low speed, mid load data. 0.03 0.025 0.02 0.015 0.01 0.005 0 0. a-Co In 0 Mdvum PI
6 Conclusions
6.1 Fuel Effects
To assess its potential for emission reductions, FT fuel emissions were compared to standard diesel
fuel emissions in the stock engine:
" For the low load, stock timing and EGR condition, FT fuel reduced PM output approximately
30 to 60%, depending on reference fuel.
* For the mid load, stock timing and EGR condition, FT fuel reduced PM output approximately
30 to 50%, depending on reference fuel.
" For the low load, stock timing and EGR condition, FT fuel reduced NO, output by
approximately 19%.
* For the mid and high load conditions, FT fuel showed no improvement in NO, emissions. * A 25% by volume FT fuel blends showed similar behavior.
These results corroborate earlier findings that switching to FT fuel alone can reduce NO, emissions under some conditions and in almost all cases, reduce PM emissions.
6.2 Operating Parameter Effects
To study the potential for emissions reductions in an engine optimized for FT fuel, EGR and injection timing was varied:
* For the low load conditions, FT fuel reduced PM emissions 25 to 75%, depending on timing. In addition, PM emissions from FT fuel showed less dependence on timing.
* For the mid load conditions, FT fuel reduced PM emissions 30 to 50%, depending on timing. In addition, PM emissions from FT fuel showed less dependence on timing.
* For the high load conditions, FT fuel reduced PM emissions 25% when the timing was retarded, but showed no improvement for stock timing.
* For the mid load, stock timing condition, increasing EGR rate from 18 to 23% gave an approximately 45% reduction in NO, output with FT fuel, compared to 20% with 400 PPM
* For the low load, stock timing condition, increasing EGR rate from 20 to 40% gave an approximately 25% increase in PM with FT fuel, compared to a 250% increase with 15 PPM sulfur D2.
* For the mid load, stock timing condition, increasing EGR rate from 20 to 30% gave an approximately 290% increase in PM with FT fuel, compared to a 370% increase with 400 PPM sulfur D2.
* 25% FT, 75% 15 PPM sulfur D2, by volume, showed a 40% reduction in PM output compared
to 15 PPM sulfur fuel.
* 25% FT, 75% 400 PPM sulfur D2, by volume, showed a 60% reduction in PM output
compared to 400 PPM sulfur fuel.
The causes of the reduced PM emissions are intriguing. The absence of sulfur, and thus sulfates, in the FT fuel is one obvious contribution; however, the magnitude of the reduction is more than that accounted for by sulfur and sulfates alone. Combustion was improved with FT fuel with reduced ignition delay. The effects of FT fuel on PM emission with varying EGR imply that the relative balance of particulate formation and oxidation is changed in some intricate way.
Essentially, FT fuel allows for more retarded timing without significantly increasing PM output compared to more advanced timing. FT fuel doesn't show the typical PM-NO tradeoff shown by standard fuel, which yields increased PM output with substantially retarded timing. Additionally, FT fuel makes EGR "more effective" by reducing the relative increase in PM output with increased EGR. Combining both effects, FT fuel allows the engine operating parameters to be modified to lower NO, emissions substantially without increasing PM output. In application, PM can then be treated with a filter or trap.
6.3 Recommendations
To show the real potential of FT fuel in an optimized engine, the complete test matrix should have been performed with careful attention paid to the PM collection and analysis procedures. The focus of this work should be increasing EGR rates in all test conditions. To accomplish this, an external EGR cooler should be installed to allow for increased EGR at higher loads. Doing so will show how FT fuel can help control NO, more effectively that D2 by allowing for higher EGR rates than standard fuel. In addition, retarded injection timing should continue to be studied, with emphasis placed on an additional condition with more retarded (say 10 degrees from stock) in lieu of the advanced timing points.
References
1. Llaniguez, J. T., "A Fundamental Study of Relationships Among Fuel Properties, Combustion Characteristics and Emissions with Normal and Synthetic Diesel Fuel," SM Thesis, MIT, 2003 2. "Syntroleum S-2 Synthetic Diesel: Driving Clean-Fuel Innovation,"
http://www.syntroleum.com/media/syntroleums2.pdf, Syntroleum Corporation, 2002
3. Heywood, J. B., Internal Combustion Engine Fundamentals, McGraw-Hill, Inc., New York, 1988
4. Dec, J. E., Canaan, R. E., "PLIF Imaging of NO Formation in a DI Diesel Engine," SAE Paper
980147, 1998
5. Kwon, Y., Mann, N., Rickeard, D. J., Haugland, R., Ulvund, K. A., Kvinge, F., and Wilson, G.,
"Fuel Effects on Diesel Emissions - A New Understanding," SAE Paper 2001-01-3522, 2001 6. Lee, R., Pedley, J., Hobbs, C., "Fuel Quality Impact on Heavy Duty Diesel Emissions: -A
Literature Review," SAE Paper 982649, 1998
7. Cowley, L. T., Shadling, R. J., and Doyon, J., "The Influence of Composition and Properties of Diesel Fuel on Particulate Emissions from Heavy-Duty Engines," SAE Paper 932732, 1993
8. Kidoguchi, Y., Yang, C., and Miwa, K., "Effects of Fuel Properties on Combustion and Emission
Characteristics of a Direct-Injection Diesel Engine," SAE Paper 2000-01-1851, 2000 9. Neill, W. S., Chippior, W. L., and Gfilder, 0. L., "Influence of Aromatic Type on Diesel
Emissions Investigated by Blending Narrow-Cut Components and Pure Hydrocarbons into a Base
Fuel," Paper No. 2001-ICE-420, ICE-Vol. 37-2, 2001 Fall Technical Conference, ASME 2001
10. Maly, R. R., "Effect of GTL Diesel Fuels on Emissions and Engine Performance," 2004 DEER
Conference, Coronado, 2004
11. EPA Test Procedure TP 713D, "Sample Collection, Continuous Hydrocarbon Analysis and
Particulate Collection of the Light Duty Diesel Test Procedure"
12. EPA Test Procedure TP 714C, "Diesel Particulate Filter Handling and Weighing Procedure"
13. Kittelson, D. B., Arnold, M. and Watts, and W. F. Jr., "Review of Diesel Particulate Matter