International Natural Gas Trade Project Center for Energy Policy Research
Energy Laboratory
Massachusetts Institute of Technology March 1986
m*a
f-K
9-VWR~
generously supported by the participating organizations listed below. They have been helpful in sharing information and perspectives, and we
have benefitted greatly from their assistance. However, the views and contents of this report are the authors' sole responsibility, and do not necessarily reflect the views of the participating organizations nor the Massachusetts Institute of Technology.
PARTICIPATING ORGANIZATIONS
Alberta Energy and Natural Resources, Edmonton, Canada BHP Petroleum, Melbourne, Australia
BP Gas Limited, London, U.K.
Chevron Corporation, San Francisco, U.S.A. Den norske Creditbank, Oslo, Norway
Department of Energy, Mines and Resources, Ottawa, Canada Department of Resources and Energy, Canberra, Australia Distrigaz, Brussels, Belgium
Kawasaki Heavy Industries, Ltd., Tokyo, Japan Ministry of Energy, Ontario, Toronto, Canada Nippon Oil Company, Ltd. Tokyo, Japan
Nissho Iwai Corporation, Tokyo, Japan Norsk Hydro, Oslo. Norway
Osaka Gas Co., Ltd., New York. US A. Petro-Canada, Calgary, Canada
Royal Bank of Canada, Calgary, Canada Royal Dutch/Shell Group
Royal Ministry of Petroleum and Energy, Oslo, Norway Tokyo Gas Company. Ltd., Tokyo, Japan
United States Department of Energy, Washington, D.C. Yukon Pacific Corporation, Anchorage, U.S.A.
W-mwm
0-C-This report on Natural Gas Trade in the Pacific Basin is the
second of three units being produced by the Center for Energy Policy Research. The first unit on Canadian-U.S. trade has already been
published, and the third, on Western Europe, will be completed by
JAPANESE LNG POLICY: EXPERIENCE IN SEARCH OF DIRECTION
by Loren C. Cox
THE DEMAND FOR NATURAL GAS IN JAPAN, 1985-2000 by Arthur W. Wright
NATURAL GAS SUPPLY IN THE ASIA-PACIFIC REGION by M.A. Adelman and Michael C. Lynch
A LIQUEFIED NATURAL GAS TRADE MODEL OF THE PACIFIC BASIN by Charles R. Blitzer
LONG-TERM LNG CONTRACTING UNDER ALTERNATIVE PRICE SCENARIOS by Guy M. Barudin and John E. Parsons
TECHNOLOGIES FOR NATURAL GAS UTILIZATION by David C. White
01, 0-SWu 0", *a; w-~n nsrr
by Loren C. Cox
This paper will examine how a set of past policies and practices has
produced a pattern of LNG use in Japan which has likely reached the maximum
possible volume under those conditions. It appears as though this effect was unintended, and now even may be seen as unfortunate. However, changing
these conditions is difficult, and the likelihood of success uncertain. The policies and practices described are those of Japan because it is the giant of liquefied natural gas (LNG) utilization. Japanese experience has created much of the world's perception about LNG, and both producing and consuming countries' expectations have been shaped by that experience.
In this paper, we describe key elements of the Japanese experience, and show that it was perhaps more random or accidental than deliberate, with consequences that may be self-limiting to greatly increased natural gas use
in that country.
LNG IN JAPAN
Because the Asia-Pacific region's perception of LNG trade has been so influenced by the Japanese experience, Japan was selected to examine policy issues for both consuming and producing countries in the region.
though they import only 20 percent of current contract volumes. As will be discussed later, the dominance by electric utility use of LNG imports will likely continue. However, the potential growth of natural gas use in Japan is probably higher outside the electric utility sector, which thus
highlights the role of--and policy toward--town gas companies as a major determinant of future LNG imports into Japan.
To understand current Japanese policy on gas utilization, examination of its historic development is necessary. This examination shows that three important factors have not yet been successfully integrated in current Japanese policy making. These are: 1) regulation of gas
distribution companies (referred to in this paper as town gas companies);
2) environmental regulation; and 3) electric utility fuel diversification strategies following the two oil price shocks.
Town Gas Companies--Background
The development of town gas companies using manufactured gas followed patterns similar to that in other countries. Commercial enterprises were begun in the late 19th century to gasify coal, primarily for lighting. Development of electric lighting early in the 20th century affected this principal market of the town gas companies, and gas sales began to be directed toward other purposes, primarily for cooking.
Because Japan has virtually no natural gas resources, town gas companies were especially dependent on coal for manufacturing of gas. Domestic coal reserves are also limited and were subject to price
sale prices to municipalities were largely fixed--were caught in savage margin squeezes. In some cases, bankruptcies resulted, causing failures of
service. To ameliorate such problems, National Gas Act legislation was enacted by the Imperial Diet in 1923, 1925, and 1930. These provisions included:
1. The establishment of new gas manufacturing plants and modifications
to existing plants to be on a permission basis;
2. Regulations governing the use of public property such as rivers, roads, etc., for distributing gas;
3. The regulation of gas prices and related terms and conditions; 4. Safety aspects for gas manufacturing plant;
5. Limitations relating to calorified value, pressure, and quantity1; and
6. In 1930, amendments giving national authority for permitting increases in capital structure and resolving disputes between companies and municipalities.
By the late 1940s and early 1950s, town gas companies had begun to
recover from the war years and resume full service to customers. A series
of legislative changes in the 1950s led to a regulatory pattern that gave
considerable authority to gas companies in their service areas, but which also imposed service obligations. Because there were no interprefectural or intercity movements of gas by pipeline, each gas company was responsible
for its own supplies and marketing. As a result, the gas industry
remained fragmented, largely local in its orientation, and serving mostly a residential market, which could support the rather high-cost gas supply.
1
Malcolm W.H. Peebles, Evolution of the Gas Industry, New York University
In the mid-1950s, feedstock for gas manufacturing began to shift away from sole dependence on coal and toward crude oil, naptha, and (liquefied petroleum gases (LPGs). The acceleration in the Japanese economy increased gas demand in all sectors, and especially the residential. Gas use for water heaters became more widespread, though space heating still lagged. Some sales began to the industrial sector (primarily feedstock for the chemicals business) and for new commercial buildings in the major metropolitan areas.
Thus, by the mid-1960s, town gas companies were enjoying major growth in their markets, especially the residential sector. The limited use of gas for cooking and water heating permitted high unit prices despite
considerable load fluctuation. New hookups increased revenue, and everyone was reasonably happy. As indicated previously, the structure of the town gas industry and its regulation were locally oriented and served a
high-value residential market. By the mid-1960s world oil prices were low, and oil-based feedstocks were increasing in use without significant
controversy.
Town Gas Policy
The Japanese Ministry of International Trade and Industry (MITI) has exerted considerable influence over major portions of industrial policy in
Japan. It appears as though the town gas sector is one to which MITI has given virtually no attention historically. There is no literature
speculating on why this sector has received so little emphasis, so some
First, one might ask why the town gas sector is sufficiently important to warrant attention. In terms of the history described above, there was little reason to invite major policy attention. The gas supplied was oriented to an entirely local market, was small in volume, and produced by companies that were of diverse ownership (about 180 private and 70
municipal). 2 Of course, not all parts of the industry are small, as
measured by number of customers, with Tokyo Gas Company the world's largest gas utility with over 6 million customers and Osaka Gas Company with over 4 million.3
During the post-World War II period, other sectors of Japanese energy industry received significant attention by MITI, especially oil and
electric utility companies (with nuclear power development receiving particular attention and resources). The lack of attention to town gas companies was therefore likely simply due to lack of interest. Because town gas was serving the residential sector for cooking, hot water, and some space heating, premium prices could be claimed, and even gas
manufacturing from coal or naptha could be profitable in that market.
Thus, no "problem" was seen to be solved in this sector, so apparently no
MITI attention (or resources) seemed warranted--at least until the late 1960s and beyond.
Unfortunately, this past orientation has not evolved into policy more
appropriate from the 1980s to the end of this century. As will be
2
Peebles, ibid., p. 108.
3
discussed below, town gas companies' capacity for growth now depends on their ability to expand markets beyond the residential into other sectors, especially the industrial. Constrained by structural change in the
Japanese economy and environmental rules, only LNG appears to offer the prospect of major expansion, especially to industrial customers. To successfully compete in the industrial sector, LNG feedstock price must compete with other fuels now used on the industrial sector.
The key to a stronger competitive position may be an expanded and integrated transportation system that would allow load balancing shifts of gas supply, increase flexibility, decrease dependence on storage and LNG tanker schedules, and reduce technical supply/delivery problems. However, the Japanese policy of benign neglect of the gas industry has not resulted in such an interconnected system. This circumstance now makes it more difficult for town gas companies to take a lead--or even prominent--role in negotiations for LNG projects. Instead, in past projects they have been linked with electric power companies who have approached LNG with a quite different economic outlook.
Thus, the lack of interconnection among major gas-using areas puts a very different perspective on LNG usage by town gas companies than would
have occurred if these companies had been rationalized into something like the nine electric power company service areas. A decision to rationalize may well be critical in setting out a strategy for expanded LNG
utilization. If the decision is taken to continue to allow nearly 250 town
gas companies to operate in historical fashion, then LNG importation will
If the decision is made to rationalize organization of the service areas, then town gas company import of LNG could be significantly separated from electric utility decisions.
The implications of this policy decision will be touched upon later when we take up the issue of pricing and take-or-pay terms. Historically, electric utility circumstances have differed from town gas interests, remain so today, and will likely diverge further in the future.
Impact of Environmental Policy
For now, however, we will return to the 1960s when environmental constraints were becoming increasingly binding on both town gas and
electric utility companies. Coal-based gas was still utilized, with coke
being sold to the steel industry, then thriving. To maintain the supply of
coke to industry requirements, the gas had to flow in fairly constant volumes. This led to an increase in industrial base-load gas contracts.
At the same time, electric utility companies were expanding to meet rapidly increasing demand. Capacity additions were fired by all
traditional fuels, with nuclear reactors beginning to emerge as serious competition. However, coal-fired plants continued to be constructed for base-load and there was a major expansion of capacity fired by high-sulfur crude oil. Demand was growing strongly and electric utilities were
scrambling to install capacity. Contributions to pollution by these facilities combined with continued gas/coke processing by the town gas industry began to produce serious air quality problems.
1960s needs no elaboration. Also well-documented are the series of
environmental problems in both water and air quality in this period. Toxic discharges into streams resulted in a series of environmental issues that received spectacular publicity. Population reconcentration and economic growth in Tokyo, Osaka, and Nagoya brought increasing demand for both electricity and gas. Use of all fuels increased, but especially high-sulfur crude oil and coal.
The resulting increase in sulfur and other air contaminants fed growing public concern about the need for tougher air quality rules. In the 1960s, the first air quality laws were passed, and gave substantial approval power to local governments. By the mid-1960s some of that authority was being utilized. In 1964, Yokohama City made a land sale to Tokyo Electric Power
4
Company conditional on the use of low-sulfur oil and high stacks.
It was in the context of these increasingly stringent air quality standards that LNG first emerged as a desirable and feasible fuel for both town gas and electric utility companies. Phillips and Marathon had
substantial reserves of natural gas in the Cook Inlet area of Alaska, and lacked an obvious local market of equivalent magnitude. They had begun
examining LNG sales to Japan in the early 1960s, and the discussions
continued for some years. The central issue appeared to be pricing, with the cost of LNG facilities suggesting a c.i.f. price somewhat higher than that for crude oil.
4Julian Gresser, Koichiro Fujikura, and Okio Morishima, Japanese Environmental Policy: A Comparative Assessment, The M.I.T. Press,
When finally concluded, the contract called for a 15-year term for delivery of 960,000 tons per year at U.S. 1969 $.52 per Btu c.i.f. At this time the Btu equivalent price for oil was approximately $0.30.5 Thus, the difference paid by the importers, Tokyo Gas Company and Tokyo Electric Power Company, was motivated by the need to increase capacity, which was becoming increasingly difficult to do using heavier oils or coal (as noted above). Thus, clean, but higher-priced LNG made sense to both companies in
the mid-1960s.
The next Japanese project was from Brunei, with delivery commencing in 1972 at over 7 billion cubic meters per year. This was five times the size of the Alaska project and also was fostered by the 1960s' environmental restrictions previously mentioned. By commencement of delivery, oil prices increased by more than those for LNG, with the latter being less than 30 percent higher. Again, this was a premium worth paying in order to
continue to expand capacity in an environmentally acceptable way. The lead participants in the Brunei project again were Tokyo Electric Power and Tokyo Gas. Osaka Gas also made its first appearance in LNG trade, with an interest of about 10 percent in this project.
Recalling that the c.i.f. price in 1969 was $.52 per Btu for
Alaska-Japan, and not greatly higher for Brunei-Japan in 1972, two points should be noted. First, there is some basis to consider that today's LNG prices need not be at the levels of 1985 oil prices--even considering that cost inflation has been higher in LNG-type equipment than the pattern of
5Tadahiko Ohashi, An Analysis of the Future of Natural Gas in Japan, Tokyo Gas Company, Tokyo, Japan, 1985, p. 17.
general cost inflation. We will return to this question later in this study (see Supply paper). The second point is that pre-1973 contracts were based on the need for a fuel that allowed capacity for both town gas and electricity to be expanded. Without the Alaska and Brunei arrangements, both Tokyo Electric and Tokyo Gas would have been pressed to meet demand for service then occurring. Thus, they were willing to pay a premium for fuels that would allow them to expand their revenue base and meet their customers' growing demand. Seen in this light, LNG contracts that allowed expansion of service in a tightening environmental climate likely were appropriate.
Policy Toward Supply Diversification: Oil Imports and Electric Utility Companies
By the mid-1970s, concern for environmental matters was swamped by the oil price jump of 1973-74. Japan had increased its oil imports more than ten-fold between 1960 and 1973,6 and was deeply concerned about its heavy reliance on Middle East suppliers. In this context, stability of supply was of special concern, since disruption was the least tolerable outcome for an import-dependent nation.
MITI initiated a series of policy actions that were designed both to diversify supply sources, and even more importantly, to reduce reliance on oil imports. For the electric utility sector, an already ambitious nuclear program was accelerated, coal use expanded (from suppliers as diverse as the United States, Canada, Australia, and South Africa), and LNG imports
6
Joseph A. Yager with Shelley Matsuba, The Energy Balance in Northeast Asia, The Brookings Institution, Washington, D.C., 1984, pp. 10-11.
were encouraged. All of these steps had significant impact on electric utility companies, but of special note was the LNG question.
A striking characteristic of Japan is that crude oil was (and is) burned directly in electric utility boilers. Therefore, any substitution of crude oil imports by LNG for that purpose would be considered desirable, especially if the price were the same and diversification of supply sources was attained. The supply diversification has been achieved with contracts
in place with Alaska (Cook Inlet), Brunei, Abu Dhabi, Malaysia, and Australia, and active discussions with Canada, Alaska (North Slope), Thailand, U.S.S.R. (Sakhalin), and Qatar will further proliferate supply points.
Because a significant policy goal was to reduce oil imports, cost minimization took a back seat to other factors. Thus, if LNG could be
imported at a price no higher than high-sulfur (or even low-sulfur) crudes, then the electric power company was largely indifferent from a cost
perspective. The rigidities of take-or-pay contracts and other problems were in part off-set by the environmental advantage LNG substitution gave
to the companies.
However, while the unique circumstances of the electric utility sector made them indifferent to this LNG contracting and price structure, we shall see later that the town gas companies were not to remain indifferent. But
for the present, all seemed well.
During the year following initial deliveries of gas from Brunei (1972), the first oil price shock occurred. After 1973, two new gas projects were initiated bringing LNG from Abu Dhabi, and more importantly, from
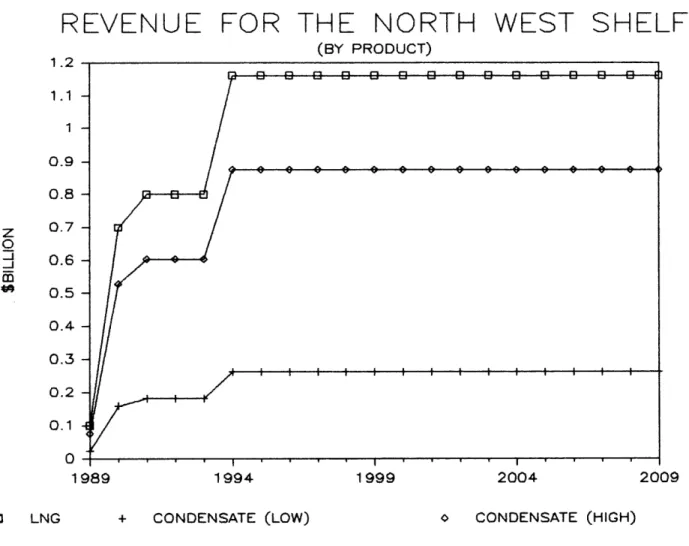
Indonesia. Including all Japanese imports of LNG through the Northwest Shelf Project (Australia), electric power companies have taken 78 percent of the total. This preponderant influence of the electric power companies has led to an LNG import policy with significant implications for future
LNG use.
The first effect of electric utility dominance arises from the
willingness to pay a c.i.f. price for LNG at crude parity. The apparent reasons for this are several. As mentioned previously, Japanese electric utility companies historically have burned crude oil directly under their boilers, so they are indifferent to a fuel whose delivered cost is nearly the same. Since the company is following a policy to reduce oil imports,
LNG use is seen as desirable. In addition, the long-term contracts for LNG
fit the long lead time style of this sector, and gives companies some sense
of supply security. By substituting LNG for oil, the utilities also
respond to air pollution concerns and thus are seen as good citizens.
But perhaps the most important reason for utilities' relative indifference to price is that LNG buys them time. Under the high take-or-pay requirements, electric utilities use LNG for
base-to-intermediate load generation. While installed nuclear capacity is built, a national interconnecting electrical grid is established, and
technology for clean utilization of coal is developed, LNG provides an
excellent interim solution for electric utility companies. Additionally, the national policy of minimizing oil imports and diversifying the number of nations supplying both oil and LNG is being advanced.
Current LNG Contracts: A Major Problem for Town Gas Companies
Unfortunately, what works for the electric utility company is a serious barrier to the major Japanese town gas companies, and eventually to those gas-producing nations that hope to export LNG to Japan. Recalling our earlier discussion about manufactured gas by town gas companies, it was evident that the only market available was that which could pay the highest prices: the residential customer and the chemical industry, which needed gas for feedstock. Now, the market expansion available to the town gas companies is primarily in the industrial and commercial sectors, though some modest residential growth may be expected. Prices of competing fuels are set by government policy and as can be seen in the following two
tables, LNG delivered by gas companies faces very rugged competition. Whether fuels competing with town gas/LNG are subsidized (either explicitly, or implicitly as kerosene has been in the past) will not be dealt with in this paper. However, it may be surmised that Japanese policy has been to discourage town gas expansion into markets traditionally held by suppliers of oil products (including LPGs). This interpretation of circumstances may be given weight by the decision in 1984 to place the same import tax on LNG as had been previously levied on crude oil and product imports.7 The combination of these factors has had a considerable negative impact on the growing competitiveness of town gas companies. It is an open question whether MITI policy intended this effect, but its consequences may be most serious--as will be discussed below.
7International Energy Agency, Energy Policies and Programmes of IEA Countries: 1984 Review, Paris, France, 1985, p. 322.
Table 1
Unit Price Trends of Energy in the Residential and Commercial Sector
Yen Per Thousand Kcal Kerosene LPG Electricity 2.17 3.47 4.48 5.39 9.34 9.87 10.86 10.10 6.47 11.40 13.91 14.61 19.24 21.32 21.83 22.00 14.64 17.44 21.56 21.43 28.06 28.10 28.10 28.10 Relative Indices City Gas 5.40 8.15 11.18 10.65 14.60 14.60 14.60 19.60 Kerosene LPG Electricity 1.0 1.0 1.0 1.0 1.0 1.0 1.0 1.0 3.0 3.3 3.1 2.7 2.1 2.2 2.0 2.2 6.7 5.0 4.8 4.0 3.0 2.8 2.6 2.8 City Gas 2.5 2.3 2.5 2.0 1.6 1.5 1.3 1.4
Source: Kazuo Furuto, "Kerosene Demand as Part of Total Energy Demand in the Residential and Commercial Sector," Energy in Japan, July 1983, p. 18, Table 4. 1983 figures are estimates from the Institute of Energy Economics.
0-fiscal year 1970 1974 1978 1979 1980 1981 1982 1983
Table 2
Comparison of Industrial Fuel Prices and Burner Tip Costs (Yen Per Thousand Kcal)
Fuel Prices Average 1981 1982 High Sulfur C = 100 1981 1982 1983 1983 Kerosene
High fuel oil A Fuel oil C High-sulfur heavy -fuel oil- C Industrial LNG Butane Coal 8.55 7.86 6.51 5.84 7.51 6.54 3.06 9.81 9.04 6.73 6.05 8.08 6.61 2.78 9.34 8.59 6.02 146 162 175 135 149 161 111 111 113 5.34 7.07 7.11 2.42 100 129 112 52 100 134 109 46 100 132 133 45 Burner-tip Costs Kerosene Heavy oil A* Low-sulfur C* High-sulfur C* Industrial LNG* Butane Coal* 8.72 8.12 6.84 6.36 7.70 7.22 6.37 9.98 9.30 7.06 6.57 8.26 7.29 6.09 9.51 8.85 6.35 5.86 7.26 7.79 5.73 131* 122 102 100 115 108* 95 152 141 108 100 126 111 93 162 151 109 100 124 133 98 *Mid-points of ranges.
Source: Naoto Sagawa, "Inter-energy Competition in Japan, the United States and Western Europe," Energy in Japan, November 1983, Table 3, p. 20. 1982 and 1983 figures are estimates from the Institute of Energy Economics.
Of course, the collapse of oil prices in early 1986 has had a variety
of impacts on LNG importation into Japan. First, because current LNG contracts are based on official selling prices, LNG prices are remaining higher longer than oil or oil product prices. This is a problem for all Japanese LNG users, but especially acute for town gas companies. Because there has been a relaxation of oil product imports to Japan (together with lower product prices from spot crudes imported by Japanese refiners), price competition for industrial and commercial users is becoming even more
difficult for town gas companies--and the problem will increase in
severity.
Another effect of falling crude prices is to highlight the problem of rigid take-or-pay requirements in LNG contracts. Any pause in demand cannot be met by reduced takes of LNG supplies. The obvious alternative for a Japanese importer would be to re-sell some portion of contracted
supply, perhaps to a new user, or to a user who had a peak demand counter
to the original importer. However, this alternative cannot be pursued because of a second problem: Current LNG contracts expressly prohibit the re-sale or transfer of LNG shipments. These two rigidities in current contracts increasingly cause difficulties for both electric utilities and
town gas companies, and increase the likelihood of LNG being perceived as a
fuel of significant risks and problems. Electric utility companies have alternative fuels to rely upon, but town gas companies may be more gravely affected.
Thus, if LNG is available to town gas companies at a crude oil price (whether official selling price or other basis) equivalent, the companies'
markets will be limited. Therefore, the amount of LNG the gas companies can absorb at that price will be severely constrained. Indeed, for the reasons described above, currently participating gas companies probably are nearing their peak absorption of LNG. Since it is unlikely that electric utility companies will have interest in new LNG projects for the reasons cited above, we thus now may be witnessing peak LNG utilization in Japan.
Of course, there are circumstances under which electric utility companies could increase their utilization of LNG. An internal study by ARCO Alaska pointed out that at a 3 percent growth in electricity demand, incremental supply between 1995 and 2000 would be 100 billion kWhs. Of this, half the supply is projected to be nuclear, and the other half from
coal, LNG, oil, or other sources. If the demand growth forecast is
correct, any slippage in nuclear schedules or coal plant construction would create potential increased demand for LNG. The study does not analyze the
fuel mix if oil prices continue to be weak.
While the possibility of increased electric utility use must be reckoned with, falling oil prices (and the contract problems mentioned previously) make it more likely that we are in fact seeing the peak of LNG utilization in Japan. If so, a potentially grave issue must be considered. If the following factors continue to exist, we may see the prospect of serious problems for the three major town gas companies:
1. Low oil prices and continued use of official prices for LNG pricing;
2. Rigid take-or-pay and no-resale terms in LNG contracts;
3. Explicit or implicit Japanese policy which works against expanded town gas utilization of LNG by industrial, commercial, and
4. LNG contracts pegged at c.i.f. oil parity.
Put simply, all town gas company growth since 1970 is directly
correlated to their increased utilization of LNG. While town gas is less
than 20 percent of all LNG imports, it now represents over 60 percent of
the total feedstock of the town gas companies--and is still growing. 8 If
LNG imports are constrained because of the four factors mentioned above, the gas companies could face quite serious feedstock problems. The dominant position of electric utility companies in LNG imports means the future flow of gas is dependent upon their needs. If electricity
generation grows with other fuels, town gas companies may face a no-growth situation or even declining sales.
While it may be extreme to suggest that company viability is
threatened, major problems are certainly possible. Until some method is worked out to free town gas LNG supplies from the rigidities of current
contracting practices, potentially serious problems loom. The current sharp drop in oil prices may bring these concerns into prominence much more quickly.
Summary
This discussion has shown how policy regulation of town gas companies has led to a fragmented industry that lacks the connections necessary to balance loads and make the most efficient national use of expensive
feedstock resources. Instead, high manufacturing costs, high storage costs
8
for LNG, and dependence on electric utilities for LNG projects have rendered further expansion most difficult. We also have seen how environmental regulations have affected the perspective of appropriate pricing for LNG resources. While the environmental issue remains
important, demand is seriously constrained at LNG prices equivalent to oil prices. Finally, we have examined how electric utility interests and contracting prices have established LNG price levels and contracting practices that limit the amount of LNG that will be used in Japan.
A NOTE ON KOREA
The Republic of Korea (Korea) situation offers an interesting potential contrast to Japan. Korea contracted with Indonesia for 2 million tons of LNG to commence deliveries in 1986, with a potential additional 1 mm tons per year by 1989-90. Original Korean plans were to follow the Japanese pattern of LNG use in electric power generation, thus backing out oil imports.
However, Korea now is reported to be considering an alternative policy for LNG utilization. Instead of use in electric power generation, the Koreans are evaluating conversion of oil-burning plants to coal to take advantage of very low-cost coal imports. As the following calculation
indicates (Table 3), the economics are attractive, and would be even more so if coal prices were lower.
Because the Koreans have already committed to the LNG deliveries, they are considering a strategy of town gas utilization of the LNG. This would involve a trunk gas pipeline of some 500 kilometers to reach potential
Table 3
Increased Costs of Conversion and Use of Fuel A 350 MW Generating Plant Using LNG and Coal as Two
Possible Alternatives to Oil
(6,000 Full Load Factor Equivalents p.a.) (U.S. $ thousands) Steam Coala LNG ($5.5/MMBtu) LNG ($4.5/MMBtu) Cost of Conversion:
Oil to alternative p.a.
Annualized cost of
UI1DE "scrubber:"
Capital Cost p.a.c Operating costs Operating costs in excess of oil-firing alternative Costs of fuel Totals
Cost per kWh (U.S. cents)
LNG "premium" 5,812 258 258 2,640 5,471 2,506 55,965.8 72,394.8 3.44 )d 102,358.4 102,616.4 4.88 1.44 )d 83,748 84,005 4.0 0.56
SOURCES: ELSAM, 1982. Interviews: Vestkraft, Esbjerg; Jysk-fynske elsamarbejde (ELSAM), Fredericia, Denmark. Gas efficiency factor from Medici (1974). The
use of Danish data in this table is due to an inability to acquire the relevant
material from Japan. The Danish electrical industry has achieved a wide reputation for its efficiency and for ease of information access, which makes it an "ideal" shadow price case for the Japanese electrical industry. It is likely that these Danish estimates are low in comparison to estimates elsewhere and in Japan. NOTES: aAverage c.i.f. September 1982: $64.02/metric ton; 6,500 kcal/kg 3%
less efficiency than fuel oil.
bCost of conversion estimated at $52.9 million for coal, $2.36 million for natural gas. Annualized even payments over 15 years principle and interest. 7% interest.
CCapital costs of UHDE "scrubber:" $24.1 million. Amortized as with cost of conversion.
dThere are operating cost savings not entered here. See text for
explanation. It is assumed as well that LNG has 10% more boiler
efficiency than oil.
industrial base-load customers in the southern peninsula (Ulsan, Pusan, etc.) and a distribution system for tying in residential and commercial customers en route in Seoul, ChunChon, Taegu, Pusan, etc. This would encompass a majority both of the population and of the commercial stock in
the country.
While no published estimates of cost currently are available, such a policy and utilization pattern would appear attractive. It would allow LNG to be treated as natural gas, including a full range of sector pricing from premium residential to base-load industrial. If LNG exporters understand that LNG would be treated as natural gas in Korea (which they appear not to with respect to Japan), then Korean demand could be substantial.
PRODUCING COUNTRY POLICY
The preceeding sections have reviewed the circumstances affecting natural gas use in Japan (and Korea). Market conditions have changed
rather drastically over the last 15 years, and the oil price falls over the last 3 months suggest that the changes are still occurring.
One conclusion that seems inescapable is that c.i.f. oil parity priced LNG projects will not find a future market in Japan. The only circumstance in which this would occur is a substantial shortfall in planned nuclear or coal electricity generation capacity expansion. Such a situation could then create an additional call on LNG for such base-loading plants--at least for some interim period.
As indicated in this review, and in the Demand paper by Arthur Wright,
electric utility sector. The town gas companies offer the potential for major expansion, but not under the pricing and take-or-pay conditions of
previous contracts. Additions to gas distribution infrastructure are costly, and the interfuel competition severe--especially with falling or unstable oil prices. Several implications are clear from this situation, and are ones which must be faced by current and/or potential exporters of
LNG.
In view of the future potential markets in East Asia, some serious rethinking of LNG pricing is in order. With contract price references being turned upside down by the oil market, previous fears about existing contract structures being threatened by new contract arrangements are now moot. Any profitable export scheme should be considered on its own merit,
unless there is a more profitable domestic utilization project available. Because the future of LNG prices is so uncertain, two other producer policies should be carefully examined. National policies toward royalties and taxes were shaped during an era of increasing prices, and are clearly
no longer appropriate for lower and unstable price movements. The kind of flexibility demonstrated by recent Canadian gas policy suggests a more appropriate policy for the next several years of LNG trade. Otherwise, new investment planning by producing companies will be adversely affected.
The second matter is the question of discount rates. With the value of gas in the ground so uncertain, then higher discount rates should be
utilized than those thought appropriate in the 1970s and early 1980s. Such a change will not make an uneconomic project worthy, but may change
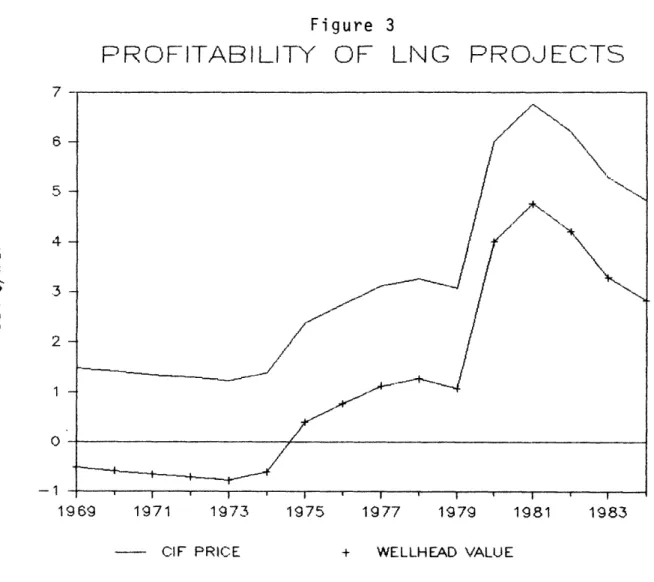
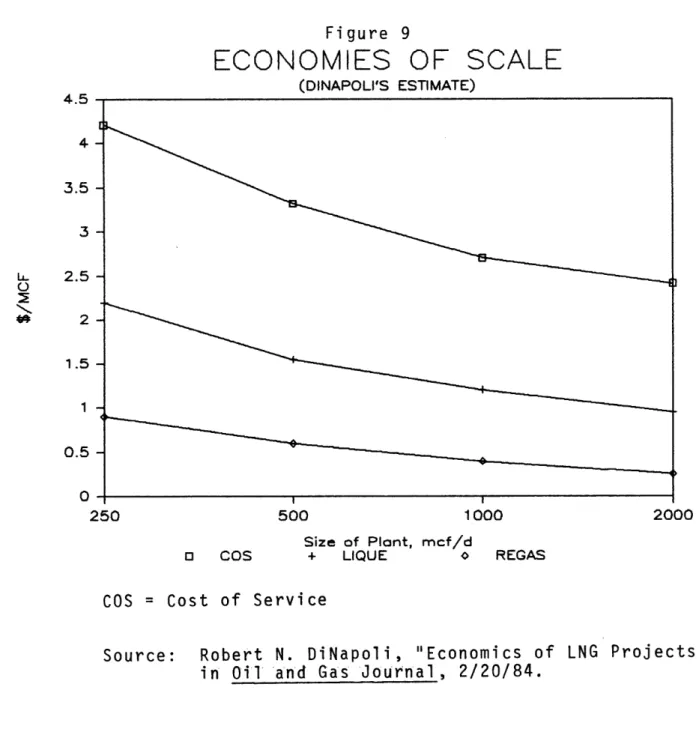
Finally, as will be recalled from the discussion of the Alaska and Brunei projects, c.i.f. prices were less than $1.00 U.S. in current
dollars. Either there has been no technological progress at any stage of the LNG "chain," including liquefaction facilities, ocean transport, storage and regasification, or some other set of events have gravely affected cost reductions in this process. One suspects that some of the events affecting cost have been rent-taking by engineering/construction firms and suppliers, labor, government (through taxation), and producing companies--all of whom perhaps have a rate-of-return expectation no longer appropriate to future LNG projects.
Other papers in this project examine the issues of supply costs and demand under alternative prices. Regardless, it is clear that either the era of LNG has ended, or a second LNG era with a new perspective is about to emerge. Policy makers in producing countries and Japan must be prepared to examine and, when necessary, discard old perceptions and practices.
BIBLIOGRAPHY
Davis, J.D., Blue Gold: The Political Economy of Natural Gas, George Allen
& Unwin, London, England, 1984.
Furuto, Kazuo, "Kerosene Demand as Part of Total Energy Demand in the Residential and Commercial Sector," Energy in Japan, July 1983.
Gresser, Julian, Koichiro Fujikura, and Okio Morishima, Japanese Environmental Policy: A Comparative Assessment, The M.I.T. Press, Cambridge, Massachusetts.
International Energy Agency, Energy Politics and Programmes of IEA Countries: 1984 Review, Paris, France, 1985.
Ohashi, Tadahiko, An Analysis of the Future of Natural Gas in Japan, Tokyo Gas Company, Tokyo, Japan, 1985.
Peebles, Malcolm W.H., Evolution of the Gas Industry, New York University Press, New York, New York, 1980.
Sagawa, Naoto, "Inter-Energy Competition in Japan, the United States, and Western Europe," Energy in Japan, November 1983.
Yager, Joseph A. with Shelley Matsuba, The Energy Balance in Northeast Asia, The Brookings Institution, Washington, D.C., 1984.
Arthur W. Wright
INTRODUCTION
Strategic Issues in Pacific-Basin Demand for Natural Gas
Compared with North America, the U.S.S.R., and Western Europe, the
Pacific Basin is still a young market for natural gas. Production and use
of natural gas date only from the late 1960s, and in earnest only from the
mid-1970s. The region has, of course, been undergoing rapid economic growth and structural change. If the recent pace of economic progress continues through the end of this century, we might expect to find the Pacific-Basin gas market considerably more mature by the year 2000.
Economic progress will not, however, be the only determinant of the course of this market over the next fifteen years. Institutional factors will also play a central role.1 Two in particular--how the overall market
is organized, and the way the individual participants in the market choose
to make decisions--will be very important. Other chapters in this report discuss institutional factors (e.g., those on supply, contracts, and government policies). But these factors are especially important for understanding gas demand in the Pacific Basin.
The future of gas demand depends on complex strategic decisions made under considerable uncertainty. Much new gas demand can occur only if energy consumers install expensive, durable gas-using equipment. Decisions
supplies, which themselves entail large investments not easily converted to other uses if proven unsound. Both demand and supply decisions hinge on what people expect gas prices to be, or (perhaps more important) how they
expect them to be formed (for instance, in relation to oil prices). These decisions also are contingent upon governmental permissions to proceed with projects. Governmental decision making is often an important source of
uncertainty in its own right.
This complex of decisions is not unique to the Pacific-Basin gas market. What sets this market apart from the other major international markets is that its trade flows consist exclusively of liquefied natural
gas (LNG). Technologically, this characteristic of the Pacific-Basin
market is the mere product of geography and geology. Economically,
however, the "LNG factor" has made a real difference in the evolution of
the market to this point. A critical role has been played by the
institutions that have grown up for trading LNG.
These institutions were born of the world oil price shocks of the 1970s. True, it was the higher real energy prices, plus expectations that they would go yet higher, that made many LNG projects economically viable. But the atmosphere of scarcity that prevailed at the time meant that LNG was viewed as one of the "premium" fuels that could close the "gap" as precious oil supplies ran out. Government price and import policies toward oil made it acceptable to pay the premium for LNG. Not surprisingly, it was thought only right and natural that LNG prices should be tied firmly to oil prices. Moreover, many governments (not trusting world energy markets and worried about security of supply) involved themselves directly in
negotiating and even undertaking LNG ventures. As a result, LNG contracts were treated as matters of high national policy.
Times, and attitudes, have changed in world energy markets. Several LNG contracts have gone sour in North America, but the ramifications have been limited--contract litigation for one interstate pipeline, Chapter 11 bankruptcy for one LNG importing firm. No existing deals in the Pacific Basin have yet been broken, but the actual impact of the changes in world energy markets has been greater there because of the dominance of LNG in gas trade. This is especially true of prospects for future growth of natural gas demand in the region. The magnitude and geographic pattern of demand growth will depend crucially on the answers to questions like, "How will LNG be priced?," "Will different contract forms emerge?", and "Can people form the stable expectations that will be required if Pacific-Basin
trade in LNG is to expand?"
If nothing much changes in the institutions for trading LNG, we should not expect much growth in demand for natural gas in the Pacific Basin. If, however, LNG comes to be priced more independently--not uncorrelated with oil but not tightly indexed, either, and not on an exact thermal-equivalent basis--and if the market's actors (including especially governments) are willing to consider more flexible contract forms, international trade in natural gas in this region will grow more in accordance with the bright prospects for overall economic progress.
Actors in he Pacific Basin Market for Natural Gas
The demand side of the Pacific Basin gas market consists of Japan and The Rest--a group of much smaller users, singly and collectively, actually and potentially, than Japan. Japan is by far the dominant factor on this side of the market, to the point of possessing considerable potential monopsony power.2 The Rest, which include Korea, Taiwan, Hong Kong,
Australia, and Thailand, are not without interest or significance. The group counts among its numbers several rapidly growing economies, and two of them are potential producer-exporters as well as consumers of natural gas. Nevertheless, Japan now represents the bulk of Pacific-Basin gas demand and (under any plausible set of assumptions) will continue to do so at least through the end of this century. Even unusually rapid demand growth among The Rest will only cut into, not end, Japan's dominance.
Thus, it is no exaggeration to argue that, as Japan goes, so goes Pacific Basin trade in natural gas. (The same would be true for coal and oil, though to a lesser extent in the latter case because of the better organized world market). For this reason, we shall focus in this chapter primarily on the demand for natural gas in Japan. Before taking up the Japanese case, however, it is well to examine briefly The Rest of the actors in the Pacific Basin market for natural gas.
The Rest of the Market in Brief
Korea and Taiwan have recently been among the economic (and , industrial) growth leaders of the world. Of the two, Korea is the more
likely to play a visible role in Pacific Basin gas trade over the next fifteen years, merely by virtue of having already signed a contract to import LNG. The imported LNG is to be used in electric power generation. Outside analysts have suggested that Korea could make more effective use of this gas in industry, and instead generate power with coal. This strategy would, however, require large investments in gas distribution and
combustion equipment--investments of the kind that the Korean government is currently reluctant to sanction because of the pressure it would place on its net foreign borrowing situation. A careful analysis of this set of
issues is beyond the scope of this chapter. Here, we simply note the interesting possibility that Korea could become quite a bit more of a factor than it is at present in Pacific Basin gas trade, but that for this to happen would require changes in domestic economic and financial policies that are not now in prospect.
Thailand and Australia both have domestic natural gas resources. Australia will shortly become an active seller in Pacific Basin gas trade and is counted among the modern industrialized nations of the world.
However, Australia's exportable gas is on the Northwest Shelf, too far from the populous and developed southeast to compete with central Australian gas reserves; and the southwest Australian market will not put a very big dent
in LNG exports. Thailand is aggressively pursuing economic growth; however, even with rapid economic growth and intensive domestic use of natural gas, Thailand will not make much of a difference in total Pacific Basin gas demand for some years.
Finally, Hong Kong has long been a vibrant economic force in eastern Asia, far out of proportion to its tiny size. That very size, however, restricts the potential significance of any gas demand growth for the
broader regional market. In addition, the uncertainties growing out of the transfer to the Peoples Republic of China at the end of this century are likely to put a damper on the growth of the Hong Kong economy, and on growth in the demand for natural gas, over the period covered by this study.
Outline of the Remainder of the Chapter
The first step in understanding Japanese gas demand prospects for the period 1985-2000 is to define some terms and develop certain concepts that
will be used throughout the remaining discussion. This we do in the
section immediately following.
Directly following that, we briefly consider several special features of the Japanese case. These special features derive from those of LNG, discussed earlier. Most of Japanese gas use, and all of any future increments, (1) consist of LNG that (2) is imported. A third special feature is the way LNG is priced. Prospects for significant growth in demand over the next fifteen years hinge on whether this third special feature changes and (if so) how.
The ensuing material gets down to cases. These are presented in
alternative-scenario format, reflecting the two quite different world views that lie behind them. We term the first scenario the "consensus view," referring to the broad agreement among government officials and many business representatives that the fate of Japanese purchases and uses of LNG from now until the year 2000 has been largely settled. In contrast, the second scenario--labelled the "dissenting view"--considers the
conditions necessary for Pacific Basin gas trade to expand significantly over the next fifteen years. Obviously, for this to happen Japanese gas
demand must grow faster than is foreseen in the consensus view. Two -9
prerequisites, though, are (1) that the relative price of LNG decline enough to permit greater penetration of industrial markets; and (2) that Japanese decision makers (public and private) respond appropriately to the decline. Of course, decision makers (public and private) in the
LNG-supplying countries must also reconcile themselves to the lower returns
-that would go with a lower relative LNG price.
The chapter concludes with a summary and a recap of the main conclusions.
THE NATURE OF DEMAND FOR NATURAL GAS Economic Demand Functions for Gas
Throughout this chapter, the "demand" for gas will refer to a function relating different quantities demanded by purchasers to different prices charged by sellers. Typically, one or more "shift parameters" will (if varied) increase or decrease the entire function. The central shift
parameter in gas demand functions is the price of the competing oil product
(e.g., residual fuel oil). Other shift parameters are household income, user equipment stocks and prices, technologies, and people's preferences
(or "tastes").
By postulating that individuals or firms behave rationally, we can deduce that demand curves "slope downward": At low prices, greater amounts of a given good will be demanded than at higher prices--holding constant the various.shift parameters. As a rule, quantity demanded will respond more to a given price change in the long run than in the short run. The shift parameters tend to be fixed in the short run but variable in the long run. If a price changes suddenly, purchasers' short-run quantity responses will be restricted in scope. With time, however, that scope will broaden as long-run changes--in people's tastes, end-use equipment, technologies, purchases of complementary goods, and so on--occur.
No discussion of economic demand functions for natural gas in the mid-1980s would be complete without paying some attention to changes in world oil prices. We noted above that the price of the competing oil product is typically the "central" shift parameter in gas demand functions: An
increase in oil prices will increase gas demand, and vice versa. The magnitude of the effect of a given change in oil prices will differ,
depending on people's expectations about the permanence of the change. If they expect it to last, the effect on gas demand will be greater than if the change is viewed as transitory.
With the benefit of hindsight, it appears that many people thought the oil price increases of the 1970s were permanent. Otherwise they would not have locked themselves into gas contracts with price and other terms set at "premium" levels and tied to oil at or near thermal parity. We now (March 1986) know that oil-price expectations should be based on volatility, not continual increases. Therefore, energy users will tend to add a risk premium to oil prices that will at least partly cushion the decline in gas demand owing to falling oil prices. Further, expectations based on oil-price volatility should lead to different contract forms for trading
natural gas. In particular, we should expect greater reliance on flexible-price contracts, with flexible-price referents much more loosely tied to oil.
Note that the reduced demand for natural gas caused by falling oil prices will be offset somewhat by supply-side macroeconomic expansion throughout the world induced by lower energy prices. This expansion will be the obverse of the negative supply-side shocks to aggregate world output caused by the oil-price increases of the 1970s.
"Final" and "Derived" Demands
There are various categories, or customer classes, of gas demand, depending on the customer's specific end use. Only residential demand for
gas is final as opposed to "intermediate" on the scale of human
consumption. Commercial, industrial, and electric-utility demands are, in economic argot, derived from the ultimate demands for goods produced with the gas. Both kinds of demand still depend, short- and long-run, on the
price of gas. But the price often differs by customer class, and the other arguments in the demand functions differ as well.
For residential gas demand, the prices of near substitutes--mainly distillate fuel oil ("No. 2") and increasingly electric power--are
important shift parameters. Household income is also an argument, as is user equipment: in the short run, the stock itself, and in the long run, the prices of equipment. Government policies may affect residential demand for gas, too. In Japan, for instance, government subsidies to kerosene may have retarded the growth of residential gas demand.
The derived demands of commercial, industrial, and electric-utility customers do not depend on income, except indirectly in the aggregate through its effect on final-goods demands. Stocks of equipment and
technology are important arguments of these demands. The long-run decision
to install "dual-fuel" (gas and oil) capability (or more rarely, in the
case of coal, to maintain spare combustion capacity) makes fuel switching a short-run possibility. For most commercial demands, relevant substitutes include distillate fuel oil or electric power. Industrial users can
substitute either distillate or residual fuel oil, depending on the
application; substitution in most feedstock uses is limited in the short run, because of design complexities in chemical processes. Electric
utilities view residual fuel oil as the effective short-run substitute fuel for natural gas. Coal (base load) and distillate fuel oil (peaking) are long-run substitutes, as of course are nuclear, hydro, pumped storage and other non-fossil-fuel forms of generation. Finally, public policies may also affect derived demands for gas--viz., regulation of the siting of nuclear plants and restrictions on sulphur emissions.
The different categories of gas demand tend to have different marginal values in use, given a particular market equilibrium. The differences trace to the supply prices (costs of provision) of acceptable alternatives,
whether it be rival fuel/energy systems or substitute processes or final
goods. Homeowners, for example, can heat with distillate fuel oil, gas, or electricity (coal is no longer widely acceptable); or they can wear extra layers of clothing, learn to enjoy ambient temperatures of 60 degrees F.
(15 degrees C.), or move to a warmer climate. Electric utilities, in
contrast, may find coal a quite acceptable alternative to natural gas for
raising steam, even if expensive scrubbing is required for environmental reasons,.
Broadly speaking, residential (R) and commercial (C) gas demands are less responsive to variations in price than are industrial (I) and
electric-utility (EU) demands. We say that R and C are less
"price-elastic" than I and EU demands: For a given percentage change in price,
the percentage changes in quantities demanded for R and C use are
relatively smaller than are true of I and EU uses. R and C demands are
sometimes labelled "captive," suggesting that homeowners and shopkeepers are prisoners of capital outlays that represent a large fraction of their
total costs of gas use. There are, of course, exceptions. Some very large commercial gas customers (e.g., apartment houses) find it worthwhile to
invest in fuel-switching capability. And certain industrial customers--e.g., petrochemical producers and some firms using process heat--employ
techniques designed expressly for natural gas. Thus, they have less elastic demands than the "penny-switchers" who swing from gas to residual
fuel oil and back in response to relative-price movements of as little as a penny per million Btu (MMBtu).
These seeming arcana of natural gas economics are important to understanding how gas markets operate under various conditions. Differences in marginal use-value and price elasticity across market
segments imply the existence of distinct ranges in the total demand curve in a given gas market. Figure 1 depicts a stylized market for natural gas at end-use. The highest demand prices and steepest slopes occur in the
region labelled "R+C" (for residential and commercial). Next comes the region of industrial demand (labelled "I"), followed by that for electric
utilities' demands (labelled "EU"). The range of the R+C region of the demand curve below where the I region begins is not relevant: No seller
will sell gas for R+C use if I-use will fetch a better price. This is
similarly true for the range of the I region below where the EU region
begins.
Exactly where on the demand curve a given market will "clear"--where, in other words, the supply to that market intersects the demand--is of considerable importance to gas marketing decisions. A price-taking (or price-regulated) seller of gas will realize greater revenues, other factors
constant, if the market clears in the R+C range than in the I or EU range
of the demand curve. (Absent government regulation, price discrimination
may be feasible in natural gas sales because of the high cost to most
customers of reselling purchased gas. Where scale economies exist [e.g., in large-diameter pipelines], price discrimination--in inverse proportion to the customers' price elasticities of demands--is even desirable from the standpoint of economic efficiency.)
Not long ago, natural gas was regarded as a "premium" fuel in many
parts of the world--North America (except on the Gulf Coast), Western Europe, Japan (but not in the U.S.S.R.)--because incremental units of gas
I331
d
-,, cO) EZ
z
i i i I idelivered to many markets fetched R+C prices. Today, people have begun to
view it more as a "blue-collar" fuel that will clear in the I range
(against residual fuel oil) or even (in the long run) in the EU range
(against coal)--in the process opening up new markets to natural gas. This view is now common in North America, and to a lesser extent in Western Europe. In the Pacific Basin and especially in Japan, however, gas (derived from LNG) is still a premium fuel. Whether this will change depends (as we have noted) on institutional as well as economic factors.
NATURAL GAS DEMAND IN THE JAPANESE POLICY SETTING The LNG Factor at Work
Natural gas decision making in Japan illustrates well our earlier assertion that Pacific Basin gas trade differs from other international gas
markets because it is conducted exclusively in LNG. Flows of the good in
Japan are organized in the familiar discrete, vertically integrated projects consisting of liquefaction, special transportation, and
storage/regasification. More important, however, the purchase and use of LNG are bound up with government import policies, because Japan imports virtually all of its primary energy other than hydroelectric power. Environmental concerns lay behind the initial introduction of LNG into
Japan in the late 1960s. By the mid-1970s, however, the policy focus had
shifted, following the Arab oil embargo and the oil price shock, to the displacement of oil and the diversification of both types and sources of energy.
The political concern for security means that the Japanese government intervenes actively to influence with whom LNG deals are negotiated.
Japanese government has a stake in protecting their financial viability, if necessary by intervening in pricing and even allocation decisions.
Combined with the inherent clumsiness of LNG technology, the result is a rigidly structured set of arrangements for making decisions about buying and selling LNG.
These arrangements do not operate through the competitive market forces of conventional economic analysis. Market forces are of course one
constraint, because most of the operatives in LNG (as well as other forms
of energy) are private entities that do not willingly incur losses. But to understand the Japanese demand for natural gas--its past evolution and future prospects--one must keep in mind that government policies also constrain the decisions made.
Two Competing Views of the Future of Natural Gas in Japan
Natural gas has in a short space of time become a major factor in the
Japanese energy picture. This has happened under the aegis of the combined economic and political system just outlined. Among the majority of the participants in this system--the government agencies who have overseen the rapid rise of natural gas, and the business firms (virtually all of them electric and gas utilities) who have carried it out--there seems to be a consensus about the future prospects for natural gas in Japan. The major published forecasts all seem quite similar, as we shall see. Subject to
minor differences of emphasis, the consensus is that natural gas will
continue to grow in the future but at a noticeably slower pace than over the past decade or so. Implicitly, holders of the consensus view assume that the existing institutions, which succeeded in managing rapid growth, will prove equally successful at managing the more modest future pace.
A dissenting view is that it would be possible, and economically advantageous, to have considerably faster future growth of natural gas in Japan than the consensus scenario entails. Proponents of this more
optimistic scenario range from academic gadflies to representatives of Japanese construction firms (and foreign owners of rights to gas supplies) who chafe under the constraints that (in their view) the existing system
places on gas growth. Central to the dissenting view is the notion that change is abroad in world gas markets. Since about 1980, these markets (along with those for other energy goods) have gone from being supply-constrained to being demand-supply-constrained. To take advantage of this change,
the dissenters argue, Japan will have to alter its approach to LNG deals,
perhaps even its attitude toward the core issue of energy import security. Failure to adopt new tactics to take advantage of the change will be costly and may even place Japan at a disadvantage in world LNG trade. Not
altering present institutions and policies will certainly stifle the investments (e.g., in infrastructure for moving gas around once it is
landed) required if natural gas is to realize its full potential in the
Japanese economy.
These two competing views of the future of natural gas in Japan are
the vehicle for the remaining discussion in this paper.
SCENARIO I: THE CONSENSUS VIEW
Development of Gas Use in Japan
As in Europe and North America, the original gas business in Japan consisted of "town" or "city" gas, which was manufactured from coal or LPG and used for lighting and cooking. The town gas industry tapped into what few indigenous resources of natural gas Japan possesses, but they are small
enough to be negligible by present standards, which include the large-scale
importation of LNG.
The LNG era began in the late 1960s, prompted (as already noted) by
concerns for air quality. As Table 1 illustrates, however, the second and larger wave of LNG contracts followed the disruptions in the world oil market in 1973-74. These new contracts diversified Japan's sources of LNG, adding three new suppliers. The latest round of new contracts added
another (Australia), and prospective contracts (with Thailand and the U.S.S.R.) would continue the pattern. The goal of diversification is openly stated,3 and one source refers to a "MITI ban on extra LNG dependency on Indonesia"4 (currently the largest single supplier) as a reason for turning to Australia and (at the time) Canada.
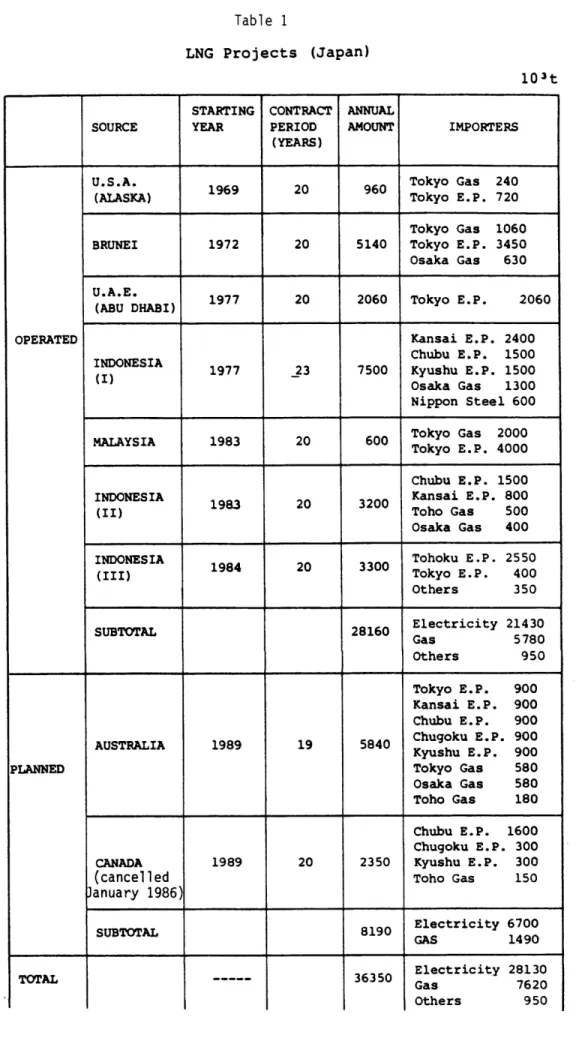
The existing and planned LNG projects all exhibit the familiar
discrete, lumpy form--vertically integrated from field to burner tip, with continuous-flow "take-or-pay" provisions and seller restrictions on end-use written into the contracts. With two minor exceptions (involving 3.4
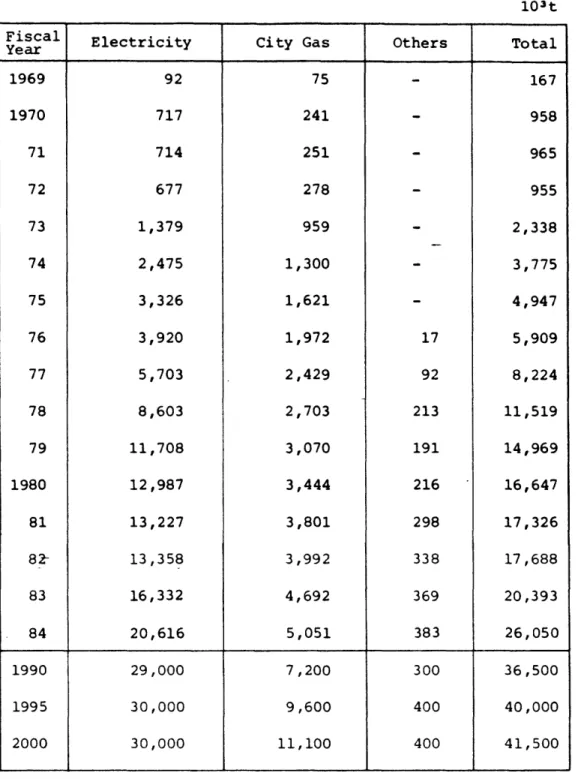
percent of total contract volumes), all of the contracts have been signed by large electric utilities and the "big three" town gas companies (Osaka Gas, Toho Gas and Tokyo Gas). Table 2 shows how heavily these two groups of producers have dominated the importation of LNG into Japan. Table 3
shows the rapid increase in the use of LNG in electric power generation,
and Table 4 illustrates how the importation of LNG has penetrated the city gas industry. Note that the increase between 1970 and 1983 in the use of LNG to produce city gas roughly equals the increase in total city gas sales over the same period.
All of this activity has been set up in "supply-mode" rather than
Table 1 LNG Projects (Japan) 103t SOURCE U.S.A. (ALASKA) BRUNEI U.A.E. (ABU DHABI) INDONESIA (I) MALAYSIA INDONESIA (II) INDONESIA (III) SUBTOTAL AUSTRALIA CANADA (cancel led January 1986 SUBTOTAL STARTING YEAR 1969 1972 1977 1977 1983 1983 1984 1989 1989 CONTRACT PERIOD (YEARS) 20 20 20 23 20 20 20 19 20 ANNUAL AMOUNT 960 5140 2060 7500 600 3200 3300 28160 5840 2350 8190 36350 IMPORTERS Tokyo Gas 240 Tokyo E.P. 720 Tokyo Gas 1060 Tokyo E.P. 3450 Osaka Gas 630 Tokyo E.P. 2060 Kansai E.P. 2400 Chubu E.P. 1500 Kyushu E.P. 1500 Osaka Gas 1300 Nippon Steel 600 Tokyo Gas 2000 Tokyo E.P. 4000 Chubu E.P. 1500 Kansai E.P. 800 Toho Gas 500 Osaka Gas 400 Tohoku E.P. 2550 Tokyo E.P. 400 Others 350 Electricity 21430 Gas 5780 Others 950 Tokyo E.P. 900 Kansai E.P. 900 Chubu E.P. 900 Chugoku E.P. 900 Kyushu E.P. 900 Tokyo Gas 580 Osaka Gas 580 Toho Gas 180 Chubu E.P. 1600 Chugoku E.P. 300 Kyushu E.P. 300 Toho Gas 150 Electricity 6700 GAS 1490 Electricity Gas Others 28130 7620 950 OPERATED PLANNED TOTAL
-Table 2 LNG Use by Sector 103t Electricity 92 717 714 677 1,379 2,475 3,326 3,920 5,703 8,603 11,708 12,987 13,227 13,358 16,332 20,616
29,000
30,000
30,000
City Gas 75 241 251 278 959 1,300 1,621 1,972 2,429 2,703 3,070 3,444 3,801 3,992 4,692 5,0517,200
9,600
11,100
Others 17 92 213 191 216 298 338 369 383 300 400 400Sources: Synthetic Energy Statistics Japan Gas Association
of Japan (MITI)
D1'//33
Fiscal Year 1969 1970 71 72 73 74 75 76 77 78 79 1980 81 82 83 84 1990 1995 2000 Total 167 958965
955 2,338 3,775 4,947 5,909 8,224 11,519 14,969 16,647 17,32617,688
20,393 26,050 36,50040,000
41,500
0
00DLOL00
00O
00 000 oLn cn I - o Cn L:r O C-4 e M 0D, LO 03 e - ¢ m o Xoo ) rM
ooo 5ot;o
oc-
o
COci
CO - LA O C\j C M t- .-cn ^ ^ - C C 0 oo -4 a o N Or- OCD000'DODC C N Or- r- -¢0 M LA) r- 0 C o _ c r cO r- c" w _N . 0 ^ _J oo o c M kD CN OCO ' c0 IrO CO' cn L- Mr-c0 r-O0'