HAL Id: hal-02433375
https://hal-normandie-univ.archives-ouvertes.fr/hal-02433375
Submitted on 20 Jan 2020HAL is a multi-disciplinary open access archive for the deposit and dissemination of sci-entific research documents, whether they are pub-lished or not. The documents may come from teaching and research institutions in France or
L’archive ouverte pluridisciplinaire HAL, est destinée au dépôt et à la diffusion de documents scientifiques de niveau recherche, publiés ou non, émanant des établissements d’enseignement et de recherche français ou étrangers, des laboratoires
A quantitative estimate of English Channel water fluxes
into the North Sea from 1987 to 1992 based on
radiotracer distribution
P. Bailly Du Bois, J.C. Salomon, R. Gandon, P Guegueniat
To cite this version:
P. Bailly Du Bois, J.C. Salomon, R. Gandon, P Guegueniat. A quantitative estimate of English Channel water fluxes into the North Sea from 1987 to 1992 based on radiotracer distribution. Journal of Marine Systems, Elsevier, 1995, 6 (5-6), pp.457-481. �10.1016/0924-7963(95)00018-K�. �hal-02433375�
Journal of Marine Systems 6 (1995) 457-481
A quantitative estimate of english channel water fluxes into the
North Sea from 1987 to 1992 based on radiotracer distribution
P. Bailly du Boisa, J.C. Salomonb, R. Gandonaand P. Guegueniata
a: IPSN-CEA, Laboratoire de Radioécologie Marine
rue Max Pol Fouchet, B.P. 10, 50130 OCTEVILLE
b: IFREMER, BP 70, 29280 Plouzané, France
Received 28 February 1994; accepted 26 October 1994
Correspondence:
P. Bailly du Bois Tel. direct: (33) 33 01 41 05 Laboratoire de Radioécologie Marine (LRM) Tel. secretary (33) 33 01 41 00 IPSN-CEA FAX: (33) 33 01 41 30 rue Max Pol Fouchet
B.P. 10
50130 OCTEVILLE
A QUANTITATIVE ESTIMATE OF ENGLISH CHANNEL WATER FLUXES INTO THE NORTH SEA FROM 1987 TO 1992 BASED ON RADIOTRACER
DISTRIBUTION
P. Bailly du Bois, J.C. Salomon, R. Gandon and P. Guéguéniat
Institut de Protection et de Sûreté Nucléaire
Département de Protection de l'Environnement et des Installations Laboratoire de Radioécologie Marine (LERFA)
IPSN-CEA, 50444 Beaumont Hague Cedex
ABSTRACT
Seven oceanographic campaigns carried out in the North Sea between July 1987 and January 1992 by the Marine Radioecology Laboratory (LERFA) of La Hague have led to the drawing up of general maps showing the distribution of the radionuclides 125Sb, 137Cs, 134Cs and 99Tc in seawater. In this way, the total amounts of radioactivity
(inventories) present in the southern North Sea were evaluated from each separate campaign, thus leading to an assessment of the mean distribution of water masses, originating from the English Channel, which flow between the Straits of Dover and the Skagerrak. On this basis, it is possible to link the flux of radionuclides released from the nuclear fuel reprocessing plant at La Hague (125Sb and 99Tc) with the inventories of
radiotracers observed in the southern North Sea. Hence, the most probable mean transit time of Channel waters entering the North Sea were calculated for each campaign; Channel waters take 110-152 days to flow from Cap de la Hague to the Straits of Dover, and 170-250 days to travel from there to the entrance of the Baltic. The water flux through the Straits of Dover is estimated to lie in the range 97000-195000 m3/s for the period between January
and July 1988. Very good agreement is found between the activities measured at different times and the results of a model simulating the hydrodynamic behaviour of the North Sea.
INTRODUCTION
Artificial radionuclides occurring as dissolved species in seawater are useful tools in oceanography, especially when the element concerned exhibits a conservative behaviour. The concentrations of such elements can be measured at extremely low levels, while the known characteristics of their source terms make it possible to trace the movements of radiolabelled water masses.
In particular, the large number of radiotracer studies undertaken in the North Sea have made use of 137Cs, 134Cs, 90Sr, 125Sb and 99Tc. These artificial radionuclides are
mainly derived from the controlled releases of nuclear fuel reprocessing plants into the Irish Sea (Sellafield, U.K.) and the middle of the Channel (La Hague, France), but are also present in the fallout from atmospheric nuclear tests (Kautsky, 1973, 1976 and 1988; Jefferies et al, 1982; Jefferies and Steele, 1989; Mitchell and Steele, 1988; Guéguéniat et al., 1993; Hermann et al., 1994). The accident at the Tchernobyl nuclear power station in 1986 led to diffuse fallout over the whole North Sea area, with a significant labelling of137Cs and
134Cs in waters flowing out of the Baltic at the Skagerrak (Nies and Wedekind, 1988;
Bailly du Bois et al., 1993).
By combining the radioactivity measurements with data concerning currents, salinity and temperature, it has been possible to characterize the overall circulation pattern of
3
water masses in the North Sea; a particularly well defined situation in 1988 enabled the drawing up of a detailed map showing the distribution of the four main water masses penetrating the North Sea at that time (Bailly du Bois et al., 1993). A further aim has been to evaluate the renewal time and flow parameters of these water masses by linking the activity distribution measured at sea with the variation of industrial releases with time (Kautsky, 1973; Guéguéniat et al 1994).
To link quantitatively the time fluctuations of releases with the spatial distribution of radioactivity
Since the distribution of radiotracers at sea is very sensitive to weather conditions, the above approach is problematic and the results are not often to reproducable. For this reason, it was decided to associate the observed qualitative variations of activity at sea with the quantitative data used to make a direct correlation between the flux of radioactive tracers released from industrial sources and the actual inventories measured in the environment. To be valid, this experimental protocol needs to be based on activity measurements from samples representative of the entire water mass - both at the surface and at depth - and which make up a detailed coverage of the study area. Moreover, in order to link the time fluctuations of releases with the spatial distribution of radioactivity, the most usual transport paths of labelled water masses should be well established.
This type of information can only be acquired by means of several campaigns carried out under similar conditions in order to avoid the spurious effects of hydrodynamic patterns which are limited to a particular interval of time. In fact, all these requirements are met in the case of Channel waters radiolabelled by releases from La Hague which entered the southern North Sea over the last six years; the present study is based on seven collection campaigns undertaken between 1987 and 1992 (for125Sb,106Ru,137Cs and 134Cs) and five campaigns between 1989 and 1992 (for99Tc).
The quantitative results obtained from measurements of radionuclide activity in the environment may be used to build up a database which can then be directly compared with release simulations (from La Hague) provided by hydrodynamic models. In this way, the observed distribution of radiotracers in the North Sea is a useful test of the validity of the hydrodynamic model. The numerical model of the English Channel and North Sea developed by Salomon and Breton (1990), Salomon et al (1994), and Breton and Salomon (1994) during European MAST 52C programme "Studies on the transport of coastal water from the English Channel to the Baltic Sea using radioactive tracers", yields simulations over long intervals of time which take into account tides and real winds; it provides a basis of comparison for the radiotracer distribution data.
1. SAMPLING AND METHODS
1.1. Oceanographic campaigns
The analytical results presented in this study were obtained from seawater samples collected during seven campaigns carried out in the North Sea between 1987 and 1992 using research ships of the IFREMER, CNRS (France) and MAFF (U.K.). The 99Tc data have
been made available by Hermann (BSH), Kershaw (MAFF) and Masson (IPSN) in the framework of the European Economic Community (EEC) programme MAST 052C "Studies on the transport of coastal water from the English Channel to the Baltic Sea using radioactive tracers"; for the location of sampling stations, see Hermann et al. (1994, this vol.).
1.2. Analytical methods
Seawater samples for radioactivity measurements were collected by pumping from a depth of 3 m and unfiletred, so the measurements concern both dissolved and particulate material (this concern more the106Ru). The analyses of125Sb,106Ru,137Cs,134Cs and99Tc in july 1991 were carried out at the Marine Radiecology Laboratory (LRM) at La Hague, France; the other measurements of99Tc were performed by the laboratory of Sülldorf (BSH)
and the Fisheries Laboratory of Lowestoft (MAFF) (Hermann et al., 1994, this vol.).
The activities of 125Sb and 106Ru (half-lives of 2.76 years and 1.02 years,
respectively) were measured by gamma-ray spectrometry after concentration of the radionuclides from seawater samples of 120-1200 l using manganese dioxide at pH 3.5 (Gandon and Guéguéniat, 1992). The concentration of suspended particulate matter being always less than 50 mg/l, all the 125Sb is only present in the soluble phase as Sb(OH)
6- in
normaly oxygenated seawater (Gandon and Guéguéniat, 1992); under such conditions, the dissolved radionuclide is absorbed onto MnO2 with an extraction yield of 97% at pH 3.5. Because of the relatively high statistical counting errors (15, 10 and 5% for activities of the order of 1.5, 5 and 15 Bq/m3, respectively), no yield correction was applied. However, the extraction yields for106Ru are highly variable, being dependent on the stability of ruthenium
complexes, 106Ru coming from reprocessing plants of Sellafield and la hague is present in
seawater as nitrosylruthenium II complexes, and only the hydrolysis products of this complex are adsorbed onto MnO2 (Gandon et al., 1993, 1994), with the consequence that this method produces random results when used to concentrate ruthenium.
137Cs and134Cs (half-lives of 30 years and 2.2 years, respectively) were extracted from
the same seawater samples by adding Co-K ferrocyanide powder (at a concentration of 8.10
-5g/l) to the manganese dioxide precipitate, thus bringing about ion exchange with the
caesium in solution. Caesium is present in seawater only as soluble Cs+ (Folsom and
Sreekumuran, 1970; Folsom T.R et al., 1974).
From 1991 onwards, a new extraction method was used that involves associating a precipitate of copper ferrocyanide with ferric hydroxide (Gandon and Guéguéniat, 1992; Gandon et al.,1994). This enables the coprecipitation of125Sb,106Ru and radiocaesium at a
constant yield that is evaluated at 100% in the case of wastes released from the reprocessing plant at La Hague.
The activity of 99Tc (half-life of 2.1 105 years) was measured by beta-counting after radiochemical separation according to the methods of Harvey et al. (1991) and Chen et al. (1993), using sample volumes ranging from 50 to 100 l. Technetium is present in seawater only as pertechnetate III TcO4-, as Antimony, in marine environment this element is
essentially associated to seawater (Chen et al., 1993).
1.3. Mapping the distribution of radiotracers
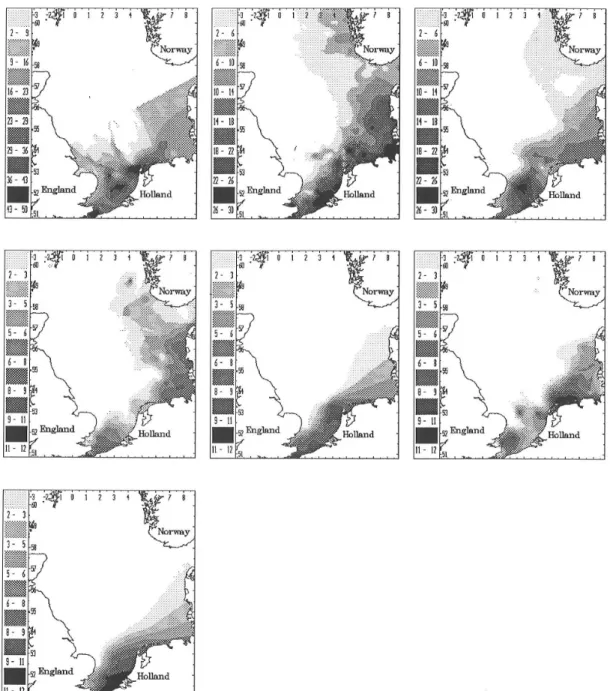
As soon as the campaigns had attained a suficiently wide coverage, the measurements of radioactivity at individual stations were interpolated over the entire surface of the North Sea, the area being subdivided into a regular grid of 10 km squares. The southeastern sector alone was taken into account for campaigns with a more limited coverage. This data treatment enables the visualization and comparison of the analytical results (Fig. 1:125Sb; Fig. 2:106Ru; Fig. 3:99Tc; Fig. 4: 137Cs; Fig. 5:134Cs). A "Kriging"
5
Fig. 1: Evolution of125Sb levels in the North Sea from 1987 to 1992 in Bq/m3 (a: 07/87; b:
Fig. 2: Evolution of106Ru levels in the North Sea from 1987 to 1992 in Bq/m3 (a: 07/87; b:
7
Fig. 3: Evolution of99Tc levels in the North Sea from 1987 to 1992 in Bq/m3 (a: 11/89; b:
11/90; c: 02/91; d: 07/91; e: 01/92).
Fig. 4: Evolution of137Cs levels in the North Sea from 1987 to 1992 in Bq/m3(a: 07/87; b:
Fig. 5: Evolution of134Cs levels in the North Sea from 1987 to 1992 in Bq/m3(a: 07/87; b:
07/88; c: 06/89; d: 09/90; e: 02/91; f: 07/91; g: 01/92).
1.4. Radionuclides originating specifically from La Hague
The different distribution patterns encountered since 1987 (Figs. 1-5) indicate that
125Sb and 106Ru are mainly present in the plume of Channel waters labelled by industrial
releases from La Hague. Measurements carried out on waters exhibiting a high degree of labelling from the Sellafield plant in northern England show that these radionuclides are only rarely present, and always at activities of less than 1 Bq/m3. Similar levels are recorded
at the entrance to the Baltic in waters affected by fallout from the Tchernobyl accident. In the absence of any other significant source of artificial radioactivity in the English Channel or North Sea, the concentrations of25Sb and 106Ru observed in the Channel plume may be attributed entirely to the controlled releases from the reprocessing plant at La Hague.
9
1)99Tc is released in considerable amounts from both the Sellafield and La Hague
plants (cumulated releases for 1992: 800TBq from Sellafield and 100Tbq from La Hague). North Sea waters have been labelled as a result of the Sellafield releases, particularly prior to 1990 (Fig. 3); these releases also label waters passing around the southwestern tip of England which penetrate into the Channel from the west (Hermann et al., 1994). In the present study, the influence of Sellafield on 99Tc activities in the Channel plume is
expressed as a mean background level of 0.3 Bq/m3; in this way, only the technetium
derived from La Hague is taken into account.
2) Due to analytical constraints, there were far fewer measurements of99Tc in each
campaign compared with125Sb or106Ru, and data are only available from 1989 onwards. 3) Data concerning 99Tc releases are only available on a monthly basis, while
information is made known for each separate release of125Sb and106Ru.
Because of the above considerations, the results obtained using99Tc as a tracer are less precise than those based on125Sb. Various inconsistencies are thus to be expected in the
radiolabelling of the Channel plume, particularly in cases when the influence from La Hague is weak with respect to that from Sellafield.
1.5. Observations on the distribution of Channel waters
Generally speaking, the observed patterns of distribution (Figs. 1-5) support the previously obtained data on the overall circulation of water masses in the North Sea (Kautsky, 1973, 1976 and 1988; Jefferies et al., 1982; Jefferies and Steele, 1989; Mitchel and Steele, 1988; Nies and Wedekind, 1988; Nies, 1990; Guéguéniat et al., 1993 and 1994; Bailly du Bois et al., 1993). In particular, there is a general decrease in activity in all the considered radionuclides which results from a major fall in the amount of releases from Sellafield and La Hague, as well as a diminishing influence of fallout from the Tchernobyl accident.137Cs still is the main radionuclide measured, showing activities in the range of
4-18 Bq/m3 during January 1992. These levels approach the background radioactivity derived
from atmospheric nuclear tests, whose fallout has labelled all waters in the northern hemisphere (2-4 Bq/m3). In comparison, the naturally occurring radionuclide 40K - which is
present in seawater - accounts for an activity of 12 000 Bq/m3.
As regards the Channel plume, waters labelled by releases from La Hague enter the southeastern part of the North Sea and travel northward, being clearly identified along the coasts of Belgium, the Netherlands, Germany and Denmark. Farther north than Latitude 57° N, it is no longer possible to distinguish well the waters belonging to the Channel plume : waters leaving the Baltic through the Skagerrak cause a marked perturbation in the flow pattern, while abrupt changes in water depth from 40 to more than 200 m in the Norwegian Channel mean that surface measurements are no longer representative of the entire water mass. By contrast, in the southeastern part of the North Sea, the Channel plume is contained entirely within an area where depths are less than 50 m. Moreover, the spatial distribution of the plume waters appears sufficiently homogeneous and reproducable to enable a relation to be established between the temporal release pattern from the source and the activities measured at sea in this sector.
1.6. Conservative behaviour of radionuclides in seawater
Numerous measurements carried out during campaigns at sea and in the laboratory have shown that 99Tc and 125Sb are largely present as dissolved species in seawater; even
after filtration (0.45µm) of sample volumes of more than 1000 l, it is not possible to detect these radionuclides in the suspended matter. Nevertheless, since 125Sb and 99Tc can be
detected in certain sediment samples, an attempt was made to evaluate the proportion of the activity released from La Hague that is likely to settle out from seawater; this fraction is not taken into account when calculating the mass balance based on measurements of radioactivity in the dissolved fraction.
In order to quantify the errors in the mass balance calculations, an assessment was made of the amount of activity associated with the particulate matter using measurements on sediments from the Channel and North Sea (pers. comm. D. Boust and M. Masson). These estimates are based on extrapolations from measurements of surface sediments covering the whole of the eastern Channel and southern North Sea, combined with the determination of activities in fine-grained particulates measured in sheltered zones. However, this method leds to an overestimate of fixed activity values since fine sediments have distinctly higher adsorptive capacities than the coarser material that makes up a large part of the deposits in the Channel and North Sea. On this basis, it is possible to estimate that a maximum of 5% of the125Sb and99Tc released from La Hague is fixed onto sediments in the Channel, while a
value of 10% applies to the Channel and the south of the North Sea taken together.
A significant proportion of the 106Ru in the releases is associated with particulate matter and is subsequently deposited on the sea-bed; although the activity of this radionuclide in solution cannot be used in quantitative radiotracer studies, its relative abundance can nevertheless provide some interesting additional information.
2. QUANTIFICATION PROCEDURE
2.1. Calculation of total radioactivity present
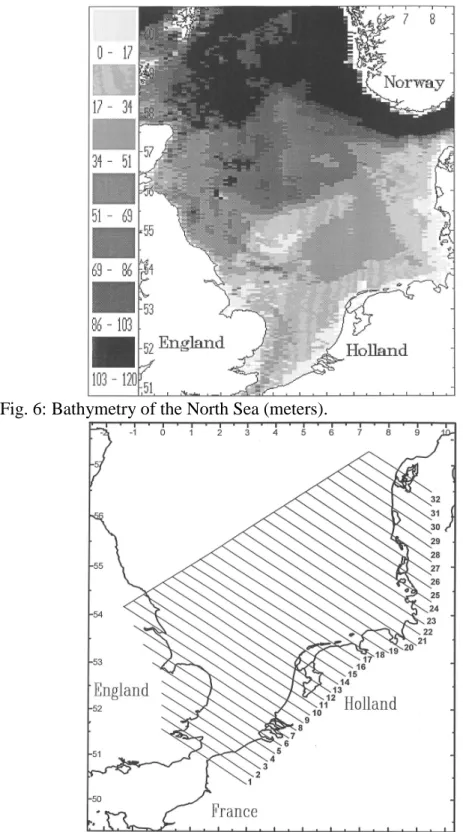
The quantitative evaluation of radioactivity in seawater is based on the fact that water masses in the southern North Sea do not exhibit significant stratification. In fact, the water-depth is generally shallow, being less than 50 m in the area to the south of a line joining Newcastle in the U.K. with Denmark (see bathymetric map: Fig. 6), while tidal effects are generally strong enough to ensure vertical mixing. This hypothesis has been adopted in most models concerning the North Sea (Pingree and Griffiths, 1978; Nihoul, 1980; Nihoul and Djenidi, 1987; Prandle, 1984; Pagee et al., 1988; Reid et al., 1988); several measured profiles of temperature and salinity also indicate a high degree of vertical homogeneity. Thus, water samples taken at a depth of 3 m are considered representative of the entire water column.
A computer datafile was used to calculate the total activity of the radionuclides present; this file contains the bathymetry from SHOM (French Hydrographic Service) maps represented on a grid with a resolution of 3 X 3 km. The radioactivity measurements at each station were interpolated over the same grid, thus enabling an extrapolation of values throughout the water column and a quantification of radioactivity for each radionuclide at all points in the North Sea.
11
Fig. 6: Bathymetry of the North Sea (meters).
Fig. 7: Subdivision of the southern North Sea into 32 boxes used for the calculation of radioactivity inventories.
2.2. Subdivision of the studied zone into boxes
In order to link the releases from the reprocessing plant at La Hague to the inventories measured at sea, a procedure is required which enables a comparison between the time-variable releases and the spatial distribution of the radiotracers. The marine environment is a complex system subject to random influences of a cyclic nature (i.e. wind, tides, etc.). So as to obtain comparable sets of measurements from different campaigns
without increasing the number of parameters to be considered, which would hinder the interpretation of results, it was necessary to make some simplifying assumptions. Local fluctuations were not taken into account since they appear unrepresentative of releases from La Hague (situated at more than 280 km from the southern North Sea area). The studied zone was subdivided into a number of different boxes, each incorporating the activity measurements from several stations, thus providing a statistically valid basis for data treatment. The choice of limits for the boxes (Fig.7) was determined by the flow pattern of waters belonging to the Channel plume, i.e:
1) Each of the boxes comprises a segment of the Channel plume taken perpendicularly along its direction of flow from the Straits of Dover towards the Skagerrak.
2) The length of each box in the direction of flow is fixed at a constant value of 24 km.
3) The northwestern limit of the boxes follows the 50 m depth contour, being situated sufficiently far from the coast to encompass the plume of waters labelled by releases from La Hague (except for boxes 29-32, which were not extended farther north for the reasons mentioned in §1.5.)
4) The subdivision into 32 boxes would appear appropriate in relation to the density of radioactivity measurements, but the number of boxes was reduced for certain campaigns having limited coverage towards the north.
Because each box covers a complete section of the Channel plume, it is only possible to record the average impact of releases in a given zone. While the earliest effect of a release is observed qualitatively at time t at a particular point in the box, the quantitative contribution of a release to activity in the box is only apparent at time t+Dt, which corresponds to the mean transit time for releases between La Hague and the zone in question. In fact, the aim of the quantification procedure is to obtain values for this mean transit time.
2.3. Mean flow pattern of Channel waters
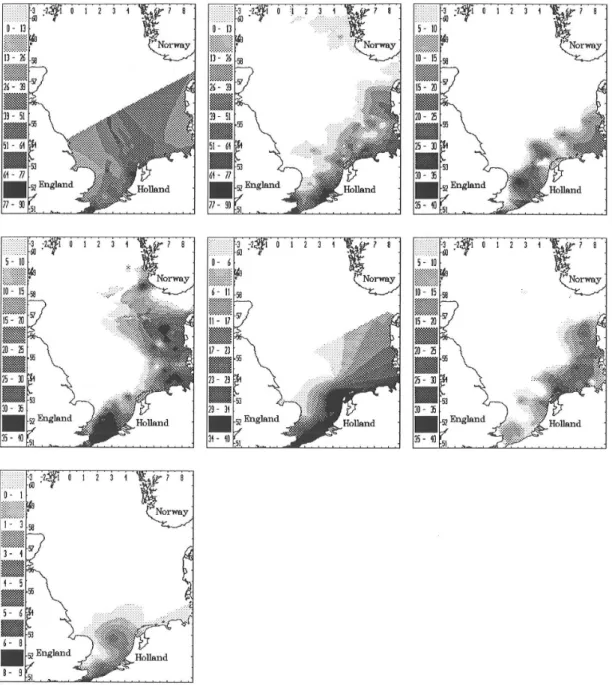
Figures 8 summarize the inventories of radiotracers calculated from each of the sampling campaigns in boxes 1-32. Although these distributions shows a high degree of variability, there is nevertheless an overall regular pattern with peaks overlapping in certain zones at different times. A cursory statistical analysis of the 125Sb,106Ru and 99Tc release
data fails to reveal any periodicity that could account for the observed radiotracer distribution across the southern North Sea. It is to be expected that different boxes are not directly comparable with each other because Channel plume waters are variable in extent from one box to another; it should be noted that the plume is generally narrower off the island of Texel (Figs 1 to 3, box 14) than in the middle of the Gulf of Hamburg (Figs 1 to 3, box 21).
The penetration of plume waters into the southern North Sea is analogous to flow in a sort of "conduit" bounded to the southeast by the coast and, to the northwest, a transition zone with the central waters of the North Sea. The front can vary in position according to the effects of wind, tides and dilution with waters devoid of radiotracers from La Hague. In principle, there is no reason to assume that such a conduit should have a constant cross-section, so it is unrealistic to seek a relation between temporal variations (linear) in releases from the source and spatial variations (non-linear) in radioactivity.
To overcome this difficulty, it is possible to assume that Channel waters labelled by releases from La Hague always follow broadly the same pathway. In this way, the predictible variations of inventories measured in the different boxes can be linked to the topography of the North Sea. Under the condition that releases are random in nature through
13
the course of time, the distribution of radionuclides derived from La Hague corresponds to a pipe-shaped intrusion of Channel waters into the southern North Sea.
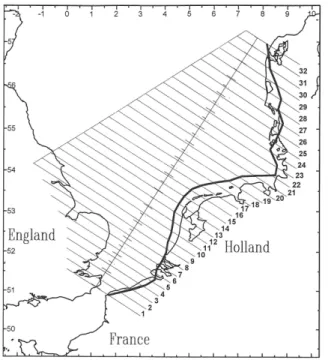
Calculations were carried out by normalizing the total amount of radioactivity observed in each box with respect to all the boxes included in each campaign (Fig. 9), and then averaging values over each zone for the different campaigns (Fig. 10a). The average distribution obtained in this manner is remarkable since it yields a very similar pattern for
125Sb as for99Tc; even when averaging the data from the first two or the last two campaigns
(Figs. 10b), the pipe-shaped intrusion of Channel waters into the southern North Sea appears to be a highly reproducible feature. There is a close similarity between the distribution so obtained and the coastal profile from the Straits of Dover to the Skagerrak (Fig. 11). Since water depths are relatively constant in this zone, it may be concluded that the transition zone between the Channel plume and central North Sea waters is generally straight.
Fig. 8: Inventories of radioactivity in 32 North Sea boxes from 1987 to 1992 (a:
Fig. 9: Normalized quantities of radioactivity in the southern North Sea from 1987 to 1992 (a:125Sb; b:106Ru; c:99Tc).
Fig. 10: Average distribution of radioactivity in the southern North Sea from 1987 to 1992 (a:125Sb,106Ru and99Tc; b:125Sb in 1988 - 1989 and 1990 - 1991).
Fig. 11: Coastline of the the southern North Sea superimposed onto average distribution of radioactivity.
15
2.4. Conversion from distance- to time-based scale
Because the releases from La Hague produce a highly reproducible mean distribution of radioactivity in the North Sea, it is possible to correct the total radioactivity measured in each box so they can be more directly compared with the amounts of release. Although winds and tides are among other factors influencing the distibution of radioactivity, they are not taken into account in the present study due to their great variability in space and time which would complicate the interpretation of results.
The mean distribution of dissolved radiotracers indicates that their amount is higher in certain zones than in others; on average, zones with higher inventories are representative of longer periods of release from the source. Thus, a time-based scale can be added to the distance-based scale (i.e. series of numbered boxes). The time scale is proportional to the relative magnitude of the release recorded in a particular box with respect to all the others. Thus, the inventory observed in box 13 corresponds to a duration of release that is 3.5 times less than for box 21. Similarly, to be strictly comparable, the inventories measured in each box should be expressed in relation to the same unit of time. For example, if 2000 Bq of
125Sb are measured in box n°13 and 3500 Bq in box n°21, the inventory of radioactivity per
unit time is two times greater in box n°13 compared with box n°21 (i.e. 2000 Bq compared with 3500/3.5 = 1000 Bq). The unit of time used to compare the releases with the resulting activity at sea is the week; this duration appears appropriate in regard to the amounts of radioactivity measured in each box.
2.5. Release correction
So as to enable a comparison between the releases from La Hague and the measured amounts of radioactivity at sea, it was necessary to take account of a certain degree of mixing between releases on the time-scale of a week. At great distances from the source, this has the effect of attenuating abrupt variations in the source term, which are then masked by natural mixing and diffusion in the Channel. A simple Gaussian diffusion was assumed for this process, taking into account the week before and the week after the release. Corrections for radioactive decay were applied to the data from each campaign so as to recalculate the radioactivity still remaining at the date of sample collection.
2.6. Correlation method
In order to correlate the inventories of radioactivity measured at sea (expressed on the basis of time, see §2.4.) with the time-integrated amount of release corrected for the date of the campaign, it is necessary to define two further parameters:
1) The mean transit time for a release to travel the distance from La Hague to the Straits of Dover.
2) The mean transit time for a release to travel between the Straits of Dover and the Skagerrak.
To avoid leaving out any major release events, a correlation coefficient was calculated for all possibilities of duration of release with transit time (90-200 days for La Hague-Straits of Dover and 130-300 days for Straits of Dover-Skagerrak) using the 125Sb
and 99Tc data. These results were crossed over between the two radiotracers for sampling campaigns carried out at the same time, with the aim of obtaining an internally consistent set of values.
3. RESULTS
3.1. Transit times
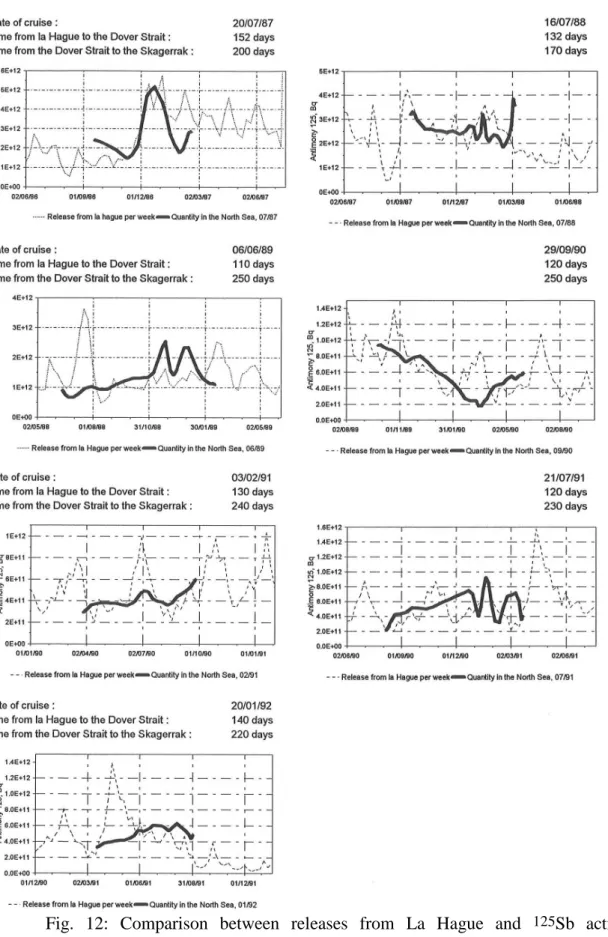
The best fit between125Sb and 99Tc quantity distribution at sea and the amount of
release from source is obtained for a transit time in the range 110-152 days for the Cap de la Hague-Straits of Dover and 170-250 days for the Straits of Dover-Skagerrak. This corresponds to a total transit time of 302-370 days between La Hague and the Skagerrak (Figs. 12 and 13). On the basis of these values, it is possible to calculate that on average -101% (± 8%, r2 = 0.98) of the total released125Sb and 97% (± 18%, r2=0.5) of the99Tc is subsequently measured in the North Sea (Figs. 14a and 14b), a result that is consistent with the initial assumptions concerning the conservative behaviour of these radionuclides. In general, the pattern of releases from the source is reflected in the measured inventories at sea, but with a certain degree of variability from one campaign to another (e.g. the peak in
125Sb activity during December 1987 is clearly identifiable, as well as a number of other
major release events). It should be born in mind that meteorological phenomena, which are not taken into account here, are capable of perturbing the regular pattern of flow assumed in the present model.
The correlation between source and signal for each campaign does no necessarily involve the same range of transit times. A change in the duration of just a few days can strongly affect the degree of fit between the curves (e.g.: Fig 15 for 1987); it is noteworthy that the same transit times always yield the best results for different radionuclides at any given moment.
As regards106Ru (Fig. 16), it appears that 30% (± 22%, r2 = 0.25, Fig. 14c) of the released radionuclide finds its way into the North Sea. Before 1991, there was no clear correlation between the amounts released and the inventories measured in seawater. This situation can be attributed to the low reliability of analyses linked to the chemical speciation of ruthenium in wastes from the reprocessing plant at La Hague (Gandon et al., 1994) as well as the adsorption of this radionuclide onto sediments. From 1991 onwards, improvements in the analytical method and changes in the speciation of the released radionuclide have led to more reliable results. A better fit was obtained between releases and measured activitities using data from the 1991 campaign; these results support the previous estimates of transit time based on125Sb and99Tc.
Data from the different sampling campaigns are presented on the same diagram (Figs. 17) to provide a clearer picture of how radioactivities measured at sea reflect the variation of releases at source. This type of diagram makes it easier to pick out the fall in inventories measured in the North Sea associated with a major decrease in the amount of releases.
17
Fig. 12: Comparison between releases from La Hague and 125Sb activities
Fig. 13: Comparison between releases from La Hague and99Tc activities measured
19
Fig. 14: Correlation between releases from La Hague and radioactivity measured in the North Sea from 1987 to 1992 (a:125Sb; b: 99Tc; c:106Ru).
Fig. 15: Comparison of adjustments between La Hague releases and radioactivity measured for different transit-times in 1987.
Fig. 16: Comparison between releases from La Hague and radioactivity measured of106Ru in the North Sea from 1987 to 1992.
21
Fig. 17: Evolution of releases compared with measured radioactivity in the North Sea from 1987 to 1992 (a:125Sb; b:106Ru; c:99Tc).
3.2. Estimation of water flux leaving the Channel
Knowing the transit time of Channel waters through the southern part of the North Sea, it is theoretically possible to link their flow-rates to estimates of volume, thus yielding a flux for Channel waters entering the North Sea. The main obstacle to such an approach is that the Channel plume is not homogeneously labelled by releases from La Hague. Monthly transects carried out in the framework of the FLUXMANCHE EEC programme (Guéguéniat et al., 1994) in the Straits of Dover have shown a constant gradient in the level of radiotracers derived from La Hague; this decrease extends across the Channel from the French to the English coast, where it is not always detectible. Since the radiolabelling from
La Hague is insufficient to enable a discrimination between Channel and North Sea waters, it is necessary to define another radiotracer more specific of Channel waters. Such a study was undertaken for the campaign of July 1988, when North Sea waters were markedly more influenced by137Cs coming from Sellafield compared with Channel waters; in this case, it
was possible to evaluate the percentage of Channel waters penetrating into the North Sea in relation to other water masses (Fig. 18, Bailly du Bois et al., 1993). By incorporating these data into the box model of the present study, it is possible to calculate the volume distribution of the Channel's waters in the North Sea. Using the same procedure as applied to the activity measurements, and assuming the transit times adopted for the July 1988 campaign, we obtain the flow-rate distibution presented in Fig. 19. As a result, the mean flow-rate of Channel waters through the Straits of Dover appears to vary in the range 97000-195000 m3/s during the period January 1988 to July 1988.
Fig. 18: Percentage contribution of Channel waters flowing into the North Sea during July 1988 (Bailly du Bois et al., 1993).
Fig. 19: Flux of Channel waters through the Straits of Dover from January 1988 to July 1988, estimated from inventories of radioactivity measured in the North Sea.
23
4. DISCUSSION: COMPARISON WITH HYDRODYNAMIC MODEL
4.1. Description of model
The quantitative data obtained from the measurement of radiotracers can be directly compared with the results of hydrodynamic models designed to simulate the dispersal of dissolved material released from the reprocessing plant at La Hague. In particular, the hydrodynamic model developed by J.C. SALOMON (IFREMER) for the Channel and North Sea incorporates real meteorological data. In the framework of the EEC MAST 052C programme, this model has been used to simulate the flow of 125Sb and 99Tc from their
source at La Hague as far as the Skagerrak during the period 1982-1992. A set of time series calculations have also been carried out concerning water fluxes through the Straits of Dover.
4.2. Flux through the Straits of Dover
The flow rates obtained from the campaign of July 1988 (see §3.2) were superimposed onto the monthly values calculated from the model (Fig. 20). A highly satisfactory agreement can be seen between the two sets of values, with closely similar mean fluxes.
4.3. Distribution of Channel plume waters
If the model accounts well for the flow of Channel waters into the North Sea, it should be possible to reproduce the same flow pattern as indicated by the observed distribution of radioactivity. The same subdivision into 32 boxes was used in the model, while an average distribution was calculated - using the same procedure for measurements at sea - to simulate the radioactivity coming from La Hague. The model-based curve is compared with the observed radioactivity profile on Fig. 21, which shows an almost perfect agreement between the two sets of values. This shows the validity of the procedure used here, especially since the quality of description of the model was established independently in both studies.
Fig. 20: Variation of fluxes through the Straits of Dover from January 1988 to July 1988, showing comparison of results based on numerical modelling and measurements of radioactivity.
Fig. 21: Average distribution of radioactivity in the southern North Sea, comparing results based on numerical modelling and measurements of radioactivity (a:125Sb; b:99Tc).
4.4. Comparison of measured and calculated inventories
The radioactivity data were extracted from the model for the entire period of the simulation, using a summation of overall radioactivity content in each of the 32 boxes defined above. The model-derived and measured activities are presented together on Figs. 22 and 23. Even though completely different approaches were used to lead to these results, a highly satisfactory degree of agreement is obtained between the measured and simulated activity distributions. Nevertheless, there are some marked deviations for certain campaigns, particularly in the southern part of the North Sea. Due to the large amount of shipping and the shallow water depths in these coastal zones, the density of sampling was somewhat lower here than elsewhere in the North Sea. However, the major release of 125Sb in
December 1986 appears to have migrated more rapidly in the environment (up to the campaign of 1987) than indicated by the simulation. Generally speaking, a better agreement is obtained between the curves when the simulation is calculated for a date slightly later than the real date of the campaign. The observed deviations between measured and simulated distributions may be explained by the fact that the meteorological data incorporated into the model are derived from measurements carried out in the central Channel, and are applied to the whole of the Channel and North Sea area. In the light of the above, the numerical simulation of the flow of radiolabelled waters from La Hague towards the North Sea can be considered highly satisfactory; on average, the model yields an excess of 21 ± 4% in the
25
Fig. 22: Inventories of 125Sb in the North Sea from 1987 to 1992, showing
comparison of results obtained from numerical modelling and radioactivity measurements.
5. CONCLUSION
A repeated series of oceanographic campaigns in the North Sea has enabled a quantitative investigation of the dispersal of radionuclides between the Straits of Dover and the Skagerrak. These studies have shown a highly regular pattern in the distribution of Channel plume waters labelled by radionuclides (i.e. 125Sb,106Ru and 99Tc) released from La Hague. On the basis of this observed distribution, releases from La Hague can be directly
correlated with the inventories of radioactivity measured in the southern North Sea. The average transit time of waters flowing from La Hague to the Straits of Dover is estimated as 110-152 days, and 170-250 days for the section between the Straits of Dover and the Skagerrak, so the total transit time between La Hague and the Skagerrak lies in the range 302-370 days. The water flux through the Straits of Dover during 1988 is estimated as varying between 97000 and 195000 m3/s.
A comparison of these results with simulations provided by the hydrodynamic model for the Channel developed by J.C. Salomon shows a good agreement between the calculated and measured values of activity; the two sets of data agree to within 24%, which is a relatively small deviation for environmental data on the time scale of a year.
In view of these results, hydrodynamic models may be regarded as reliable tools for simulating the dispersal of dissolved substances in the marine environment (i.e. coming from controlled releases, accidental pollution). Moreover, quantitative data on the dispersal of tracers can prove extremely valuable in the interpretation of differences that exist between numerical simulations and observed values.
An understanding of hydrodynamic transport mechanisms is essential in the study of the behaviour of substances that show a greater affinity for environmental boxes such as sediments or biomass compared with the dissolved phase. Complex processes are involved in the becoming of tracers (absorption, deposition, resuspension, uptake by organisms, biological cycles, etc.), so the methods employed in this study for estimating fluxes and characterizing the main reproducible aspects of the flow pattern may prove useful in this wider context.
ACKNOWLEDGEMENTS
This study was financed partly by the European research programme MAST 52C "Studies on the transport of coastal water from the English Channel to the Baltic Sea using radioactive tracers".
We wish to thank all crew members who assisted us on board the research vessels "Pluteus II" (CNRS), "Cryos", "Noroit", "Suroit" (IFREMER) and "Cirolana" (MAFF).