HAL Id: hal-00104237
https://hal.archives-ouvertes.fr/hal-00104237
Submitted on 26 May 2020
HAL is a multi-disciplinary open access
archive for the deposit and dissemination of
sci-entific research documents, whether they are
pub-lished or not. The documents may come from
teaching and research institutions in France or
abroad, or from public or private research centers.
L’archive ouverte pluridisciplinaire HAL, est
destinée au dépôt et à la diffusion de documents
scientifiques de niveau recherche, publiés ou non,
émanant des établissements d’enseignement et de
recherche français ou étrangers, des laboratoires
publics ou privés.
Relationship of the Central Indian Ridge segmentation
with the evolution of the Rodrigues triple junction for
the past 8 Myr.
Véronique Mendel, Daniel Sauter, Philippe Patriat, Marc Munschy
To cite this version:
Véronique Mendel, Daniel Sauter, Philippe Patriat, Marc Munschy. Relationship of the Central Indian
Ridge segmentation with the evolution of the Rodrigues triple junction for the past 8 Myr.. Journal
of Geophysical Research : Solid Earth, American Geophysical Union, 2000, B7 (B7), pp.16563-16575.
�10.1029/2000JB900098�. �hal-00104237�
JOURNAL OF GEOPHYSICAL RESEARCH, VOL. 105, NO. B7, PAGES 16,563-16,575, JULY 10, 2000
Relationship of the Central Indian Ridge segmentation
with the evolution of the Rodrigues Triple Junction
for the past 8 Myr
Vtronique
Mendel
• and
Daniel
Sauter
Ecole et Observatoire des Sciences de la Terre, Strasbourg, France
Philippe Patriat
Institut de Physique du Globe, Paris
Marc Munschy
Ecole et Observatoire des Sciences de la Terre, Strasbourg, France
Abstract. Located near 25ø33'S, 70ø00'E,
the Rodrigues
Triple Junction
is the joining point of the
intermediate-spreading
Southeast
Indian and Central Indian Ridges with the ultraslow
spreading
Southwest
Indian Ridge. Bathymetric
data and magnetic
anomalies
are used to analyze the
relationship
between
the evolution of the Central Indian Ridge segmentation
and the evolution of
the Rodrigues
Triple Junction
for the past 8 Myr. The Central Indian Ridge domain exhibits a
complex morphotectonic
pattern dominated
by ridge-normal
and oblique bathymetric
lows
interpreted as the off-axis traces of axial discontinuities. The short-lived nontransform
discontinuities
as well as the segments
that lengthen
or shorten
along the ridge axis reveal that the
Central Indian Ridge segmentation
is unstable
near the Rodrigues
Triple Junction.
The combined
study of the Central Indian Ridge and Southeast
Indian Ridge domains
shows
that the triple
junction evolves
between
two modes:
a continuous
mode where the Central Indian Ridge and
Southeast
Indian Ridge axes are joined and a discontinuous
mode where the two ridge axes are
offset. Owing to spreading
asymmetry,
and differences
in axis direction
or in lengthening
rates of
the Central Indian and Southeast
Indian ridges, the continuous
mode is unstable
and evolves
rapidly (<2 Myr) into a discontinuous
mode. This last one is more stable and can evolve into a
continuous
mode only through
the formation
of a new Central Indian Ridge segment,
which takes
place facing the northern
Southeast
Indian Ridge segment.
The evolution of the Rodrigues
Triple
Junction
configuration
and the evolution of the Central Indian Ridge segmentation
are thus
closely related.
1. Introduction
The Rodrigues Triple Junction (RTJ), also called Indian Ocean Triple Junction (25ø33'S, 70ø00'E) joins the intermediate spreading Central Indian Ridge (CIR; 50 krn/Myr) and Southeast Indian Ridge (SEIR; 60 km/Myr) and the ultraslow spreading Southwest Indian Ridge (SWIR; 16 km/Myr) (Figure 1). The RTJ was .first recognized by McKenzie and Sclater [ 1971]. It is a stable ridge-ridge-ridge (RRR) type triple junction at a regional scale and has existed since at least 65 Ma [Patriat and S•goufin, 1988]. For the last 10 Myr, the triple junction evolution is well described by a RRR-type velocity diagram with the CIR and SWIR lengthening obliquely and the SEIR keeping a constant length [Tapscott et al., 1980].
The topographic characteristics of the three median valleys were described by Munschy and Schlich [ 1989] using a Sea Beam
1Now
at Southampton
Oceanography
Centre,
Challenger
Division
for
Seafloor Processes, Southampton, England, United Kingdom.Copyright 2000 by the American Geophysical Union.
Paper number 2000JB900098.
0148-0227/00/2000JB900098509.00
bathymetric survey of a 100 km x 100 km area around the triple junction. From GLORIA side-scan sonar images, Mitchell
[1991 a] suggested that the hypothesis of rigid plate tectonics may not apply in a fine scale at the RTJ because extension of the crust
across the SWIR is distributed over a 10 km or more wide zone.
Sea Beam and GLORIA data of the trace of the RTJ on the
Antarctic plate (0-20 Ma) also showed sections with series of en 6chelon escarpments that contrast with long linear scarps, suggesting two modes, discontinuous and continuous, of the triple
junction evolution [Patriat and Parson, 1989; Mitchell and
Parson, 1993]. Recently, the analysis of Simrad multibeam data over the SWIR domain for the last 8 Myr revealed two ways of lengthening of the SWIR: (1) a continuous and progressive propagation of the SWIR with distributed deformation in pre- existing crust of the CIR and (2) a discontinuous propagation of the SWIR with focusing of the deformation in a rift zone when
the triple junction
migrates
rapidly to the north [Sauter
et al.,
1997].Mitchell and Parson [1993] and Honsho et al. [1996] related
changes
in the spreading
processes
of the CIR to the evolution
of
the RTJ. Periods of asymmetric spreading on the CIR maypossibly
indicate
that the CIR and SEIR have been offset by a
fracture zone at the triple junction during one of the two modes
16,564 MENDEL ET AL.: EVOLUTION OF THE RODRIGUES TRIPLE JUNCTION
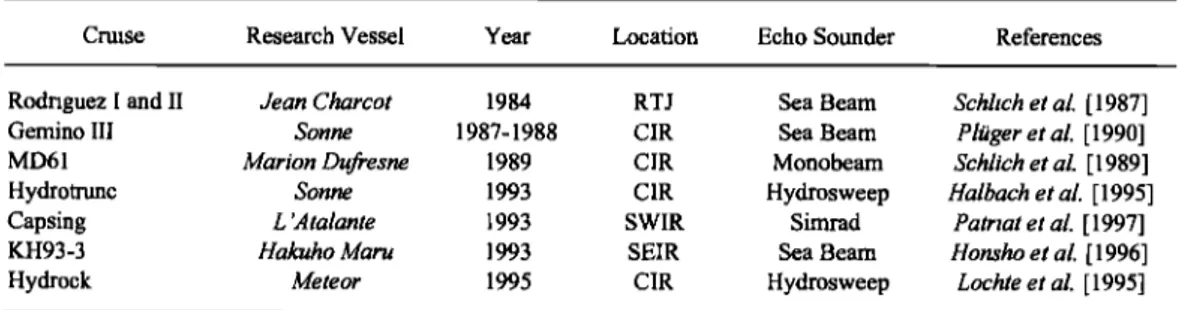
Table 1. Compilation of All BathymetTic Data Used for This Study
Cruise Research Vessel Year Location Echo Sounder References
Rodriguez I and II Jean Charcot 1984 RTJ Sea Beam Schlich et al. [ 1987] Gemino III Sonne 1987-1988 CIR Sea Beam Pliiger et al. [ 1990] MD61 Marion Dufresne 1989 CIR Monobeam Schlich et al. [ 1989] Hydrotmnc Sonne 1993 CIR Hydrosweep Halbach et al. [1995] Capsing L 'Atalante 1993 SWIR Simrad Patriat et al. [ 1997] KH93-3 Hakuho Maru 1993 SEIR Sea Beam Honsho et al. [ 1996]
Hydrock Meteor 1995 CIR Hydrosweep Lochte et al. [1995]
The Sea Beam bathymetric survey system uses a multinarrow echo sounder (12 kHz) which allows a maximum swath width corresponding to three fourths of the water depth [Renard and Allenou, 1979]. Expanding on the Sea Beam design, the Hydrosweep system (15.5 kHz) provides a wider swath width (twice the water depth) [De Moustier, 1988]. The Simrad EM12D forms part of the new generation of deep sea sonar surveying tools [Bourillet et al., 1996]. It is a 13 kHz multi-narrow-beam echo sounding system which can cover a sector of 150 ø, which represents a swath width of up to 7 times the water depth.
[Mitchell and Parson, 1993]. However, the lack of data over the triple junction trace on the Capricorn plate could not confirm the ridge-ridge-transform fault (RRF) evolution of the RTJ. Honsho et al. [ 1996] presented a new conceptual evolution model for the
discontinuous
mode that includes
a short-living
(<0.5 Myr)
northward
propagation
of the SEIR (of-25-30 km) followed
by
lengthening
of the SWlR, failing
of the SEIR propagation
rift and
restoration of the CIR in less than -0.1 Myr. However, the
pseudo
faults associated
with those
propagating
riffs were not
observed on the bathymetric chart of the triple junction area
[Honsho
et al., 1996].
How the segmentation
of the CIR changes
while this ridge is lengthening
southward
and whereas
the triple
junction evolves with two modes was thus still unclear becausebathymetTic
and magnetic
data were lacking
on the flanks
of the
CIR.
In this study we describe the evolution of the CIR domain, and
to a lesser
extent
the SEIR domain,
since
anomaly
4 (8 Ma) using
a compilation
of bathymetric
and magnetic
data
collected
during
several
cruises
in the RTJ area.
We first analyze
the variations
of
the spreading rates on the flanks of the CIR and SEIR. We then
propose a location for the southeastern limit of the CIR domain
(the Capricorn trace of the triple junction) and confirm that an
offset
has existed
between
the CIR and SEIR during
one of the
modes of evolution of the triple junction. We then determine the evolution in time and space of the segments and discontinuities of the CIR domain. Finally, we show that the evolution of the
segmentation
along the CIR and the evolution of the triple
junction are strongly related.
2. Main Topographic Characteristics
of the Indian Ridges at the RTJ
We only give here a summary of the characteristics of the
three axial valleys
in the RTJ area, as they were extensively
described
by Munschy
and Schlich
[ 1989], Mitchell [ 1991
a, b],
Briais [1995], Honsho
et al. [1996], and Sauter
et al. [1997]. We
then focus on the segmentation evolution of the CIR and SEIR from magnetic and bathymetric data. We used multibeam data
collected
during
eight
cruises
(1984-1995;
Table 1 and Figure
1)
with various bathymetric systems (monobeam, Sea Beam,
Hydrosweep,
and Simrad) to produce the most complete
bathymetTic
grid of the RTJ area
(Figures
2a and 2b).
The topography
of the RTJ area (Figures
2a and 2b) is
dominated by the deep SWlR domain bounded by two
asymmetric bathymetric highs with steep scarps facing toward the SWIR and gentle slopes facing away. These bathymetric features correspond, at a regional scale, to the RTJ traces which separate the seafloor generated at the SWlR from the seafloor generated at the SEIR and the CIR on the Antarctic and African plates respectively. These RTJ traces draw a large V pointing toward the northeast and showing the lengthening of the SWlR [Mitchell, 1991a]. The African RTJ trace is relatively continuous from 68ø00'E to 69ø50'E except a small dextral offset at 68ø27'E. The strike of the African RTJ trace varies between N65øE and N95øE; it is different from the mean spreading direction of the CIR (N60øE), indicating that the CIR lengthened toward the southeast at different rates. By contrast, the Antarctic RTJ trace is only continuous and linear from 69ø29'E to 69ø49'E near its eastern
•i,,••;•."..
' o"
MD61
HYdrock
crui
es•
• cruise
-
Rod•'tgtte:
• rztt,•e
v
26øS _--
27øS
;
,
,
,
68øE 69øE ?0øE ?IøE 72øE
Figure 1. Track chart of the study area. Ship tracks from Simrad,
Hydrosweep, and Sea Beam multibeam bathymetry cruises are indicated by solid bold, dashed bold, and solid thin lines, respectively (see Table 1). Ship track from the MD61 cruise is
indicated by a thin dotted line. CIR, Central Indian Ridge; RTJ, Rodrigues Triple Junction; SWIR, Southwest Indian Ridge;
MENDEL ET AL.' EVOLUTION OF THE RODRIGUES TRIPLE JUNCTION 16,565 -
a' I
25 ø 00'S 25 ø 30'S 26 ø Offs 26 ø 30'S 27 ø 00'S[
50
km
68 ø 00'E 68 ø 30'E 69 ø 00'E 69 ø 30'E 70 ø 00'E 70 ø 30'E 71 ø 00'E
Figure 2. Bathymetry of the Rodrigues Triple Junction area. Contour interval is 200 m. Grids were computed with a spatial resolution of 120 m using the multibeam bathymetric data and merged with an other grid that was
computed
with a pixel spacing
of only 1 km using
the monobeam
bathymetric
data
of the MD61 cruise.
end. Elsewhere, it corresponds to a series of en 6chelon fault scarps with 3-5 km offsets to the north every 10-28 km [Sauter et al., 1997]. The strike of the Antarctic RTJ trace varies between N4 IøE and N59øE with a mean value, N48øE, parallel to the mean spreading direction of the SEIR. These small variations indicate that periods of slight lengthening and shortening of the SEIR have alternated and that this ridge kept an almost constant length
since 8 Ma.
The SWIR domain bounded by these two RTJ traces is deeper (mean depth -4200 m) and more rugged than the seafloor generated at the CIR or the SEIR (mean depth -3100 m). Between 68ø10'E and 69ø25'E, the southern flank of the SWIR domain is wider than the northern flank and is characterized by a series of en 6chelon bathymetric highs similar in shape, size, and orientation to the high centered at 69ø30'E near the present-day triple junction [Sauter et al., 1997]. The easternmost segment of the SWIR in the study area is centered at 68ø22'E, about 200 km from the RTJ, over a bathymetric high topped by a volcanic ridge [Rommevaux-Jestin et al., 1997; Mendel et al., 1997].
Within the survey area the CIR axial domain consists of two segments (segments 1 and 2 in the nomenclature of Briais [ 1995] starting from the RTJ). They are trending N 150øE and are 40 and 50 km long, respectively [Briais, 1995]. A nontransform discontinuity (NTD) offsets them, at 25ø10'S, by -20 km. The
northwestern segment of the SEIR, which joins the RTJ, is 85 km
long and trends N140øE [Honsho et al., 1996]. To the south, at
about 26ø05'S, it is bounded by a left-lateral transform fault which offsets the SEIR axis by -26 km [Honsho et al., 1996].
3. Variation of the Spreading Rates
on the Flanks of the CIR and SEIR
Magnetic anomalies have been identified by comparison between all available magnetic profiles in the area, collected during 18 cruises (1960-1995), and synthetic magnetic anomaly profiles which were computed for the CIR and the SEIR (Figure 3). We picked each magnetized block boundary at anomalies 1
(0-0.78 Ma), Jaramillo (0.99-1.07 Ma), 2 (1.77-1.95 Ma), 2a
(2.581-3.58 Ma), 3 (4.18-5.23 Ma), 3a (5.894-6.567 Ma), and 4
(7.432-8.257 Ma) (geomagnetic reversal timescale of Cande and Kent [1995]; Figure 4). These crossings are shown on the structural map of the RTJ area (Figure 5). Owing to their very low amplitudes, magnetic anomalies over the SWIR east of 68ø30'E are difficult to interpret: the Brunhes anomaly is not recognizable until farther west at 68ø15'E [Tapscot.: ct al., 1980]. There are two explanations for this [Patriat and Parson, 1989]: first, the SWIR spreading rate is very slow (<8 km/Myr)and the magnetic reversal is more difficult to interpret; second, the SWIR
16,566
MENDEL ET AL.' EVOLUTION OF THE RODRIGUES
TRIPLE JUNCTION
b. 24 ø 00'S 24 ø 30'S 25 ø 00'S Depth - - 1507 - -2400 - -2600 -2800L -3000
-3200 - -3400 - -3600 - -3800 -4000 ' -4200 -5607m 25 ø 30'S69
ø 30'E
70
ø
00'E
70
ø 30'E
71
ø
00'E
71
ø 30'E
72
ø
00'E
Figure 2. (continued)
Southeast
Indian
Ridge
Central
Indian
Ridge
West
flank
East
flank
West
flank
East
flank
vyi
•,i•••N/ :•;V"•:•:•'•- Model
•y
•4 •a 3 [2a • J• I •J 2 2a
• 3• 3a 4
[4 •a i3 •2a
• $•l•J • 2a•
3 3a 4•
Marion
D,[besne
<•• •h
• • h •fi
• i:•;•:.•:•:?•
i t • •, /x
...
.
.... 2•
, • •.'
":•'•"'•'•'•'•'•"•
[] n
• .
Atlantis
H
Jean
Charcot
__
• •:•5i5•½72dfi•:t
[ ' '
•
m.•.
;• / • •'•:•'Vi '• 2 ••
Marion
Dufresne
Rodriguez 1 (1984) .•-'•7•:•I• -4•
::.•,•5..d•?p•
t:
,
•
w • v •
"•'"'"-"•'•'•••i•:U
•
V •
61
(19R9)
9.
Jean
• leg
Otl•n•
06
Charcot
isH • ...
(1976)'
'l F'"•':•'•$
, c':•'••%
'•:i
•
I h•
F:
t
....
• , ' -• , ' ' '*'"•'•:••:•:'
• ½'•[•••
-'••••
•••'•''•[•'
• • •
Robert
Atlantisll
Co
n,'ad
or,gue
, , , 94)
•
•Aff
, , ....
:'•:,•:::::::::•?•L:•(••:.
:,,
93
leg
. ..
06(1976)
R •ean
odriguez
Charcot
1
(1984)
' •i:•.•:•4{•I•
• '"• •
A
.:n
;n
[ '•'":-'••__fi
' :,
..;•
,.
A ...
Otarles
Darwin
Atlantis
II
, • 'I, • {?•.'.../•g
] • •
Melville
93
1eg06(1976)
[1 [• • '""':"•• '[
lndomed
leg
07
(1978)
-
.
•
•[•"•'•'•1•,
./(
"
Atlantis
II
-k•
-'• ... :'"':'"•':'•'•
... i•
• ....
[ k •il::.•::::<•:•:•:,.:;•
• /•J[
A,.
--93
leg
06
(1976)
ist.nc
rom {km
- '
' ""
t
• •:':::'"•'•:•
[g
z;
(1984)
-2• - 1 • 0 1 • 2•
Distance from axis (km)
Figure
3. (boSom)
Inte•retation
of some
ma•etic
profiles
across
the
Southeast
Indian
Ridge
and
the
Cen•al
Indian
Ridge.
(top)
The
s•thetic
profiles
derive
from
the geoma•etic
reversal
timescale
of Cande
and
Kent
[1995]
and
a •o-dimensional
model
consisting
of a flat
layer
of 300
m thickness
at a depth
of 3000
m with
a
spre•ing
rate
of 47 ••
for
the
Cenml
Indian
•dge and
of 52 •M• for
the
Southeast
hdian
Ridge.
Each
profile
is identified
by
the
name
of the
research
vessel,
the
name
of the
cruise,
and
the
ye• when
the
profile
was
MENDEL ET AL.: EVOLUTION OF THE RODRIGUES TRIPLE JUNCTION 16,567
J.y iJ.o 2:0
1 i:: 2'Yi 2a.y 2a.o 3.y 3.0 3a.y 3a.o 4.y 4.0 ..
..
I •
"2
2a
3
3a 3b 4
4a
Figure 4. Magnetic anomalies and selected isochrons (1-4.o) after the geomagnetic reversal timescale of Cande and Kent [1995].
axis has a general trend which is not orthogonal to the spreading direction and may be cut by closely spaced short offsets or characterized by oblique spreading sections. Hereafter we will refer to the different anomalies by preceding their names by a A for Anomaly.
The half spreading rates of the SEIR and the CIR have been determined between successive isochrons along great circles oriented N48øE and N60øE, respectively. In order to smooth errors due to uncertainties in both the location of magnetic boundaries and the magnetic reversal scale, we only considered distances between isochrons separated by at least 0.6 Myr
(>10 km). Wherever possible, we measured distances between
isochrons in several locations. The half spreading rates given in
Table 2 are averages of these different measurements. Uncertainties on mean half spreading rates average 2.0 km/Myr for the SEIR and 2.3 km/Myr for the CIR. The variation of full
spreading
rate and asymmetry
are presented
in Figures
6a, 6b,
and 6c.
Concerning the SEIR, the mean full spreading rate is 52 km/Myr for the last 8 Myr. Some periods of slower spreading,
like the A2a.o-A3.y and A3a.o-A4.y periods,
and periods
of
faster spreading, like the A3.y-A3.o and A3a.y-A3a.o periods, are observed (Figure 6a). Spreading of the SEIR is symmetric since
A3.y and asymmetric
between
A3.y and A4.o, with a half
spreading
rate 13% greater
for the east
flank than
for the west
one
(Figure
6c). Note that this asymmetry
was determined
with few
anomalies,
especially
from A3a.o to A4.o for the east flank.
However, these results are in agreement with those of Royer and
Schlich
[1988], who observe
an asymmetry
of spreading
before
A3.y on the SEIR between
25ø30'S
and 27øS.
Concerning
the
CIR, the mean full spreading rate is 47 km/Myr for the last 8 Myr. Like the SEIR, periods of slower spreading (A2a.y-A2a.o and A3a.o-A4.y) alternate with periods of faster spreading (A2.y- A2a.y and A4.y-A4.o) (Figure 6a). The CIR was spreading asymmetrically since A1, generating, on average, 33% more crust
on the west flank than on the east one, and between A2a.o and
A4.y, generating
21% more crust
on the east flank than on the
west one (Figure 6b).68ø00'E 69ø00'E 70ø00'E 71 ø00'E
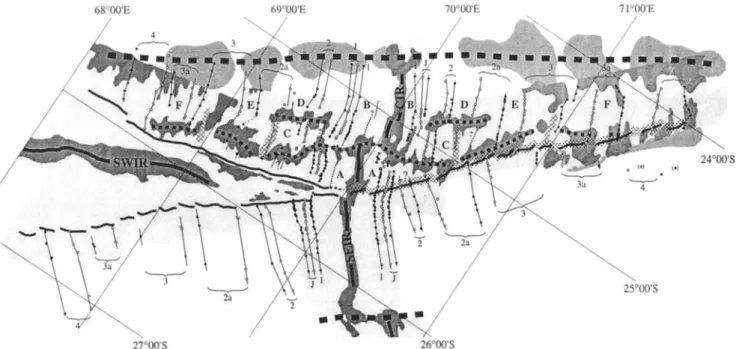
25ø00'S
Figure 5. Structural map of the Rodrigues Triple Junction area. The dark shaded areas correspond to bathymetric lows, while the light shaded areas correspond to bathymetric highs and limit the bathymetric survey area. The medium shaded areas correspond to alfimetric lows. Nontransform discontinuities associated to these lows are shown as bold dashed lines. Letters identify the Central Indian Ridge spreading segments discussed in text. The axes of Indian ridges are shown as bold lines. The anomalies identified are shown by open circles and solid circles which correspond to youngest and oldest boundaries of magnetized blocks, respectively. Thin solid lines represent the isochrons. Solid lines correspond to the African and Antarctic triple junction traces and to the location of the Capricorn triple junction trace deduced from the rotation of the Antarctic triple junction trace onto the Capricorn plate. The stippled area reflects the uncertainties of the location of the Capricorn triple junction trace. The large troughs observed on the Central Indian Ridge domain and interpreted-as traces of Central Indian Ridge axis jumps are shown by thin dotted lines. Abyssal hills disrupting nontransform discontinuities (cross-hatched) are observed
16,568 MENDEL ET AL.: EVOLUTION OF THE RODRIGUES TRIPLE JUNCTION
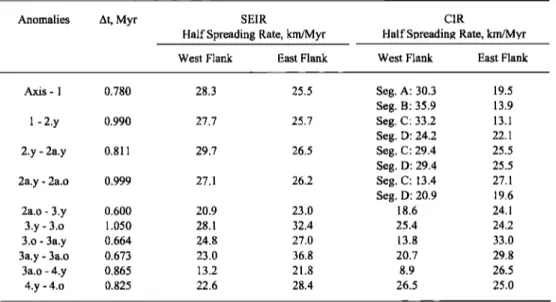
Table 2. Anomaly Interval Half Spreading Rates on the SEIR and the CIR
Anomalies At, Myr SEIR CIR
Half Spreading Rate, km/Myr Half S13reading Rate, km/Myr
West Flank East Flank West Flank East Flank
Axis - 1 0.780 28.3 25.5 Seg. A: 30.3 19.5 Seg. B: 35.9 13.9 1 - 2.y 0.990 27.7 25.7 Seg. C: 33.2 13.1 Seg. D: 24.2 22.1 2.y - 2a.y 0.811 29.7 26.5 Seg. C: 29.4 25.5
Seg. D: 29.4 25.5
2a.y- 2a.o 0.999 27.1 26.2 Seg. C: 13.4 27.1
Seg. D: 20.9 19.6 2a.o - 3.y 0.600 20.9 23.0 18.6 24.1 3.y- 3.0 1.050 28.1 32.4 25.4 24.2 3.0- 3a.y 0.664 24.8 27.0 13.8 33.0 3a.y- 3a.o 0.673 23.0 36.8 20.7 29.8 3a.o -4.y 0.865 13.2 21.8 8.9 26.5 4.y- 4.o 0.825 22.6 28.4 26.5 25.0
Half spreading rates of the Southeast Indian and Central Indian Ridges have been determined between successive isochrons in a N48øE and N60øE direction respectively, where the time span between these isochrons was >0.6 Myr. For the Central Indian Ridge, wherever possible, half spreading rates were determined over each segment (A, B, C, etc.) shown in Figure 5. Before anomaly 2a old, half spreading rates on the Central Indian Ridge were measured over segments E and F (Figure 5). The mean error of half spreading rates is -2.0 km/Myr for the Southeast Indian Ridge and 2.3 krn/Myr for the Central Indian Ridge.
4. Southeastern Limit of the CIR Domain:
Capricorn Trace of the Triple Junction
Owing to their close spreading rates, the CIR and the SEIR have generated seafloor with similar characteristics of depth and roughness. For the last 1 Myr, small changes of SEIR abyssal hills direction toward the CIR domain can be used to locate the boundary area between the CIR and SEIR domains on the Capricorn plate (Figures 2a and 2b). These small strike changes are associated with the deepening of the SEIR and CIR abyssal hills toward the CIR and SEIR domains (Figures 2a and 2b), respectively. Unfortunately, the strike of the abyssal hills older than 1 Myr cannot be precisely determined because multibeam bathymetric data are lacking further to the northeast. The position of the Capricorn RTJ trace must therefore be determined
arbitrarily in order to indicate the probable locations where the
SEIR and CIR should meet between 8 Ma and 1 Ma. For this purpose, we have rotated the Antarctic RTJ trace onto the Capricorn plate. Plate reconstruction vectors, age, and location of the Antarctic RTJ trace are needed to perform this rotation. Because the SWlR domain near the RTJ results mostly from tectonic extension of SEIR and CIR preexisting crust [Sauter et al., 1997], it is difficult to locate accurately the boundary between the SWIR domain and the CIR and SEIR domains. Moreover, the foot of the series of the large normal fault scarps corresponding to the RTJ traces at a regional scale is buried by numerous talus produced by mass wasting processes. We therefore chose to pick the position of the triple junction traces on the summit of these large escarpments that can be followed with ease on the bathymetric map. The resulting error of location is -2-3 km (the mean half width of the deformation zone in the SWlR domain near the triple junction [Sauter et al., 1997]). A similar offset will
thus exist between the predicted triple junction trace on the
Capricorn plate and the position of the trace itself. The age of the Antarctic RTJ trace has been determined by lengthening the isochrons of the SEIR until the trace in a N138øE direction.
Between the isochrons, the age of the trace is linearly interpolated. We then used rotations given by Royer and Schlich [1988], which allow to obtain a satisfying fit between the crossings of the SEIR on the Capricorn plate and the rotated ones of the Antarctic plate. We have not used the projection of the
African RTJ trace to confirm the position of the RTJ trace on the
Capricorn plate because the lack of magnetic profiles near the
African RTJ trace does not allow a well-constrained age determination for this trace. Moreover, it has been previously
suggested by Mitchell and Parson [1993] and Sauter et al. [1997]
that northward relocalizations of the SWlR rifting may have
enclosed part of the series of normal faults, which characterized
the African RTJ trace close to the RTJ [see Sauter et al., 1997,
Figure 11], within the Antarctic plate, leaving little evidence for a precise location of the triple junction trace on the African plate. Between A3.o and the present day, GLORIA images show that the predicted Capricorn RTJ trace falls within a wide transition area with, to the south, bathymetric features parallel to the SEIR abyssal hills, and to the north, lineations striking parallel to the CIR abyssal hills [Mitchell and Parson, 1993]. Before A2a.o the predicted Capricorn RTJ trace falls at the southern edge of a wide and continuous bathymetric low that we have interpreted as the
off-axis trace of an axial discontinuity (Figure 5). Since we used
the top of the escarpments of the Antarctic RTJ trace, the triple junction trace on the Capricorn plate should be located-2-3 km
more to the northwest along the deepest part of the bathymetric
low. The bathymetric trace of this NTD to the west of the RTJ is present in the CIR domain for the same ages but partly buried by the uplift of the structures near the African RTJ trace (Figure 2a) due to isostatic compensations [Mitchell and Parson, 1993]. The section of the predicted Capricorn RTJ trace before A2a.o is
associated with 14-23 km long offsets, measured along the trace, between the CIR and SEIR isochrons (Figure 5). These offsets are difficult to identify on the western CIR and SEIR flanks by rotating the Antarctic RTJ trace onto the African plate using the rotations of Chu and Gordon [1999] for the SWIR. We suggest
MENDEL ET AL.: EVOLUTION OF THE RODRIGUES TRIPLE JUNCTION 16,569
that since the distributed deformation prevents an accurate location of the triple junction traces, especially for the African RTJ trace, it also precludes accurate reconstructions of the offsets on the African and Antarctic plates.
We thus conclude that as in the present-day configuration of the RTJ where there is a small •-5 km offset between the CIR and SEIR axes [Munschy and Schlich, 1989], an axial discontinuity has existed at the triple junction before A2a. o. By contrast, between A1 and A J, the isochrons are continuous across the predicted Capricorn RTJ trace showing only a slight change of strike (Figure 5). Between AJ and A2a.y, the lack of well-identified magnetic anomalies does not allow us to be certain that there is no offset. However, the predicted RTJ trace crosses a bathymetric domain where the abyssal hills show a slight change of strike but neither interruption nor offset (Figures 2a and 7).
5. Evolution of the CIR Segmentation
The CIR domain is bounded to the north by the off-axis traces of the NTD (24ø30'S) between segments 2 and 3 that exists since •-10 Ma (bold dotted line in Figure 5). This domain exhibits a complex morphotectonic pattern dominated by ridge-normal and oblique bathymetric lows that disrupt isochrons and are interpreted consequently as the off-axis traces of axial discontinuities (bold dotted lines in Figure 5). These troughs partition the ridge flanks into rhomb-shaped areas of relatively higher elevation which can be associated to the off-axis traces of segment centers. These areas are formed by a series of abyssal hills, lineated more or less parallel to the present CIR axis (N 150-
160øE), and spaced by •-2-8 km. Near the off-axis discontinuities, some abyssal hills curve toward the troughs showing the sense of
the offsets.
We have identified six major rhomb-shaped areas on the west flank with their conjugates on the east flank (A-F in Figure 5). The oldest one, i.e., area F, is limited to the north by the 24ø30'S NTD off-axis traces and to the south by the RTJ traces from 9 to •-7 Ma (between A4.y and A3a.o) and by a N60øE NTD from -7 to •4.7 Ma (between A3.o and A3.y). Segment F was •-25 km long at---9 Ma (A4a.o). It has lengthened to the south by---25 km during •-2 Myr and has kept a constant length afterward (-50 km). It is separated from area E by a north-south bathymetric trough (Figure 5) that we interpret as being produced during a major tectonic extensional period at about 4.7 Ma. From
Figure 6. (a) Evolution of the full spreading rate along the Central Indian and Southeast Indian Ridges for the last 8 Myr. Dashed lines are mean spreading rates. Shaded stripes are associated to the uncertainties. (b) and (c) Evolution of the spreading asymmetry along the Central Indian and Southeast Indian Ridges, for the last 8 Myr. This percentage has been calculated using mean half spreading rates (Table 2) and is positive when there is more crust created on the west flank than on the east flank and negative in opposite case. Shaded stripes correspond to the error of percentage relative to errors of distance measurements between isochrons. (d) Evolution of the apparent offset between the Southeast Indian Ridge and Central Indian Ridge isochrons. These offsets are measured along the predicted Capricorn triple junction trace. Between anomaly 2a young and
anomaly 1, the curvature of the Central Indian Ridge and Southeast Indian Ridge isochrons close to the Capricorn triple junction trace compensates for the real offsets leaving apparent zero offsets.
•4.7 to •-3 Ma (between A2a.o and A2a.y), segment E, which was initially 50 km long, has lengthened to the south by -15 km. At
•-3 Ma a new NTD separated this segment E in two new segments (D and C). From •-3 to •-1.3 Ma (between A2.y and AJ.o),
segment D has kept a constant length, 45 km, while the length of
30
2.y 2a.o 3.0 3a.o 4.0
1 2a.y 3.y 3a.y 4.y
CIR
_
:
b. CIR
60
1;.
seg...
:
...
B seg..:
...
Ci
West.flan.
k
20
':';':""'•
seg.
D
1
...
}
seg.
D
• :
•-•:•i::•:a•:•:a•s• ... . ... ß J. '-60
...
•"••'•'•••••
We•t
fiank
0 2 4 6 8 c. SEIR 60 40 20 0-40
-60 :: West flank : i East flank : : : ... ! ... ::•.--'.::•:•::4":::.::i:"'...'-'"2.;...•:,: _. : : :: ."• ... :"• East flank i i West flank : : i E : : :! ' I ' I * I '
0 2 4 6 d.,• 20
• 10
0 I0
2
•,
6
8
Age (Ma)16,570 MENDEL ET AL.: EVOLUTION OF THE RODRIGUES TRIPLE JUNCTION 25 ø 20'S 25 ø 30'S 25 ø 40'S 25 ø 50'S 26 ø 00'S 26 ø 1 O'S
-
•}:•::- . .[,,.....
..
ß
..
"•?•
:'X
...
• •N
...
'"
•'•::::•::"
• -" •
'%
'"•'""
¾•:'•:•:•::":'""
"':
"'
•. • .... •' -.. 'V¾ •. ' :'::•5-5•. • ... ...: ß '- •:• ... •. q"•e--:5• ... SEIR'•:• "..: - ,. -. .... '•.. - .. .,..>: • ...I10
km
I
...
•X••••
ß •' ... '•'" ' ...• • .•'•••••
• "• '• • '%769 ø 50'E 70 ø 00'E 70 ø 10'E 70 ø 20'E 70 ø 30'E 70 ø 40'E
Figure
7. The abyssal
hill system
of the Southeast
Indian
Ridge
enhanced
by calculating
the principal
curvatures
at
each
pixel
of the bathymetric
grid.
Shaded
areas
correspond
to ridges.
The shading
scale
is related
to the amplitude
of the
ridge:
solid
areas
correspond
to ridges
that
are well marked
in the topography.
Successive
ridges
and
troughs
are found at about the same age on each flank.
segment
C has
varied
between
16 and 27 km. Discontinuity
D-C
was a small
right-stepping
offset
(about
8 km). It disappeared
at
-1.3 Ma, when
segments
C and D joined together
to create
a new
60 km long segment,
segment
B, which
corresponds
to the off-
axis trace of the present-day
CIR segment
2. During the last
1 Myr, this segment has shortened by-10 km. On the west flank,
segment
B is characterized
by the presence
of a topographic
high
(centered
at 69ø46'E-25ø17'S),
which
was interpreted
by Mitchell
et al. [ 1998]
as a corrugated
surface.
At about
2.6 Ma (A2a.y)
a
new segment (A) took place to the south of segment C, near the
RTJ. Segment
A corresponds
to the off-axis
trace
of the present-
day CIR segment 1. Since -2.6 Ma, it has lengthened to the north
and the south
reaching
40 km long at the present
time. Before
-1.3 Ma (between A2.y and AJ.o), segment A was bounded to
the north by discontinuity
C-A, which is probably
a small
right-stepping
offset. However,
for this period
the lack of well-
constrained magnetic anomaly on segment A does not allow an
A2a. y, to the south of discontinuity D-C (thin dotted line in Figure 5), which has no conjugate on the opposite flank. This bathymetric trough can be interpreted as a relic of an axial valley and so suggests that the offset D-C results from a CIR axis jump to the southwest of-8 km rather than a continuous asymmetry. In the same way, between A2.y and AJ.o, an asymmetry of spreading is observed to the south of discontinuity D-C, while the spreading is symmetric to the north (Figure 6b). A large
bathymetric trough is also observed on the west flank, between
A2.y and AJ.o and to the south of discontinuity D-C (thin dotted line in Figure 5), without a conjugate feature on the east flank. As previously, we can interpret this trough to be a part of a former axial valley. So, we suggest that the offset D-C was suppressed by a CIR axis jump, of-8 km, to the northeast rather than by a
continuous
asymmetry.
Such CIR jumps have been already
proposed to explain the asymmetry observed between anomaly 1
and the CIR axis [Honsho
et al., 1996]. On segment
A the jump
accurate
estimation
of this
offset.
At-1.3 Ma, discontinuity
C-A' has
left,
on the
west
flank,
a large
topographic
trough
interpreted
became
discontinuity
B-A, which offsets
segments
A and B in a
right-stepping
manner
by-16 km from
AJ.o to A1 and
by 20 km
at the present time.The analysis
of bathymetric
and magnetic
data
has shown
that
the discontinuity
D-C is a very short-lived
feature.
It appeared
at
-3 Ma (between
A2a.o and A2a.y) and disappeared
at-1.3 Ma
(between A2.y and AJ.o). Its "birth" and "death" are associated to spreading rate contrasts between segments C and D. The distance
between
isochrons
A2a.o and A2a.y shows
an asymmetry
of
spreading
to the south
of discontinuity
D-C, while the spreading
to the north
is symmetric
(Figure
6b). Furthermore,
bathymetric
data show a large trough on the east flank, between A2a.o andas a fossil axial valley and characterized by high magnetization [Honsho et al., 1996]. The asymmetry, which is greater for segment B (i.e., segment 2) than for the segment A (i.e., segment
1) (Figure 6b), has increased the offset A-B.
6. SEIR Abyssal Hill System
Although the bathymetric and magnetic coverage of the SEIR domain near RTJ is more restricted than along the CIR, the structure of the SEIR domain looks less complex than along the CIR. The linear isochrons of the SEIR, especially on the west flank, show that the first segment of the SEIR south of the RTJ is
MENDEL ET AL.: EVOLUTION OF THE RODRIGUES TRIPLE JUNCTION 16,571
a long-lived feature, which was not disrupted by NTDs since
9 Ma at least. Owing to the limited bathymetric coverage, we have analyzed the SEIR abyssal hill system only for this segment and for the last 1 Myr.
The pattern of abyssal hills (Figure 7) over the SEIR has been
enhanced by calculating the principal curvatures around each
pixel of the bathymetric grid following Shaw and Lin [ 1993 ]. The
abyssal hills have a mean strike of N138øE and are regularly occurring every 4-5 km. Like the axial volcanic ridge on the SEIR inner valley floor, they are crowned by numerous conic-
shaped peaks, indicating that they result to some extent from volcanic processes. Close to the axis, the abyssal hills are
asymmetric in shape with steep inward facing faults and more
gentle slope facing toward the flanks. Outward facing faults
become as numerous as inward facing faults at 18 km (-0.7 Ma) from the axis, producing a typical horst- and graben-type relief. The most striking features in the organization of the off-axis terrain is the almost perfect symmetry between the ridges on each side of the SEIR axis. Figure 7 shows that the successive ridges are found at almost the same age on each flank. Although the southwestern flank has been uplifted near the Antarctic RTJ trace,
the similarity between the amplitude of the abyssal hills on each
flank is also noticeable (dotted lines in Figure 7). This spatial
relationship is in agreement with the work of Kappet and Ryan [1986] and Pezard et al. [1992], who explained the generation of
the rift flanking topography of the intermediate-spreading Juan de Fuca Ridge and Galapagos Ridge, respectively. They proposed a
cyclic process in which the volcanic construction of a crestal
ridge within the rift valley, accompanying active crustal accretion, is followed by a collapse and splitting of the summit
region of this ridge when there is a reduced melt supply to the axial magma chamber. Each part of the axial ridge is then shifted
on the flank, producing the observed symmetric organization of
abyssal hills. The topography of the SEIR flanks probably results
from such cyclic processes. The formation of a new SEIR crestal
ridge, due to an increase of volcanic constructions, is often
associated with a slight northward lengthening of the ridge, creating the en 6chelon pattern of the Antarctic RTJ trace [see Sauter et al., 1997, Figure 10). This small lengthening of the SEIR is coincident with the redistribution of the deformation at the RTJ when it is relocated to the north [Sauter et al., 1997]. We thus suggest that both the increase of SEIR volcanic processes and the redistribution of deformation at the RTJ favor small lengthening of the SEIR.
7. Results and Discussion
The analysis of the bathymetric and magnetic data of the CIR domain near RTJ has shown that since at least 8 Ma, the CIR was lengthening continuously, more or less rapidly, to the southeast
and that periods of asymmetric and symmetric spreading have
alternated. Furthermore, the short-lived NTDs as well as the segments that lengthen or shorten along the ridge axis have revealed that the CIR segmentation is unstable.
The triple junction configuration also changes through time.
We have shown that an axial discontinuity has existed between the CIR and SEIR axis from 9 to 3 Ma and disappeared afterward. Moreover, the SEIR is characterized by frequent occurrence of periods of discontinuous lengthening, which generated the en 6chelon pattern of the Antarctic RTJ trace.
The third branch of the triple junction, i.e., the SWIR,
propagates in a preexisting seafloor created at the CIR and SEIR
axes. However, contrary to the SEIR and the CIR, there is no
"normal"
seafloor
spreading
on the SWIR near the RTJ, the first
spreading
segment
closest
the RTJ is at only 200 km from it, and
tectonic
processes
are predominant
in this domain
[Sauter
et at.,
1997]. Sauter
et at. [1997] proposed
that the evolution
of the
SWIR domain
is probably
related
to different
localizations
and
distributions of strain which are in mm controlled by changes ofthe triple
junction
configurations.
We thus
suggest
that both the
evolution
of the segmentation
of the CIR and the SEIR and the
modes
of propagation
of the SWlR domain
are strongly
related
to
changes of the triple junction configuration. 7.1. Capricorn RTJ Trace: A Record
of the Past RTJ Configuration
The velocity triangles [Patfiat and Courtillot, 1984] of the
RTJ describe the offset evolution between the CIR and the SEIR.
To built these triangles, we used the CIR and SEIR spreading
rates
(Table
2) and the directions
of the isochrons
and of the RTJ
traces (Figure 5). The CIR and SEIR spreading directions are
given by the rotations
of Royer et at. [1997] for the CIR and
Royer
and Schtich
[1988] for the SEIR. Owing to the lack of
recognizable magnetic anomalies, the SWIR spreading rate, as
well as the SWIR spreading
direction,
is given by the rotation
of
Chu and Gordon [ 1999].Between A2a. o and A4.o, the predicted Capricorn RTJ trace is associated with 14-23 km long offsets (Figure 6d). The velocity
triangle
built for the period
between
A3.o and A2a.
o (Figure
8a)
shows a 1.8 km/Myr offset lengthening rate between the CIR and
SEIR axes. This rate is small but remains significant. When
integrated
between
A3a.o and A2a.
o (-3 Ma), it is equivalent
to a
finite -5.4 km long offset between the two ridges. Adding this offset to the initial 14.2 km long offset at A3a.o (Figure 6d) results in a 19.6 km long offset at A2a.o, which is consistent with the 19.5 km long offset measured at this time (Figure 6d).
For the period between
A2a.y and A1, there is no offset
between the SEIR and CIR isochrons (Figure 6d), whereas the
velocity
triangle
(Figure
8b) shows
an offset
lengthening
rate of
6 km/Myr between
the CIR and SEIR axes,
which
means
that the
offset increased by 10.8 km between A2a.y and A1. One
possibility
is that
the progressive
curvature
of the SEIR and CIR
isochrons and abyssal hills near the Capricorn RTJ trace (Figure 5) compensates for small offsets (<6-7 km), leaving apparent zero offsets. From -2.6 Ma (A2a. y) to -0.5 Ma, the abyssal hills of the SEIR and the CIR curve gently near the predicted Capricorn RTJ trace to connect each other (Figure 7). During this period the
predicted
Capricorn
RTJ trace
corresponds
to a relative
low along
these continuous abyssal hills. The abyssal hills begin to curve at
-5 km from the predicted
Capricorn
RTJ trace at AJ.o, whereas
they
curve
farther
away
from this
trace
(-10 km) at 0.5 Ma as the
offset at the RTJ is increasing. Removing this curvature by
straightening
the CIR and SEIR isochrons
results
in a 6 km long
offset
along
the Capricorn
RTJ trace
at A1. In the same
way, the
offsets at AJ.y and AJ.o should be -6 and-5.5 km long,
respectively.
The lack of well-constrained
magnetic
anomalies
on
CIR segment
A, from
A2a.y
to A2.y, does
not allow
estimation
of
the offset for this period. However, taking into account a 6 km
long offset at A1 and the offset evolution
given by the velocity
triangle
for the A2a.y-A1
period,
the CIR axis should
have
been
offset by 4.8 km to the south
of the SEIR axis at A2a.y. The
velocity triangle
built for the period between
A2a.y and A2.y
(Figure 8b(left)) shows that this small left-stepping
offset
remained
roughly the same during this period. This unusual
configuration
of the CIR and SEIR axes could explain the
16,572 MENDEL ET AL.: EVOLUTION OF THE RODRIGUES TRIPLE JUNCTION Capricorn a. A3.o- A2a.o Afric Antarctica i i
10
km/Myr
Capricorn
b. A2a.y - A16.o
kn,y
Africa
i.•
...•....'""
w&/X
Antarctica
(left) A2a.y -
q"•%0.9
kngMyr
•//\ \ OLR
li) km/M•/r
(right)
•,A2.y
/•.'.,/ 11.7-
A••,•
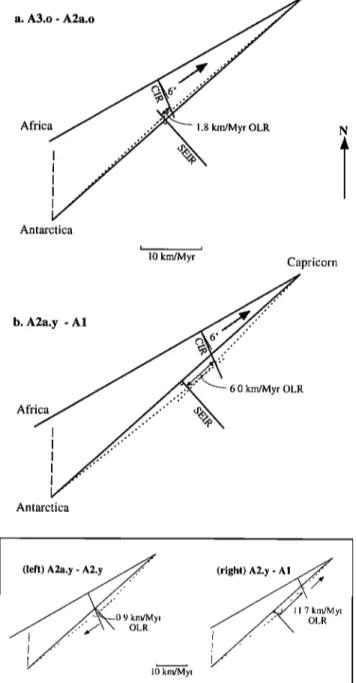
kin/My,Figure 8. Velocity triangles built for (a) the period between anomaly 3a old and anomaly 2a old and (b) the period between
anomaly
2a young
and anomaly
1. The Central
Indian
Ridge and
Southeast
Indian Ridge spreading
directions
are given by the
rotations of Royer et al. [1997] and Royer and Schlich [1988], respectively. The Southwest Indian Ridge spreading direction and rate are given by the rotation of Chu and Gordon [1999] (long-
dashed
line). The short-dashed
lines are the 0.8-2.6 Ma (Figure
8a) and 3.6-6.6 Ma (Figure 8b) mean azimuths of the African and Capricorn triple junction traces taken from Figure 5. The offset
between
the Central Indian Ridge and Southeast
Indian Ridge
axes increases at different rates, varying between 0.9 and 11.7 km/Myr (OLR, offset lengthening rate). The shaded arrows
indicate
the general
displacement
of the Central
Indian
Ridge
axis
with respect
to the Southeast
Indian Ridge axis. The Rodrigues
Triple Jucntion trace on the African plate is not shown because
northward
relocalizations
of the Southwest
Indian
Ridge rifting
may have
enclosed
part of Central
Indian
Ridge
preexisting
crust
within the Antarctic
plate, leaving
little evidence
for a precise
location of the trace on the African plate [Mitchell and Parson,
1993; Sauter et al., 1997].
which curve to the west toward the predicted Capricom RTJ trace at A2a.y-A2.y (Figures 5 and 7). The transition between this configuration and the present one, where the CIR axis is offset to the north of the SEIR axis, occurred between A2.y and AJ.o,
when the CIR spreading was highly asymmetric (Figure 8b(right)). This asymmetry is probably related to a CIR axis jump
to the northeast at the same time than another ridge jump on CIR segment C. Finally, when the offset is too large (>6-7 km) to be compensated by a long-wavelength curvature of the abyssal hills of the SEIR and the CIR, the deformation is focused in a NTD that takes place at the RTJ, and thus the axes are no longer connected. However, a curvature of the abyssal hills of the CIR and the SEIR toward the NTD can still be observed in some places. At the present time, for example, the CIR axis curves to the west toward the RTJ, and a 5.5 km long apparent offset can be measured (Figures 5 and 6d). If we straighten the CIR axis, the offset between the CIR and SEIR axes is -9 km long.
At about A3.o, for a short period of time, offsets of isochrons are no longer associated with a bathymetric low corresponding to a NTD but with a bathymetric high characterized by CIR axis-parallel structures that cross the discontinuity. Similar
features have been previously described by Grindlay et al. [ 1991 ]
for the NTDs of the south Mid-Atlantic Ridge. We suggest that
the CIR features were produced during a period of high melt
delivery and lengthening trough the NTD toward the SEIR flank. This lengthening occurred when the offset of the RTJ between A2a.o and A4.o was the smallest.
7.2. Two Configurations for the RTJ
The morphology of the Antarctic RTJ trace on the GLORIA images was one of the major reason for Mitchell and Parson [1993] to consider two modes of evolution for the RTJ: a discontinuous mode when the Antarctic RTJ trace is associated with a series of en 6chelon faults and a continuous mode when
the Antarctic RTJ trace corresponds to a long linear scarp. The bathymetric data over the triple junction traces have shown that
the most recent period of continuous mode is shorter than
previously defined by Mitchell and Parson [1993]: it extends from A2a.y to A1. During this period, the CIR and SEIR axes are connected, the SEIR is spreading symmetrically, and the CIR spreading is mostly symmetric but is asymmetric near the triple
junction trace, producing more crust to the western flank. As
previously mentioned, owing to spreading asymmetry and to differences in axis direction or in lengthening rates of the CIR and the SEIR, this RTJ configuration evolves rapidly (<2 Myr)
into another configuration where there is a small offset between
the CIR and SEIR axes (Figure 9b). The "appearance" of this offset, just after A l, coincides to a slight lengthening of the SEIR to the northwest as shown by the en 6chelon pattern of the Antarctic RTJ trace. Thus this suggests that a new period of discontinuous mode began just after A1. This period also corresponds to an asymmetric spreading period of the CIR (since
A1) that increased the offset between the SEIR and CIR axes
(Figure 9b). In contrast with the findings of Honsho et al. [1996], we consider that this asymmetry of the CIR spreading is the result of a CIR axis eastward jump and not of a very short-lived (<0.5 Ma) northward propagation of the SEIR (of >25 km into CIR segment 1). We argue that no pseudo-fault of this propagating rift is observed on the bathymetric map (Figures 2a and 2b) and that not only CIR segment 1 but also CIR segment 2 shows the same asymmetric pattern (Figure 6b).
The main characteristic of the discontinuous mode is the offset