HAL Id: hal-00297068
https://hal.archives-ouvertes.fr/hal-00297068
Submitted on 2 Jan 2008
HAL is a multi-disciplinary open access
archive for the deposit and dissemination of
sci-entific research documents, whether they are
pub-lished or not. The documents may come from
teaching and research institutions in France or
abroad, or from public or private research centers.
L’archive ouverte pluridisciplinaire HAL, est
destinée au dépôt et à la diffusion de documents
scientifiques de niveau recherche, publiés ou non,
émanant des établissements d’enseignement et de
recherche français ou étrangers, des laboratoires
publics ou privés.
Simultaneous monitoring of a collapsing landslide with
video cameras
K. Fujisawa, J. Ohara
To cite this version:
K. Fujisawa, J. Ohara. Simultaneous monitoring of a collapsing landslide with video cameras.
Ad-vances in Geosciences, European Geosciences Union, 2008, 14, pp.183-187. �hal-00297068�
www.adv-geosci.net/14/183/2008/ © Author(s) 2008. This work is licensed under a Creative Commons License.
Geosciences
Simultaneous monitoring of a collapsing landslide with video
cameras
K. Fujisawa and J. Ohara
Public Works Research Institute, Japan
Received: 19 June 2007 – Revised: 7 August 2007 – Accepted: 8 August 2007 – Published: 2 January 2008
Abstract. Effective countermeasures and risk management
to reduce landslide hazards require a full understanding of the processes of collapsing landslides. While the processes are generally estimated from the features of debris deposits after collapse, simultaneous monitoring during collapse pro-vides more insights into the processes. Such monitoring, however, is usually very difficult, because it is rarely possible to predict when a collapse will occur. This study introduces a rare case in which a collapsing landslide (150 m in width and 135 m in height) was filmed with three video cameras in Higashi-Yokoyama, Gifu Prefecture, Japan. The cameras were set up in the front and on the right and left sides of the slide in May 2006, one month after a series of small slope failures in the toe and the formation of cracks on the head indicated that a collapse was imminent.
The filmed images showed that the landslide collapse started from rock falls and slope failures occurring mainly around the margin, that is, the head, sides and toe. These rock falls and slope failures, which were individually counted on the screen, increased with time. Analyzing the images, five of the failures were estimated to have each produced more than 1000 m3of debris, and the landslide collapsed with sev-eral surface failures accompanied by a toppling movement. The manner of the collapse suggested that the slip surface ini-tially remained on the upper slope, and then extended down the slope as the excessive internal stress shifted downwards. Image analysis, together with field measurements using a ground-based laser scanner after the collapse, indicated that the landslide produced a total of 50 000 m3of debris.
As described above, simultaneous monitoring provides valuable information about landslide processes. Further de-velopment of monitoring techniques will help clarify land-slide processes qualitatively as well as quantitatively.
Correspondence to: K. Fujisawa
(fujisawa@pwri.go.jp)
1 Introduction
Effective countermeasures and risk management to reduce landslide hazards require a full understanding of the pro-cesses of collapsing landslides. While the propro-cesses are gen-erally estimated from the features of debris deposits after col-lapse, simultaneous monitoring during collapse would pro-vide more insights into the processes. Such monitoring, how-ever, is usually very difficult, because it is almost impossible to predict when a collapse will occur until just before the col-lapse.
Images of the movement of landslides are rarely obtained, but exceptions in recent years include a landslide in the Ui District of Oto-mura Town in Nara Prefecture on 10 August 2004 (Nomura and Fujisawa, 2006) and another landslide in the Higashi-Yokoyama District of Ibigawa Town in Gifu Prefecture from 12 to 13 May 2006 (Fujisawa et al., 2006). Clarifying the processes and characteristics of movements that precede a landslide by analyzing these images will pro-vide valuable information for developing landslide counter-measures and risk management techniques (Fujisawa et al., 2007).
Therefore, the authors analyzed the images obtained by photographing the movement of the Higashi-Yokoyama Landslide.
2 Overview of the Higashi-Yokoyama landslide
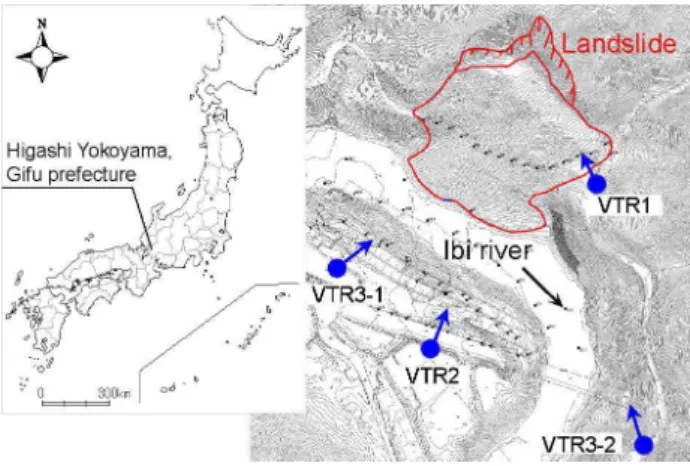
The Higashi-Yokoyama landslide occurred on 13 May 2006 along the left bank of the Ibi river, Gifu Prefecture (Fig. 1). The site is situated approximately two kilometers down-stream from the Yokoyama Dam operated by the Min-istry of Infrastructure, Land and Transport, and approxi-mately 3.5 km upstream from the Kuze Dam operated by the Chubu Electric Power Company. The landslide measured
184 K. Fujisawa and J. Ohara: Simultaneous monitoring of a collapsing landslide
Figure 1. Location of Higashi-Yokoyama landslide and video cameras
Fig. 1. Location of Higashi-Yokoyama landslide and video cam-eras.
approximately 150 m in width by 135 m in height, with a vol-ume of approximately 250 000 m3(Fig. 5).
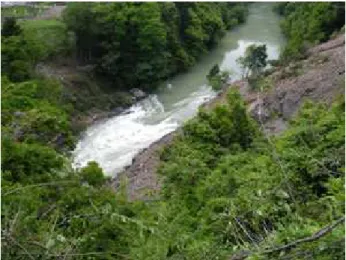
Image analysis, together with field measurements using a ground-based laser scanner after the collapse, indicated that the landslide produced a total of 50 000 m3 of debris. It flowed into the river during the landslide. As Fig. 6 shows, this blocked some two-thirds of the width of the river, and also caused damage to several local roads, but most of the landslide body remained on the affected slope.
The landslide occurred on a steep slope with an average inclination of 35◦ located between elevations of 145 m and
270 m facing the Ibi River. The ground, composed chiefly of clay slate in a Mino zone from Mesozoic and Paleozoic strata of the Permian period, is in a reverse-dip slope. The head and toe of the landslide showed evidence of severe weathering. A crush zone with reverse-dip slope was identified in the loose region around the toe.
3 Methodology
A monitoring camera was set up by the landslide beforehand and the image was taped during collapse. Later the analysis with the taped image was carried out to help understand the mechanism of landslide collapse.
Images were obtained for approximately 22 h from 12:00 noon on 12 May to 10:00 a.m. on 13 May 2006 when the landslide was photographed. The scale of the image was approximately 1:1000, and 1 m was the minimum recog-nizible size. Based on the images and topographical maps, soil collapses of about 1000 m3or more were abstracted and sketches of the movement of the landslide were made. The frequencies with which rocks fell, the slope collapsed, and trees were toppled were recorded, and the changes that were visible until the landslide movement began were summa-rized. The movement of the landslide accompanying the largest scale collapse at 7:59 a.m. on the 13th of the same
month formed the final landslide. The movement mentioned above was studied in greater detail by preparing sketches of the downward slip from the images.
Phenomenon was categorized into “collapses” when to-pographic changes were confirmed and into “rock falls” when only rock falls were observed without any topographic change.
4 Analysis of the results
4.1 History of slope movements prior to the start of the
landslide
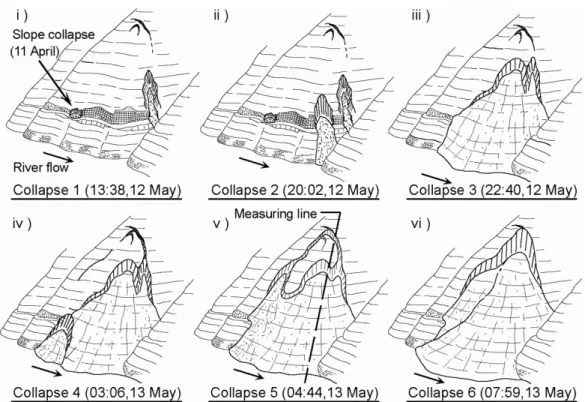
The analysis of images before and after the landslide showed that the slope collapse involved debris in excess of 1000 m3, and that six separate landslide events occurred. Figure 2 shows sketches of each landslide event, numbered 1 through 6. Based on analysis of the images, the sequence of events leading to the landslide is thought to be as follows:
1. Slope collapse is confirmed on the slope next to the road on the mountain on 11 April. A major crack is identified at the top of the slope on 21 April. A slope collapse of approx. 2000 m3(Fig. 2i) occurs near the downstream extension of the crack at 13:38 on 12 May.
2. Several minor falling rock events occur in the region of Collapse 1 followed by a further slope collapse on
11 April. A second slope collapse of around 1000 m3
(Fig. 2ii) occurs at 20:02 on 12 May a short distance upstream of Collapse 1.
3. A steady succession of falling rock and slope collapse events begins at 22:23 on 12 May, in the vicinity of Col-lapses 1 and 2, leading to a major slope collapse of ap-proximately 10 000 m3at 22:40 (Fig. 2iii).
4. After a brief hiatus following Collapse 3, the next major slope collapse (Fig. 2iv, estimated at 1000 m3)occurs at 03:06 on 13 May near the foot of the slope on the up-stream side. Due to the camera angle and poor visibil-ity at night, the images provide only limited detail, al-though evidence of localized tree shaking suggests that the crack at the head of the landslide was beginning to extend upstream of the slope.
5. A further slope collapse (Fig. 2v, 1000 m3) occurs at 04:44 on 13 May on the slope further up the slope from Collapse 4.
6. Falling rock and slope collapse events begin at approx-imately 07:40 on 13 May on the middle and lower part of the slope and become more frequent, culminating in a major slope collapse (Fig. 2vi, 40 000 m3)at 07:59. This is followed by more falling rocks and minor col-lapses, but without any further significant topographical
Figure 2. History of collapses
Fig. 2. History of collapses.
deformation. The slope after the final landslide is simi-lar to the state after Collapse 6.
Thus, the sequence of events leading up to the landslide began with collapses at the periphery of the landslide area (from the head to the sides and toe), where the effect of stress caused by movement is most apparent, followed by an in-creasing incidence of falling rocks and minor collapses in the area.
Figure 3 shows the count of falling rock events, slope col-lapses and fallen trees. Prior to the six major colcol-lapses, the frequency of these events steadily increased. The rate of in-crease was particularly pronounced prior to the two largest collapses (numbers 3 and 6).
4.2 History of slope movements accompanying the
land-slide that occurred at 7:59 a.m. on 13 May
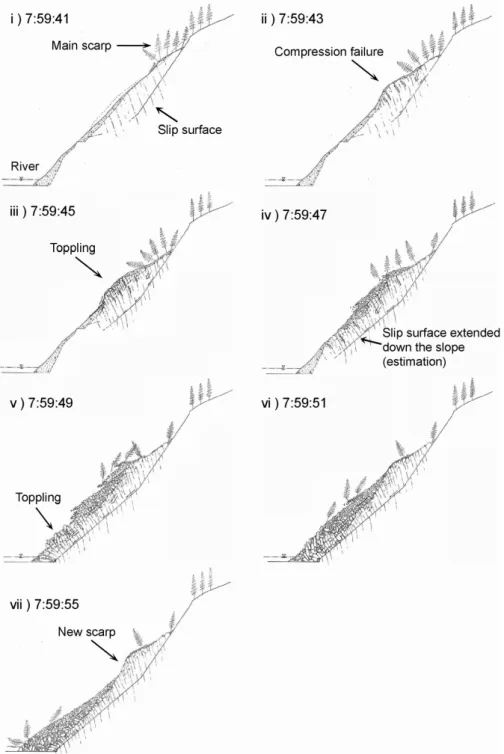
Figure 4 shows the results of sketches made for about 20 s during the movement of Collapse 6 shown in Fig. 2 (occur-ring at 7:59 a.m. on 13 May), the largest slide that occurred while the landslide moved.
As shown in Fig. 4, the section diagrams were estimated based on several images taken from some different angles representing the 20 s from 07:59:35 to 07:59:55 on 13 May. These section diagrams were prepared along the measuring line shown in Fig. 2v. These were used to study the state of change of the moving soil mass accompanying the movement of the landslide.
Figure 3. Other events — falling rocks, slope collapses and fallen trees Fig. 3. Other events – falling rocks, slope collapses and fallen trees.
The results showed that cracks formed in the landslide body located below the main scarp at the time of Collapse 5, and the collapse expanded from that location. When the land-slide started to move, many collapses began to occur along the edges of the landslide (head – side/toe) (Fig. 4i). The movement of the landslide is thus assumed to be accompa-nied by a toppling movement (Fig. 4ii–iii). Afterwards, the head to the middle of the landslide body was crushed, re-sulting in the formation of debris deposit. (Fig. 4iv) As this debris deposit covered the entire lower part of the slope, the toppling was confirmed at the toe of the landslide (Fig. 4v– vi). It is presumed that the toppling occurred at the toe of the
186 K. Fujisawa and J. Ohara: Simultaneous monitoring of a collapsing landslide
Figure 4. History of collapses during sliding of Collapse 6 (occurring at 7:59 a.m. on May 13) Fig. 4. History of collapses during sliding of Collapse 6 (occurring at 7:59 a.m. on 13 May).
landslide because the stress produced by the movement of the landslide reached the lower part of the slope. The landslide body remained near the top of the slope; however, because the collapse flowed downward with the toppling, a new scarp was formed near the center of the slope (Fig. 4vii).
5 Considerations
Judging from the analysis of the landslide images of Col-lapses 1 and 2 (Fig. 2), the first colCol-lapses that were the precur-sors of the landslide occurred mainly at the top of the grating crib works on the mountain side of the road, and the collapse phenomenon just before the sliding of Collapse 6 also oc-curred mainly at the top of the grating crib works. Thus, it
Photo 1. General view of the landslide site (May 14, 2006)
Fig. 5. General view of the landslide site (14 May 2006).
can be assumed that, until just before Collapse 6, the toe end of the landslide was located slightly above the road. But on the downstream side of the landslide, it was confirmed that the toppling phenomenon that occurred from the head to the middle part of the landslide spread to the toe of the land-slide. Therefore, the stress produced by the movement of the landslide in Collapse 6 reached the lower part of the slope, expanding the slip surface downstream to the road.
6 Summary
This analysis of such phenomena as falling rocks and col-lapses caused by a landslide based on images of the Higashi-Yokoyama Landslide helped to clarify the mechanism of landslides and the following points:
1. At the initial stage of a landslide, rocks fall and slope collapses mainly occur on the edges (head – side/toe) of a landslide.
2. The stress created by the movement of the landslide reaches the lower part of the slope, thereby expanding the location of the slip surface downward.
3. A large-scale slide is preceded by a rise in the frequency of rock falling and of slope collapsing.
As described above, simultaneous monitoring provides valuable information of landslide processes. Further devel-opment of monitoring techniques will help improve our un-derstanding of landslide processes qualitatively as well as quantitatively.
Photo 2. Debris deposits in the river course (May 14, 2006)
Fig. 6. Debris deposits in the river course (14 May 2006).
Edited by: P. Fabian
Reviewed by: M. Larsen and B. Riedel
References
Nomura, Y. and Fujisawa, K.: An analysis of landslide risk manage-ment on the basis of the movemanage-ment characteristics – On landslide disaster that caused damage to a highway in Oto Village, Nara Prefecture, Journal of the Japan Landslide Society, 42, 467–474, 2006.
Fujisawa, K., Ikeda, M., and Higuchi, K.: Preliminary report on the landslide at Higashi-Yokoyama, Ibigawa-cho, Gifu Prefecture, Journal of the Public Works Research Institute, 48, 4–5, 2006. Fujisawa, K., Ohara, J., Okada, F., Shichi, M., Yoshida, T., and
Hagiwara, Y.: Risk management for landslide disasters – in the case of the Higashi-Yokoyama landslide, Japan, International Seminar on Risk Management for Roads, PIARC TC3.2 and the Government of Colombia, 2007.