HAL Id: hal-01597280
https://hal.archives-ouvertes.fr/hal-01597280
Submitted on 28 Sep 2017
HAL is a multi-disciplinary open access
archive for the deposit and dissemination of
sci-entific research documents, whether they are
pub-lished or not. The documents may come from
teaching and research institutions in France or
abroad, or from public or private research centers.
L’archive ouverte pluridisciplinaire HAL, est
destinée au dépôt et à la diffusion de documents
scientifiques de niveau recherche, publiés ou non,
émanant des établissements d’enseignement et de
recherche français ou étrangers, des laboratoires
publics ou privés.
Near-field deformation of a liquid interface by atomic
force microscopy
Caroline Mortagne, Véronique Chireux, René Ledesma Alonso, Maëlle Ogier,
Frédéric Risso, Thierry Ondarçuhu, Dominique Legendre, Philippe Tordjeman
To cite this version:
Caroline Mortagne, Véronique Chireux, René Ledesma Alonso, Maëlle Ogier, Frédéric Risso, et al..
Near-field deformation of a liquid interface by atomic force microscopy. Physical Review E : Statistical,
Nonlinear, and Soft Matter Physics, American Physical Society, 2017, vol. 96 (n° 1), pp.
012802/1-012802/7. �10.1103/PhysRevE.96.012802�. �hal-01597280�
O
pen
A
rchive
T
OULOUSE
A
rchive
O
uverte (
OATAO
)
OATAO is an open access repository that collects the work of Toulouse researchers and
makes it freely available over the web where possible.
This is an author-deposited version published in :
http://oatao.univ-toulouse.fr/
Eprints ID : 18489
To link to this article : DOI:10.1103/PhysRevE.96.012802
URL :
http://dx.doi.org/10.1103/PhysRevE.96.012802
To cite this version : Mortagne, Caroline and Chireux, Véronique and
Ledesma Alonso, René and Ogier, Maëlle and Risso, Frédéric and
Ondarçuhu, Thierry and Legendre, Dominique and Tordjeman,
Philippe Near-field deformation of a liquid interface by atomic force
microscopy. (2017) Physical Review E, vol. 96 (n° 1). pp.
012802/1-012802/7. ISSN 1539-3755
Any correspondence concerning this service should be sent to the repository
administrator:
[email protected]
Near-field deformation of a liquid interface by atomic force microscopy
C. Mortagne,1,2V. Chireux,1R. Ledesma-Alonso,3M. Ogier,1F. Risso,1T. Ondarçuhu,2D. Legendre,1and Ph. Tordjeman1,*
1IMFT - Université de Toulouse, CNRS-INPT-UPS, UMR 5502, 1 allée du Professeur Camille Soula, 31400 Toulouse, France 2Nanosciences Group, CEMES-CNRS, UPR 8011, 29 rue Jeanne Marvig, 31055 Toulouse cedex 4, France
3CONACYT -Universidad de Quitana Roo, Boulevar Bahía s/n,Chetumal, 77019, Quitana Roo, México
(Received 3 April 2017; published 5 July 2017)
We experiment the interaction between a liquid puddle and a spherical probe by Atomic Force Microscopy (AFM) for a probe radius R ranging from 10 nm to 30 µm. We have developed a new experimental setup by coupling an AFM with a high-speed camera and an inverted optical microscope. Interaction force-distance curves (in contact mode) and frequency shift–distance curves (in frequency modulation mode) are measured for different bulk model liquids for which the probe-liquid Hamaker constant Hplis known. The experimental
results, analyzed in the frame of the theoretical model developed inPhys. Rev. Lett. 108,106104(2012) andPhys. Rev. E 85,061602(2012), allow to determine the “jump-to-contact” critical distance dminbelow which the liquid
jumps and wets the probe. Comparison between theory and experiments shows that the probe-liquid interaction at nanoscale is controlled by the liquid interface deformation. This work shows a very good agreement between the theoretical model and the experiments and paves the way to experimental studies of liquids at the nanoscale. DOI:10.1103/PhysRevE.96.012802
I. INTRODUCTION
When a liquid encounters a solid or another liquid, it undergoes a jump-to-contact instability due to van der Waals (vdW) interactions between the two media. This phenomenon is crucial in coalescence of drops and in many situations where liquids are projected on solid surfaces. The jump-to-contact instability occurs at the nanoscale and results of the local liquid deformation. It is characterized by a threshold distance dmin below which the liquid wets the solid surface or forms
an irreversible capillary bridge with a second liquid. To exper-iment the jump-to-contact instability, a nanoscale technique is necessary to probe the near field interaction force and to determine the dmin length. While Atomic Force Microscopy
(AFM) has been developed to perform experiments in air [1] with unprecedented resolution for the characterization of solids, the study of liquids with AFM is still not often addressed in the literature [2–4] and provides new advances in particular in biophysics [5,6] and wetting [7,8].
Evaporation-condensation, electrical charges at the liquid surface, and liquid spreading during experiments may restrict the use of AFM. In particular, the study of liquids with low viscosity is challenging because the tip undergoes the liquid attraction and the jump-to-contact instability is uncontrolled. To study the near field interaction between a liquid and a probe with a nanoscale resolution, a new experimental setup must be developed to achieve AFM experiments. The AFM can be operated in two modes, the contact mode and the intermittent mode [9,10]. In the first one, the cantilever deflection is measured when the probe approaches the sample. After calibration, the probe-sample interaction force can be plotted versus the displacement. In the intermittent mode, two typical experiments called Amplitude Modulation-AFM (AM-AFM) and Frequency Modulation-AFM (FM-AFM) can be conducted: in the first experiments, the cantilever is vibrated close to the resonance frequency and the amplitude is measured versus the probe-sample displacement; in the second, the
cantilever oscillates at a fixed resonance amplitude and the shift resonance frequency is measured versus the probe-sample displacement. A Phase Lock Loop (PLL) is used to maintain the oscillation phase of the cantilever at the resonance when the probe approaches the sample, the probe-sample interaction force being responsible of a decreasing of the resonance frequency. In all modes, the analysis of the results requires a theoretical model, in particular to determine the origin of the probe displacement, which is initially unknown.
In this paper, we study experimentally the interaction between a spherical probe and model liquids at the nanoscale. The paper is organized as follows. In Sec.II, we recall the theoretical model that is used to analyze the AFM experiments. In Sec. III, we describe the experimental setup and the procedure to perform AFM measurements in contact and FM modes. In particular, a lateral observation of the probe-liquid system with a high-speed camera was implemented in the AFM for in situ optical observations. The results are presented and analyzed in Sec. IV. Taking into account the liquid deformation, we observe a very good agreement between experiments and numerical simulations. This work shows that the jump-to-contact threshold dmincan thus be determined by
FM-AFM with good accuracy.
II. THEORETICAL MODEL
Recently, we have developed a nano-hydrodynamic model that predicts the surface deformation of a liquid film in inter-action with a nano-probe [11–14]. Liquid and probe interact through non-retarded vdW forces. The model determines the threshold distance dminbetween the undeformed liquid surface
and the bottom surface of a spherical probe, below which the jump-to-contact instability arises. This distance, which is a characteristic of the probe-liquid static interaction, depends mainly on the probe-liquid Hamaker constant Hpl and on the
probe radius R. It is calculated by solving numerically the modified Young-Laplace equation [11,15]
Probe Air R Liquid η z r d
FIG. 1. Schema of the liquid deformation in interaction with a spherical probe. Parameters defined in the text.
where 1P is the pressure difference across the liquid interface, γ is the liquid-air surface tension, κ is the local mean curvature, 5pl is the disjoining pressure associated with the
probe-liquid interaction. The local mean curvature, expressed in axisymmetric cylindrical coordinates, takes the form
κ = − ∂ 2r ∂r µ r∂η ∂r " 1 +µ ∂η ∂r ¶2#−1/2¶ , (2)
where η(r) is the local surface position (Fig.1). The interac-tion potential corresponds to the potential energy difference between the perturbed state and the undisturbed original state. The disjoining pressure 5pl between the spherical probe and
a given point of the liquid surface at z = η is given by 5pl = −
4HplR3
3π
1
[(d + R − η)2+ r2− R2]3. (3)
Here, d is the separation distance between the unperturbed liquid interface and the probe bottom (Fig.1). In this approach, the effects of gravity can be neglected due to the very low value of the Bond number, Bo= R2g1ρ/γ ≃ 10−7–10−12, where
g and 1ρ are the acceleration of gravity and the air/liquid density difference, respectively.
The theoretical value of dminis obtained from the
relation-ship between the probe displacement d and the deformation η0of the liquid interface at r = 0 [12]:
d∗≃ η∗0+ s 1 + µ H a 2C (η∗ 0)3/2 ¶1/3 − 1, (4) where d∗= d/R and η0∗= η0/R, C = 0.4 Bo0.06/ √ Ha, where
Ha= 4Hpl/(3π γ R2) is the normalized Hamaker constant.
At dmin the deformation is maximum and ∂η∗0/∂d∗→ ∞.
In practice, we determine the maximum of η0 by solving
numerically ∂d∗/∂η∗
0= 0, and dmin from Eq. (4) for the
maximum of η0. Typically, for a spherical probe in interaction
with a bulk liquid with a Hamaker constant Hpl ≃ 6 × 10⁻²⁰J,
dmin is found to vary between 2 and 30 nm when R varies
between 1 nm and 30 µm. The theoretical study of the liquid deformation in interaction with an oscillating spherical probe points out that the jump-to-contact instability occurs at a lower distance than dminwhen the oscillation frequency is very large
(of the order of 108 Hz). On the other hand, for typical
frequency of AM-AFM or FM-AFM experiments (between 1 and 500 kHz), the jump-to-contact instability occurs at distance close to dmin[14].
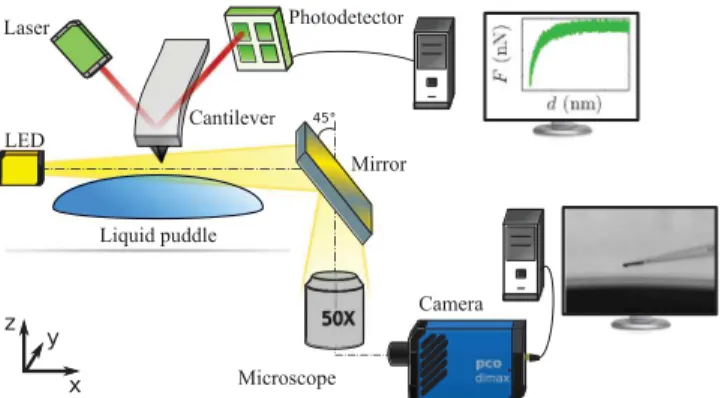
FIG. 2. Schema of the experimental setup: AFM coupled with a high-speed camera and an inverted optical microscope.
III. AFM EXPERIMENTS
We investigate the interaction between spherical probes and model liquids at the nanoscale by means of an AFM. In this study, we consider four different model fluids, which are characterized by a same Hamaker constant Hpl≃ 6 × 10⁻²⁰J
[16,17]: diethylene glycol (2EG), triethylene glycol (3EG), tetraethylene glycol (4EG), and glycerine (Gly). The liquids are purchased from Sigma-Aldrich and are used as received. Their dynamic viscosity and surface tension are µ = 30, 40, 50, and 910 mPa s and γ = 50, 48, 46, and 63 mN/m, respectively. As a consequence, the jump-to-contact instability involves a characteristic velocity γ /µ = 1.7, 1.2, 0.9, and 7 × 10⁻²m/s,
respectively. The time to wet the probe dminµ/γ is close to
8×10⁻⁹ s for 2EG, 3EG and 4EG and 1 × 10⁻⁷ s for Gly.
Puddles of liquids are deposited on a glass slide that is cleaned just before AFM experiments.
A JPK Nanowizard 3 AFM is employed in contact and FM modes to measure the force curves and the frequency shift curves over a liquid puddle (Fig.2). For FM experiments, the PLL device of the signal access module Vortis JPK operates the phase feedback. A specific cantilever holder has been built by JPK to perform experiments with liquids. It consists of a 45◦ gold mirror (NA 0.3) to observe the side view of the
cantilever and a “direct drive” piezo transducer to vibrate the cantilever at a given amplitude and frequency. An inverted optical microscope Nikon Eclipse Ti is placed under the AFM. A 50 × /0.6 long distance objective is employed to visualize the liquid puddle-cantilever system before and during the experimental runs. A high-speed PCO Dimax Camera is coupled to the optical microscope. The camera is mounted with an air gap to prevent vibrations of the AFM. During the AFM experiments, the optical image is focused at the interface between the liquid and the probe. The maximum frame rate of the camera is 1279 fps for image size of 2016 × 2016 pixels. When the size is reduced to 300 × 300 pixels, the camera frame rate can reach 45 000 fps. The lighting is provided via an optical fiber bundle by a LED light source equipped with an infrared filter. The images are calibrated by means of a micron ruler. AFM and camera are synchronized via the signal access module. The coupling between AFM measurements and high-speed camera observations allows to ensure positioning of the probe over the puddle, to assess possible evaporation, and to observe the dynamics of the wetting process of the
FIG. 3. Images of probes recorded by a high-speed camera over a Gly puddle: (a) Nanometric probe (AppNano Hydra); (b) Gly droplet probe; (c) Wetting of a probe (PPP Nanosensors) after jump-to-contact.
cantilever-probe system after the jump-to-contact (Fig.3). We verified from the camera images that no evaporation takes place during the AFM measurements.
Whereas the Hamaker constant of standard liquids belongs to a single decade (10−19J6 Hpl 6 10−20J), the probe radius
R may spread over several decades. R is therefore the main parameter that controls the amplitude of the probe-liquid interaction forces and thus that determines the range of interaction. In this study, we use different cantilevers with different tip radii, which varies over five decades, from 10−9to
10−4m. The tip radii are measured by SEM observations, after
the usual cantilever calibration procedure carried out before each AFM measurement. To obtain probes with a radius larger than 1 µm, we have developed a method to deposit a small drop at the cantilever extremity. The droplet is maintained by the wetting force between the liquid and the cantilever, and its size depends on the liquid volume that has been transferred to the cantilever. The droplet is small enough to remain spherical by surface tension, so that it can be considered as a rigid spherical probe. The probe radius is measured on microscopy camera images just before each AFM experiment. It has been checked that the values of R measured by optical microscopy are closed to those calculated with the resonance frequency shift resulting of the additional mass induced by the liquid at the extremity of the cantilever.
For contact mode experiments, two different cantilevers are used: (1) Hydra 6V-200WG AppNano with a k = 0.12 N/m and a radius R ≃ 25 nm; (2) colloïdal PT-SiO2.Si.1 Novas-can with k = 0.58 N/m and R ≃ 450 nm. For FM-AFM experiments, three different cantilevers are used: (1) PPP-NCHAuD Nanosensors with k = 31 N/m and R = 12 nm; (2) the same model with k = 31 N/m and R = 45 nm; (3) PT-SiO2.Si.1 Novascan with k = 19.5 N/m and R = 450 nm. The cantilever stiffnesses are characterized by thermal noise using the deflection sensitivity derived from contact mode experiments on a silicon wafer substrate [18]. Note that the stiffness of all the present cantilevers is at least four times larger than the effective spring constant of the interface, which is of the order of γ /2 [19]. Therefore, the jump-to-contact is not a consequence of a mechanical instability of the cantilever, but is the result of an hydrodynamic instability of the liquid interface. This is confirmed by the inspection of the video records. In contact and FM-AFM modes the force F and the frequency shift 1f are plotted versus the probe-liquid distance d. The latter is calculated by the difference between the piezo elevation z and the cantilever deflection.
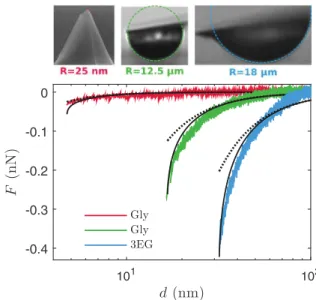
d(nm) 101 102 F (n N ) -0.4 -0.3 -0.2 -0.1 0 Gly Gly 3EG
FIG. 4. Probe-liquid interaction force vs probe displacement. The experimental curves (solid colored lines) are fitted with Eq. (6) (solid black lines) and Eq. (7) (dotted lines).
More than 100 experimental runs have been performed. However, a quantitative assessment of the reproducibility of the experiments was not possible since the probe-liquid system is modified after each AFM experiment due to the irreversible wetting of the probe. Nevertheless, it has been checked that experiments realized with probes having similar characteristics yielded to similar results. All the AFM experiments are realized in a gray room maintained at a constant temperature of 23 ± 1◦C.
Figure3displays three images of cantilevers in interaction with a Gly puddle, before and after the jump-to-contact instability. In Fig.3(a), the probe consists of the tip of a Hydra cantilever whereas, Fig.3(b)shows a probe that consists of a small Gly droplet attached to the tip. With the present lighting conditions, interference fringes are observed at the puddle surface. For instance, Fig.3(c)displays an image extracted from a high-speed movie during the wetting of a PPP tip. In Figs.4and6, equivalent spheres estimated by SEM and optical microscopy (dashed lines) are superimposed onto images of some probes.
IV. RESULTS AND DISCUSSION A. Experiments in contact mode
In a first set of experiments, we carried out force-displacement curves in contact mode. As an example, three typical curves are shown in Fig. 4 for R ≃ 25 nm,
12 µm, and 18 µm with Gly and 3EG. The probe velocity is 100 nm/s−1. For a nanometer-sized probe, the results point
out that the probe-liquid interaction is characterized by small magnitude and a short range. The maximum force, which is obtained for d ≃ dmin, is of the order of 5 × 10⁻¹¹ N, close
to the limit of detection of the AFM. For a micrometer-sized probe, a much larger maximum force is measured, in between 2 to 4 × 10⁻¹⁰N.
Following the approach of [20], the experimental curves can be fitted with the vdW force FvdWbetween a deformable
FIG. 5. Theoretical probe-liquid interaction force vs probe dis-placement calculated with Eq. (5) (solid lines), Eq. (6) (dashed line), and Eq. (7) (dotted lines) for four different probe radii.
liquid interface and a sphere of radius R: FvdW= 8 HplR3 3 Z ∞ 0 r dr ([d + R − η(r)]2 + r2 − R2)3. (5)
The force takes into account the interface deformation η(r), which can be calculated numerically from the model recalled in Sec.II. Considering that most of the interaction force comes from the region around r = 0, we can assume that
FvdW≃
4HplR3
6[d − η0(d)]2[d − η0(d) + 2R]2
, (6)
where η0(d) is calculated from Eq. (4). Figure 5 compares
the exact expression of FvdW[Eq. (5)] with its approximate
expression [Eq. (6)] for four different probe radii.
It is clear that the force mainly depends upon the maximum liquid deformation at r = 0 and that it is therefore relevant to fit the experimental results by Eq. (6) in order to determine the value of R. However, even though Eq. (6) predicts the correct shape of the interaction force, it underestimates the value of the maximum force compared to the result obtained with the exact expression of FvdW.
Figure5also compares Eq. (5) to the vdW force calculated by neglecting the surface deformation,
FvdW′ ≃ 4HplR
3
6d2(d + 2R)2. (7)
These results show that the interface deformation plays a crucial role in the probe-liquid interaction and hence cannot be neglected. The magnitude of the exact interaction force FvdWindeed becomes significantly larger than FvdW′ when the
probe-liquid distance approaches dmin.
The experimental curves are fitted by adjusting the sphere radius R which minimizes the standard deviation between the experimental curves and Eq. (6). Then, the value of dmin is
calculated from Eq. (4), which allows to determine the origin of the probe displacement. We observe that dminincreases by
more than one order of magnitude when the radius increases from 25 nm to 16 µm. For all experiments, the Hamaker constant is fixed to Hpl = 6 × 10⁻²⁰J, which is a reasonable
value for the present probes and liquids. Using the model of Israelachvili of composition of Hamaker constants [17], we checked that Hpl is indeed in between 5 × 10⁻²⁰ J and
1 × 10⁻¹⁹J whatever the probe composition [21].
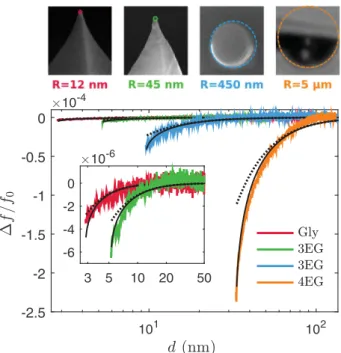
FIG. 6. Normalized frequency shift 1f/f0vs probe displacement
d. The experimental curves (solid colored lines) are fitted with Eq. (8) combined with Eq. (6) (solid black lines) and Eq. (7) (dotted lines).
The fits obtained in Fig. 4 give R ≃ 55 nm, 3 µm, and
22 µm compared to R ≃ 25 nm, 12 µm, and 18 µm measured by SEM and optical microscopy. We observe a satisfactory agreement between the experimental curves and the model Eq. (6). In Fig. 4, FvdW′ is also plotted for the same fitted radii. The comparison with the experimental results shows clearly that the interface deformation has to be taken into account, which is consistent with the conclusions drawn from Fig. 5. The discrepancy between the values of R fitted by means of the theory and those measured by microscopy is mainly due to the fact that the value of Hpl is not known
with a sufficient accuracy. Also, the values of R measured by microscopy have been obtained by assuming that the probe is spherical. This assumption does not take into account the real tip and cantilever geometries. Moreover, for large values of R, the droplets may slightly deform during the experiments, which can induce a change in the probe curvature.
B. Experiments in FM mode
In a second time, FM-AFM experiments are performed with 2EG, 3EG, 4EG, and Gly. Figure6 presents selected shift-frequency curves obtained with R ≃ 12 nm, 45 nm, 450 nm, and 12 µm. This mode is able to make a clear distinction between the probe-liquid interactions for R ≃ 12 nm and R ≃ 45 nm. In contrast with contact mode, FM-AFM is accurate enough to characterize the interaction for R < 100 nm. This is made possible thanks to the PPL control and to the great sensitivity of the frequency shift to the probe-liquid distance, which is related to the force gradient. In this mode, dmin is
detected when the phase of the cantilever oscillations and the gain of the AFM actuator both diverge. As in contact mode, the value of R is obtained by fitting the experimental curves with a theoretical model by the least square method.
101 102 10-5
-10 -5 0
FIG. 7. Theoretical normalized frequency shift vs probe displace-ment, calculated with Eq. (8) combined with Eqs. (6) (solid line) and (7) (dotted lines) for five different probe radii.
Following the approach of Giessibl [22] and Hölscher [23] for FM-AFM experiments on solid surfaces, the theoretical expression of 1f is given by 1f f0 = − 1 2π kA Z 2π 0 FvdW(x) cos(x) dx, (8)
where f0 is the cantilever eigenfrequency and A is the
oscillation amplitude. In this relationship, 1f is a function of the liquid deformation η0(d). Now, d is the minimum distance
between the probe and the undeformed liquid surface that is reached during an oscillation, and d + A is the mean position of the cantilever. Here, dminis calculated by means of Eq. (4)
from the fitted value of R. The fitting curves are presented in Fig.6. The fitted values are R ≃ 12 nm, 66 nm, 470 nm,
and 27 µm compared to R ≃ 12 nm, 45 nm, 450 nm, and 12 µm measured by microscopy. The corresponding values of dmin, calculated by numerical simulations, are dmin= 2.8 nm,
5.3 nm, 9.6 nm, and 33.1 nm, respectively.
In the limit of accuracy of the method, we observe a remarkable agreement between the experiments and the model that takes into account the maximal deformation of the liquid interface [Eqs. (6) and (8)]. The results obtained in the FM-AFM mode confirm that the liquid deformation plays a crucial role, especially when the distance of the oscillating probe approaches dmin.
C. Liquid deformation for R . 1 µm
Figure7compares the theoretical frequency shift obtained by accounting for the liquid deformation [Eqs. (6) and (8)] and without accounting for the liquid deformation [Eqs. (7) and (8)] for R ranging from 10−9m to 10−5m. It turns out that
the deformation plays a significant role only for R larger than 1 µm.
Neglecting the deformation and assuming d. R, an ex-plicit analytic expression of the frequency shift can be derived from Eqs. (7) and (8),
1f f0 kA3 HplR = − 1 6 [(d/A + 1)2− 1]3/2. (9)
Hence, for R. 1 µm, the normalized experimental frequency shifts of all systems should gather on a master curve according
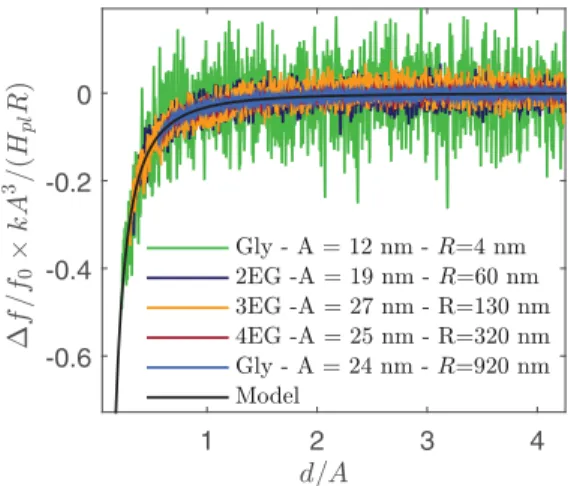
-0.6 -0.4 -0.2 0
FIG. 8. Master curve of the normalized frequency shift as a function of the normalized displacement for five experimental conditions. R and dminare obtained by fitting the experimental results
with Eq. (9)
to Eq. (9). Figure8presents the evolution of the experimental normalized frequency,1ff
0
kA3
HplR, as a function of the normalized
distance, d/A, for five different systems with R ranging from 4 to 920 nm and A ranging from 12 to 27 nm. The master curve of Fig.8confirms that the liquid deformation can be neglected in FM mode for R < 1 µm. Note that the apparent noise in the master curve comes from the normalization in A3/R, which
exacerbates the experimental noise for small radii.
Finally, we consider the relationship between dminand R.
We have carried out more than 100 experiments in FM-AFM with all the liquids. As we dispose of a limited number of cantilevers, we developed a protocol to change the probe radius by successive wetting of AFM tips. In this way, we produced probes with radii ranging from 10−9 to 10−5 m. R and dmin
are determined by fitting the experimental curves with Eq. (9). Note that dmin and R are two parameters that are adjusted
when fitting by Eq. (9), dminis thus not derived from R by using
Eq. (4). It is worth mentioning that the liquid deformation is not taken into account since most of the experiments are performed with probes with radii smaller than 1 µm. This approximation is strengthened by the results presented in Fig.9.
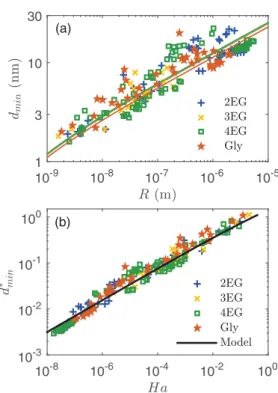
The symbols in Fig.9(a)show the experimental evolution of dmin over four decades of R for the four studied liquids.
It turns out that the jump-to-contact instability occurs at a distance of the order of R for R ∼ 10−9m, but at a distance a
thousand times smaller than R when R is of the order of one micrometer. The theoretical predictions derived from Eq. (4) are represented by plain lines. The agreement between the measurements and the theory is satisfactory if we consider that a single approximate value of the Hamaker constant has been used for all the liquids, which however have different surface tensions. The log-log representation puts into light a simple scaling, dmin∼ R1/3, which can be understood by assuming
that the mechanical instability occurs when the gradient of the interaction force HplR/d3exceeds the interface stiffness γ /2.
Figure 9(b)presents the same results in an adimensional form, d∗
minvs Ha. Thanks to the normalization, the
experimen-tal values of d∗
min, obtained for a range of Hathat covers height
10-8 10-6 10-4 10-2 100 10-3 10-2 10-1 100 10-9 10-8 10-7 10-6 10-5 1 3 10 30 (a) (b)
FIG. 9. Experimental and theoretical jump-to-contact threshold distance. (a) dmin vs probe radius R. The colored lines correspond
to the model calculated for the different liquids (see Sec. II). (b) Non-dimensional distance d∗
minvs normalized Hamaker constant Ha.
The data follow the empirical relation d∗
min≃ 1.53 × H 1/3 a .
predicted by the model. From a practical point of view, the value of dminfor any liquids and sphere radii can be estimated
with an error smaller than 7% by the following empirical correlation: d∗
min≃ 1.53 × H 1/3
a .
V. CONCLUSION
In this work, we have investigated the interaction between a spherical probe and a liquid puddle composed of several model
liquids by means of AFM for probe radii spreading over five decades. The development of a new experimental AFM setup enables the study of the interaction between a liquid and a probe at nanoscale. The coupling between AFM measurements and side-view observations with a high-speed camera permits the positioning of the probe over the puddle, the measurement of the probe radius just before AFM experiments, and the description of the wetting dynamics of the cantilever-probe system after the jump-to-contact. Moreover, monitoring with a fast camera allows to check whether the probe radius is affected by evaporation just before AFM experiments.
We found that the van der Waals interaction can be probed by FM-AFM experiments with a good accuracy. In particular, our technique allows to measure the jump-to-contact threshold distance dmin. We found a remarkable agreement between the
present experimental results and the theory that describes the interface deformation by a balance between vdW, capillary forces and gravity. We also showed that the liquid deformation has to be taken into account for large probe radii but can be neglected for R. 1 µm. FM-AFM experiments allow to quantify the range of interaction between a liquid and a solid or between two liquids, and yield a simultaneous and independent determination of Hpland R.
In the continuation of this work, AFM can be used to characterize liquids properties and to study the liquid dynamics at the nanoscale. This requires to conduct AFM experiments in non-contact mode at distance larger than dmin. Surface
migration of surfactants, topography of nanostructured liquids, nucleation and growth of instabilities, nucleation of vortex structures, and surface charge distribution of conducting liquids are example of phenomena that could be investigated.
ACKNOWLEDGMENTS
The authors thank the JPK Company which has accepted to develop a new cantilever holder with a lateral side view mirror for FM-AFM experiments. The authors also thank S. Cazin and M. Marchal for their implication in the setup development. This study has been partially supported through the ANR by the NANOFLUIDYN project (grant no. ANR-13-BS10-0009).
[1] G. Binnig, C. F. Quate, and C. Gerber,Phys. Rev. Lett. 56,930
(1986).
[2] A. Checco, H. Schollmeyer, J. Daillant, P. Guenoun, and R. Boukherroub,Langmuir 22,116(2006).
[3] A. Checco, Y. Cai, O. Gang, and B. M. Ocko,Ultramicroscopy
106,703(2006).
[4] T. Ondarçuhu and J.-P. Aimé, Nanoscale Liquid Interfaces: Wetting, Patterning and Force Microscopy at the Molecular Scale(Pan Stanford Publishing, Singapore, 2013).
[5] E. Canetta, A. Duperray, A. Leyrat, and C. Verdier, Biorheology
42, 321 (2005).
[6] O. Chaudhuri, S. H. Parekh, W. A. Lam, and D. A. Fletcher,
Nature Methods 6,383(2009).
[7] T. Pompe and S. Herminghaus, Phys. Rev. Lett. 85, 1930
(2000).
[8] J. Becker, G. Grün, R. Seemann, H. Mantz, K. Jacobs, K. R. Mecke, and R. Blossey,Nat. Mater. 2,59(2003).
[9] F. J. Giessibl,Rev. Mod. Phys. 75,949(2003). [10] R. Garcıa and R. Perez,Surf. Sci. Rep. 47,197(2002). [11] R. Ledesma-Alonso, D. Legendre, and P. Tordjeman,Phys. Rev.
Lett. 108,106104(2012).
[12] R. Ledesma-Alonso, P. Tordjeman, and D. Legendre,Phys. Rev. E 85,061602(2012).
[13] R. Ledesma-Alonso, D. Legendre, and P. Tordjeman,Langmuir
29,7749(2013).
[14] R. Ledesma-Alonso, P. Tordjeman, and D. Legendre,Soft Matter
10,7736(2014).
[15] D. B. Quinn, J. Feng, and H. A. Stone,Langmuir 29, 1427
(2013).
[17] J. N. Israelachvili, Intermolecular and Surface Forces (Aca-demic Press, New York, 2011).
[18] N. Burnham, X. Chen, C. Hodges, G. Matei, E. Thoreson, C. Roberts, M. Davies, and S. Tendler, Nanotechnology 14,
1(2002).
[19] J. Dupre de Baubigny, M. Benzaquen, L. Fabié, M. Delmas, J.-P. Aimé, M. Legros, and T. Ondarçuhu,Langmuir 31,9790
(2015).
[20] H. Hamaker,Physica 4,1058(1937).
[21] Note, according to Israelachvili [17], the Hamaker constant H132
of media 1 and media 2 interacting across medium 3 reads
H132∼ ( √ H1− √ H3)( √ H2− √
H3) where Hiis the Hamaker
constant of the media i. Considering that the Hamaker constant of air can be neglected compared to the Hamaker constants of the probe Hp, and the liquid Hl, Hpl is simply given by
Hpl=pHpHl. In this study we take Hp= 1.9 × 10⁻¹⁹J for Si
probes (Hydra and PPP), Hp= 6.5 × 10⁻²⁰J for SiO2probes
(Novascan) and Hlis comprised between 5 and 7 × 10⁻²⁰J for
liquids.
[22] F. J. Giessibl,Phys. Rev. B 56,16010(1997).
[23] H. Hölscher, U. Schwarz, and R. Wiesendanger,Appl. Surf. Sci.