Publisher’s version / Version de l'éditeur:
Proceedings of Combustion Institute - Canadian Section Spring Technical
Meeting 2009, 2009-05
READ THESE TERMS AND CONDITIONS CAREFULLY BEFORE USING THIS WEBSITE.
https://nrc-publications.canada.ca/eng/copyright
Vous avez des questions? Nous pouvons vous aider. Pour communiquer directement avec un auteur, consultez la
première page de la revue dans laquelle son article a été publié afin de trouver ses coordonnées. Si vous n’arrivez pas à les repérer, communiquez avec nous à [email protected].
Questions? Contact the NRC Publications Archive team at
[email protected]. If you wish to email the authors directly, please see the first page of the publication for their contact information.
NRC Publications Archive
Archives des publications du CNRC
This publication could be one of several versions: author’s original, accepted manuscript or the publisher’s version. / La version de cette publication peut être l’une des suivantes : la version prépublication de l’auteur, la version acceptée du manuscrit ou la version de l’éditeur.
Access and use of this website and the material on it are subject to the Terms and Conditions set forth at
Investigation of soot aggregate size distributions by multi-angle elastic
light scattering
Link, Oliver; Tulloch, Brandon; Snelling, David R.
https://publications-cnrc.canada.ca/fra/droits
L’accès à ce site Web et l’utilisation de son contenu sont assujettis aux conditions présentées dans le site LISEZ CES CONDITIONS ATTENTIVEMENT AVANT D’UTILISER CE SITE WEB.
NRC Publications Record / Notice d'Archives des publications de CNRC:
https://nrc-publications.canada.ca/eng/view/object/?id=c97e56b4-b302-4925-90a3-2806eb1ebe1b https://publications-cnrc.canada.ca/fra/voir/objet/?id=c97e56b4-b302-4925-90a3-2806eb1ebe1b
_____________________________________________ Proceedings of Combustion Institute – Canadian Section Spring Technical Meeting Université de Montréal, Québec May 11-13, 2009
Investigation of Soot Aggregate Size Distributions
by Multi-Angle Elastic Light Scattering
Oliver Link
*, Brandon Tulloch, David R. Snelling
National Research Council of Canada, ICPET, Building M-9, 1200 Montreal Road, Ottawa, ON K1A 0R6, Canada
1. Introduction
It is well-known that soot primary particles in engines and flames have the tendency to form soot aggregates during the combustion process1, 2. It has been identified that such aggregates cause health problems and play a significant role in global warming. Smaller particulates, which can penetrate into the lungs, are particularly suspect and therefore a characterization of the exhaust particles of combustion processes is of great interest and can help to identify and improve current sooting sources. The primary particles are composed largely of carbon with smaller amounts of hydrogen and oxygen and are spherical with diameters of 15-50 nm. The aggregates, which consist of random clusters of primary particles, can grow as large as micrometers. However, in flames typical aggregate sizes are of the order of several tens to several hundreds of nanometers. These random aggregates can be characterised as fractal structures with a mass-fractal-like structure that can be characterized by the fractal dimension Df and a prefactor kf according
to the statistical scaling law
(1) where N and Rg denote the number of primary particles per aggregate and the radius of gyration of the
aggregate, respectively. a represents the radius of the primary particle which can be considered to be spherical as has been verified by transmission electron microscopy (TEM) experiments3, 4. The radius of gyration is defined as
(2)
where ri is the distance of the ith primary particle to the aggregate`s center of mass. The soot aggregates
have a loose and branching structure which is well reflected by typical fractal dimensions of 1.6 to 1.9 (a fractal dimension of 3 describes a dense sphere-like structure whereas a dimension of 1 represents a linear chain5).
A variety of methods have been applied to the exhaust gases of combustion processes to investigate their soot emissions4, 6-9. While some of the methods can produce images of the soot particles like transmission electron microscopy (TEM) and scanning electron microscopy (SEM) they are time-consuming and not suitable to perform real-time monitoring. Furthermore, the data evaluation of TEM images exhibit some difficulties such as very broad aggregate size distributions, which were not consistent with results from other techniques (in particular scattering measurements)10. Spectroscopic techniques promise to be the most flexible and less intrusive methods, as solely light irradiates the exhaust gases and the transmitted or emitted radiation from the sample is collected in order to evaluate the light-matter interaction.
*
2. Scattering Theory
The angular intensity distribution of scattered light depends strongly on the size of the scatterer compared to the wavelength of the light. A spherical particle that is significantly smaller than the wavelength shows an isotropic scattering distribution (Rayleigh-Scattering) whereas larger particles exhibit an anisotropic scattering with high intensity in the forward direction and decreasing intensity for larger scattering angles (Mie-Scattering), in the plane perpendicular to the light polarization. To quantify the relationship between the particle`s diameter dp and the wavelength λ the size parameter xp is introduced
. (3)
If the particle has a size parameter of (usually xp < 0.3 is applied), it is considered to be in the
Rayleigh limit. For the common wavelength 532 nm the maximal particle diameter to fulfill the Rayleigh conditions is 51 nm, which reveals that the particle might be about as large as a tenth of the wavelength. As fractals have a strongly non-spherical shape they may not be treated with the traditional Mie theory which gives accurate results for spherical particles but fails for the loose and branching soot aggregates. Rigorous solutions for the scattering from such complex structures as soot aggregates exists as the T-Matrix5 or the generalized multi-sphere Mie method (GMM)11, 12, which is particularly adapted to aggregates assembled by spherical primary particles. Unfortunately, these rigorous approaches are very demanding in terms of computation power and time and are therefore not adequate for a real-time evaluation of scattering data, as it is desirable for a practical diagnostics tool.
An alternative approach is the Rayleigh-Debye-Gans fractal aggregate (RDG-FA) approximation, which has proven to give reasonable results for the scattering on soot aggregates within certain limitations13. Several studies were devoted to the investigation of the validity and applicability of the RDG approximation14-17, where the scattering from simulated aggregates according to RDG and to other (more accurate) theories was compared against each other. The general finding is that for moderate aggregate sizes (up to several hundred primary particles) and sufficiently small primary particles (xp < 0.3) the error
of RDG with respect to rigorous theories is less than 10%.
According to the RDG approximation the intensity of light scattered into a certain direction is given by
Ω (4)
where I0 denotes the incident light intensity, n expresses the aggregate number density, and is the
scattering cross section of the aggregate. q is the scattering wave vector
sin / . (5)
The cross section of the aggregate can be expressed in terms of the cross section of the primary particles 13 which results in
, (6)
where N is the number of primary particles per aggregate, k is the light wave vector, m = n + ki is the complex refractive index, a is the radius of the primary particle, F(m) = |(m2-1)/(m2+2)|2, is a function representing the scattering propensity of the material in terms of its complex refractive index, and S(q,N) is the structure factor. A good overview about how the structure factor can be deduced from the fractal aggregate shape and a summary of different structure factors from literature can be found in the thorough review by Sorensen 13 who has derived a rigorous form of the structure factor based on the Fourier transform of the density autocorrelation function assuming a Gaussian cut-off for the fractal size. This expression has proven to be in good agreement with the angular scattering intensity from fractal aggregates
, exp , , . (7)
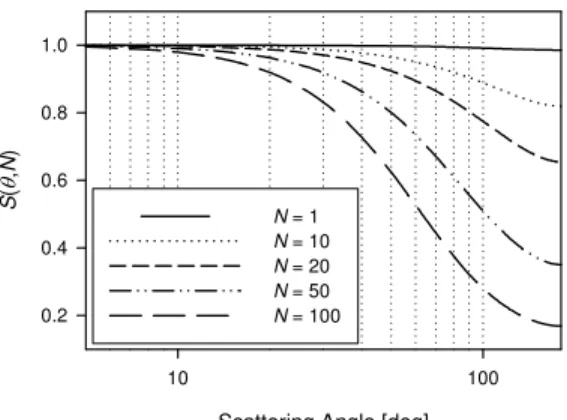
where 1F1 is the hypergeometric function. In Fig. 1 structure factors based on Eq. (7) for several randomly
chosen single aggregate sizes are depicted. The graph shows nicely that a single primary particle (N = 1) behaves like a Rayleigh scatterer (essentially constant value over all angles) whereas for increasing
aggregate size a pronounced anisotropy with an increasing forward to backward ratio occurs. Fig. 1 suggests also that a particular aggregate size corresponds to a characteristic forward-to-backward ratio and that by measuring this ratio the size of the scatterer can be determined. The situation is somewhat more complex if a polydisperse distribution has to be considered, as is the case for combustion generated soot aggregates. The angular scattering expression now has to be integrated over the aggregate size distribution. For a lognormal distribution of aggregates the scattering is given by
, , , , (8)
with the distribution parameters Ng and σ2g for a lognormal distribution of the form
, , √ exp √ . (9)
Note that this extension is considering the aggregates` polydispersity but still assuming a single size for the primary particle. This expression can be evaluated numerically and fitted to the experimental scattering data. Fig. 2 shows three calculated scattering intensity curves according to the RDG theory for different lognormal size distributions. If they are considered as three fits to an imaginary scattering dataset from 20 to 160 deg then it is evident that the three distributions are hardly distinguishable in their scattering pattern. Only for angles less than 20 deg do they differ significantly suggesting that care must be taken in choosing the experimental angular detection range and that the near forward angles are critical in distinguishing between alternate fits.
Fig. 1. Structure factors versus scattering angle for different single aggregate sizes according to the RDG theory. The fractal parameters are Df = 1.78 and kf = 2.3.
Fig. 2. Calculated scattering intensity versus scattering angle according to the RDG theory for three different lognormal aggregate size distributions.
3. Experimental Setup
The key components of the experiment are the laser with subsequent light shaping optics, the soot generating device, and a rotatable detector connected to the data acquisition system as they are shown in Fig. 3. The laser is a diode pumped Q-switched Nd:YLF laser (CrystaLaser, QC527-800
)
with a wavelength of 527 nm and an average power of 400 mW at 10 kHz. The laser beam is expanded to 3 mm diameter and it then propagates through the combination of a wave plate and polarizer which is used to tune the laser energy. A second wave plate is introduced to control the final polarization, which is vertical. A final lens (focal length 50 cm) slightly focuses the laser beam to a diameter of 150 µm. The detected solid angle of radiation is determined by the first detection aperture of 10 mm diameter mounted a distance of 14 cm from the center point of rotation. The aperture is followed by a band-pass filter for 527 nm, a pair of optically conjugate lenses which focus the probe volume onto a final aperture of 200 µm to 2 mm diameter. The final aperture determines the field-of-view of the object plane which corresponds almost to the aperture diameter since the lenses are setup for 1:1 imaging. The detection optics and the detector are mounted to a rotation stage (Newport, ESP300) which allows scattering measurements at angles from 10 - 170 deg.Scattering Angle [deg]
10 100 S ( θ ,N ) 0.2 0.4 0.6 0.8 1.0 N = 1 N = 10 N = 20 N = 50 N = 100
Scattering Angle [deg]
10 100 Inten s ity [a.u.] 0 2e+16 4e+16 6e+16 8e+16 1e+17 Ng = 50, σ2g = 4.4 Ng = 100, σ2g = 3.3 Ng = 150, σ2g = 2.6
The soot sources investigated are a laminar diffusion flame (Gülder Burner)18 and an the exhaust of an inverted flame which was implemented in collaboration with Carleton University, Ottawa19. The diffusion flame was operated with ethylene at 194 sccm and co-flow air at 284 slpm. The inverted flame was operated with methane and air at two different conditions, namely C3 (1200 sccm methane, 15 slpm air) and B1 (1400 sccm methane, 13 slpm) 10.
A challenge of multi-angle measurements with a rotating detector is the changing sample volume with rotation since the sample volume is given by the intersection volume of the laser beam and the detection cone. If the soot sample is sufficiently large and homogenous, the effective sample volume can be well approximated by a geometric correction factor of 1/sin(θ). However, if the soot sample is confined to a smaller dimension, this confinement might limit the sample volume for shallow scattering angles and make its exact determination and therefore the subsequent scaling complicated. This is not critical for the inverted burner with an exhaust pipe of 5 cm and a sufficiently homogeneous soot concentration. However, for measurements in the diffusion flame and scattering angles as small as 10 deg the scaling based on 1/sin(θ) fails unless the aperture in front of the detector is reduced to 0.2 mm.
Fig. 3. Experimental Setup of the multi-angle scattering experiment: L Laser, T Telescope, W Waveplate, P Polarizer, FL Focusing lens, SS Soot Source, D (rotatable) Detector, BD Beam Dump.
4. Results
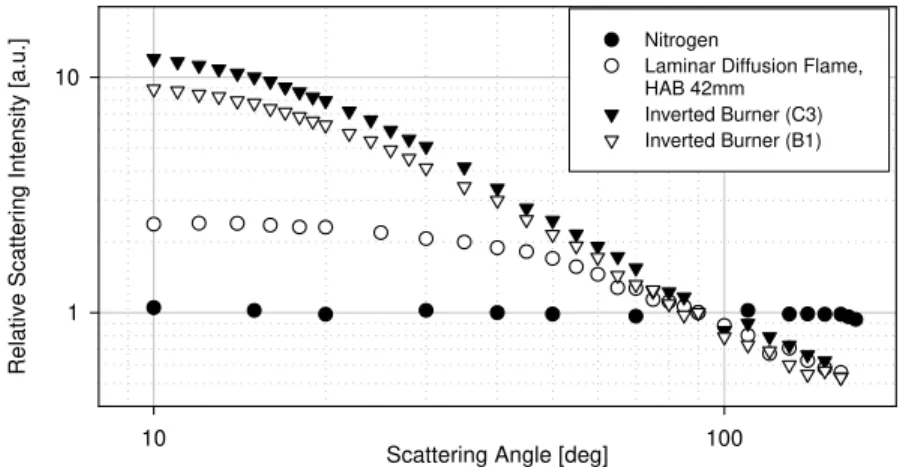
Fig. 4 shows several multi-angle scattering measurements from different samples. All data where calibrated with a volume factor of 1/sin(θ) which corrects for the changing sample volume with rotation. The applicability of this scaling procedure was verified in a reference measurement in nitrogen, which revealed a constant scattering intensity with angle reflecting the expected isotropic Rayleigh-scattering signal. In contrast the scattering from soot samples shows a pronounced increase in the forward-to-backward ratio, a clear indicator for the increasing size of the scatterers (compare Fig. 1). At first glance one can identify that the average aggregate sizes in the laminar diffusion flame (HAB 42 mm) are significantly smaller than the average aggregate sizes in the exhaust from the inverted burner.
The soot scattering versus angle was compared to RDG predictions using Eq. 8. A lognormal distribution was assumed, Eq. 9, and the fractal parameters were chosen to be Df = 1.75 and kf = 2.3 in accordance with
literature20. As primary particle diameters a value of 29 nm for the laminar diffusion flame21 and of 33 nm for condition C3 and of 43 nm for the condition B1 of the inverted burner10 were used. For different widths
Fig. 4. The Multi-angle angle scattering signals over an angular range from 10 to 160 deg for nitrogen, for the laminar diffusion flame at the standard condition HAB 42 mm, and for the inverted burner at
two different conditions. All data were normalized to a relative scattering intensity of 1 at 90 deg.
Scattering Angle [deg]
10 100 Relative Sca tterin g Inte nsity [a. u .] 1 10 Nitrogen
Laminar Diffusion Flame, HAB 42mm
Inverted Burner (C3) Inverted Burner (B1)
σ2g of the distribution the RDG scattering intensities were calculated with a variable mean of the
distribution Ng and a variable scaling factor until the best agreement with the experimental data was
achieved (which is expressed as the minimal residuals R(Ng,σ2g) for
, ∑ , , ).
Fig. 5. The residuals for fits of the multi-angle scattering signal of the inverted burner (C3) to a dataset from 10 - 160 deg. A significant minimum of the residuals can be determined around σ2g = 2.3.
Fig. 6. The residuals as in Fig. 4 but from RDG-fits to a dataset comprising angles from 20 – 160 deg. The residuals are smaller compared to Fig. 4, but they do not show a distinct minimum.
Fig. 5 und 6 show the residual fit errors for a range of distribution widths and geometric mean values. Fig. 5 is based on the evaluation of a scattering dataset over an angular range from 10 – 160 deg, whereas for Fig. 6 only data from 20 – 160 deg were considered. A clear minimum is observed for distribution widths around 2.3 for Fig. 5 whereas in Fig. 6 a flat and insignificant behaviour of the residuals makes the determination of σ2g impossible. This finding is consistent with the prediction of Fig. 2 where an ambiguity
of scattering intensities from 20 – 160 deg for certain aggregate sizes was predicted.
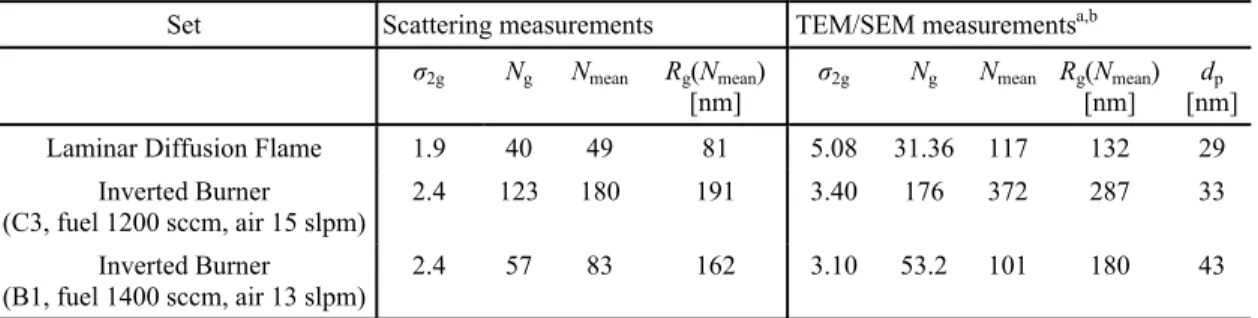
Similar evaluations were carried out for the other datasets represented in Fig. 4 and the determined distribution parameters are summarized in Tab. 1. The soot aggregates in the laminar diffusion flame have an average radius of gyration of 81 nm and are significantly smaller than in the inverted burner. They also show a narrower distribution with a width parameter of 1.9. The distributions from the inverted burner show a constant distribution width of 2.4 for the two conditions but different mean values. Interestingly the condition C3 with a lower fuel flow rate but a higher air co-flow rate shows the larger aggregates with an average radius of gyration of 191 nm over 162 nm.
A comparison of the scattering measurements with TEM/SEM measurements reveals narrower size distributions (smaller σ2g-values) and smaller mean values for the scattering, which correspondingly leads
to smaller aggregate radii. This finding is surprising as scattering is known to be biased towards larger particles due to the involvement of higher moments of the size distribution13. Nevertheless, the inter-comparison of the different soot sources and combustion conditions results in the same trend for both the scattering and the electron microscopy measurements, giving the smallest aggregates for the diffusion flame, the second largest for inverted burner at conditions B1, and the largest aggregates for the inverted burner at conditions C3.
Tab. 1. Distribution parameters for lognormal aggregate size distributions from RDG-fits to the experimental multi-angle scattering data in comparison to results from TEM/SEM measurements
Set Scattering measurements TEM/SEM measurementsa,b
σ2g Ng Nmean Rg(Nmean) [nm] σ2g Ng Nmean Rg(Nmean) [nm] dp [nm]
Laminar Diffusion Flame 1.9 40 49 81 5.08 31.36 117 132 29
Inverted Burner (C3, fuel 1200 sccm, air 15 slpm) 2.4 123 180 191 3.40 176 372 287 33 Inverted Burner (B1, fuel 1400 sccm, air 13 slpm) 2.4 57 83 162 3.10 53.2 101 180 43 a
Values for the laminar diffusion flame were taken from TEM results in Ref.22.
b Values for the inverted burner were taken from SEM results in Ref.10. σ2g 1.0 1.5 2.0 2.5 3.0 3.5 4.0 4.5 5.0 R esi du al s R (σ2g ,N g ) 0.0 0.5 1.0 1.5 2.0 2.5 Ng 0 100 200 300 400 Residuals N g σ2g 1.0 1.5 2.0 2.5 3.0 3.5 4.0 4.5 5.0 5.5 Resi du als R (σ 2g ,N g ) 0.0 0.5 1.0 1.5 2.0 2.5 Ng 0 50 100 150 200 250 300 Residuals Ng
4. Conclusions and Outlook
It has been shown that distribution parameters such as the width and the mean value of polydisperse aggregate size distributions of soot aggregates can be deduced from multi-angle scattering measurements, if the RDG approximation is applied and the primary particle size is known. However, a simplified evaluation of a forward-to-backward ratio based on two scattering angles (often values like 30 and 150 deg are used 20) is in general not sufficient to extract the distribution width, as it might not uniquely identify a certain distribution over another one.
The general approach so far assumes a certain shape of the distribution (lognormal), which might be too strong a restriction in terms of the real underlying distribution. Besides a more sophisticated way of evaluating the data (considering different distributions or using more elaborate algorithms for the data fitting process) further improvements of the experimental setup in order to cover an even broader range of angles (and scattering wave vectors) will be undertaken in the future.
Acknowledgements
The authors thank Mr. Fazil Baksh and Mr. Daniel Gareau for technical assistance for developing parts of the experimental setup, and Dr. Kevin Thomson and Dr. Fengshan Liu for inspiring discussions. The inverted burner was constructed and provided by Mr. Adam Coderre who also provided valuable reference information.
References
1. C. M. Megaridis; R. A. Dobbins, Combustion Sci. Technol. 1990, 71, (1-3), 95-109. 2. G. M. Faeth; Ü. Ö. Köylü, Combustion Science and Technology v 108 n 4-6 1995, 207-229. 3. J. Cai; N. Lu; C. M. Sorensen, Langmuir 1993, 9, (11), 2861-2867.
4. Ü. Ö. Köylü; Y. C. Xing; D. E. Rosner, Langmuir 1995, 11, (12), 4848-4854.
5. L. Liu; M. I. Mishchenko; W. Patrick Arnott, Journal of Quantitative Spectroscopy and Radiative Transfer
2008, 109, (15), 2656-2663.
6. M. Y. Choi; G. W. Mulholland; A. Hamins; T. Kashiwagi, Combustion and Flame 1995, 102, (1/2), 161-9. 7. S. S. Krishnan; K. C. Lin; G. M. Faeth, Journal of Heat Transfer Transactions of the Asme 2000, 122, (3),
517-524.
8. A. M. Brasil; T. L. Farias; M. G. Carvalho, Journal of Aerosol Science 1999, 30, (10), 1379-1389.
9. D. R. Snelling; G. J. Smallwood; F. Liu; Ã. L. Gülder; W. D. Bachalo, Applied Optics 2005, 44, (31), 6773-6785.
10. A. Coderre. Spectrally-Resolved Light Absorption Properties of Cooled Soot From a Methane Flame. Carleton University, Canada, 2009.
11. P. Van Hulle; E. Weill Marc; M. Talbaut; A. Coppalle, Particle and Particle Systems Characterization 2002, 19, 47-57.
12. Y.-l. Xu, Appl. Opt. 1995, 34, (21), 4573-4588.
13. C. M. Sorensen, Aerosol Science And Technology. 2001, 35, 648–687.
14. Ü. Ö. Köylü; G. M. Faeth, Transactions of the ASME. Journal of Heat Transfer 1993, 115, (2), 409-17. 15. T. L. Farias; M. G. Carvalho; Ü. Ö. Köylü; G. M. Faeth, J. Heat Transfer 1995, 117, (1), 152-9. 16. T. L. Farias; Ü. Ö. Köylü; M. G. Carvalho, Applied Optics. Nov 1996, 35, (33), 6560-6567.
17. P. Van Hulle; M. Talbaut; M. Weill; A. Coppalle, Measurement Science and Technology. 2002, 13, (3), 375-82.
18. D. R. Snelling; K. A. Thomson; G. J. Smallwood; Ö. L. Gülder, Applied Optics. Apr 1999, 38, (12), 2478-2485.
19. A. R. Coderre; K. A. Thomson; D. R. Snelling; M. R. Johnson, in: Proceedings of Combustion Institute Canadian Section Spring Technical Meeting, University of Toronto, Toronto, 2008.
20. B. Yang; U. O. Koylu, Journal of Quantitative Spectroscopy and Radiative Transfer 2005, 93, (1-3), 289-99. 21. K. Tian; F. Liu; K. A. Thomson; D. R. Snelling; G. J. Smallwood; D. Wang, Combustion and Flame 2004,
138, (1-2), 195-198.
22. K. Tian; K. A. Thomson; F. Liu; D. R. Snelling; G. J. Smallwood; D. Wang, Combustion and Flame 2006, 144, (4), 782-791.