arXiv:1109.5816v2 [hep-ex] 11 Dec 2011
(will be inserted by the editor)
CERN-PH-EP-2011-148 Submitted to Eur. Phys. J. C
Measurement of the jet fragmentation function and transverse
profile in proton-proton collisions at a center-of-mass energy
of 7 TeV with the ATLAS detector
The ATLAS Collaboration October 30, 2011
Abstract. The jet fragmentation function and transverse profile for jets with 25 GeV < pT jet < 500 GeV
and |ηjet| < 1.2 produced in proton-proton collisions with a center-of-mass energy of 7 TeV are presented.
The measurement is performed using data with an integrated luminosity of 36 pb−1. Jets are reconstructed
and their momentum measured using calorimetric information. The momenta of the charged particle con-stituents are measured using the tracking system. The distributions corrected for detector effects are compared with various Monte Carlo event generators and generator tunes. Several of these choices show good agreement with the measured fragmentation function. None of these choices reproduce both the transverse profile and fragmentation function over the full kinematic range of the measurement.
PACS. 13.87 -a
1 Introduction and Overview
This paper presents measurements of jet properties in proton-proton (pp) collisions at a center of mass energy of 7 TeV at the CERN LHC using the ATLAS detector. Jets are identified and their momenta measured using the calorimeters. Charged particles measured by the tracking system are then associated with these jets using a geomet-ric definition. The structure of the jets is studied using these associated particles.
Jets produced at large transverse momentum in proton-proton collisions arise from the scattering of proton-proton con-stituents leading to outgoing partons (quarks and glu-ons) with large transverse momenta. These manifest them-selves as jets of hadrons via a “fragmentation process”. While the scattering of the proton constituents is well de-scribed by perturbative QCD and leads, at lowest order, to final states of gg, gq, and qq, the fragmentation pro-cess is more complex. First, fragmentation must connect the outgoing partons with the rest of the event as the jet consists of colourless hadrons while the initiating parton carries colour. Second, the process involves the production of hadrons and takes place at an energy scale where the QCD coupling constant is large and perturbation theory cannot be used. Fragmentation is therefore described us-ing a QCD-motivated model with parameters that must be determined from experiment. The fragmentation func-tion Dh
i(z, Q) is defined as the probability that a hadron
of type h carries longitudinal momentum fraction z of the
momentum pi of a parton of type i
z ≡ pi· ph |pi|
2 . (1)
D(z, Q) depends on z and on the scale Q of the hard scattering process which produced the parton. While the value of Dh
i(z, Q) cannot be calculated in perturbative
QCD, the variation with Q can be predicted provided Q is sufficiently large [1–6].
In this paper a quantity related to Dh
i(z, Q) is
mea-sured. After jets have been reconstructed, the data are binned for fixed ranges of jet transverse momenta (pT jet),
each bin containing Njetjets; z is then determined for each
charged particle associated with the jet z = pjet· pch
|pjet|2
, (2)
where pjetis the momentum of the reconstructed jet and
pch the momentum of the charged particle. The following
quantity is measured
F (z, pT jet) ≡ 1
Njet
dNch
dz , (3)
where Nch is the number of charged particles in the jet.
F (z, pT jet) is a sum over Dhi(z, Q) weighted by the rate at
which each parton species (i) is produced from the hard scattering process. As particle identification is not used, h is summed over all charged hadrons. The hard scattering
scale Q is of the same order of magnitude as pT jet. At
small pT jet, gluon jets dominate due to the larger gluon
parton densities in the proton and larger scattering rates for gg → gg. In the pseudorapidity range used for jets in this analysis (|ηjet| < 1.2)1 the fraction of jets originating
from a hard scattering that produces a gluon falls from 80% for pT jet ∼ 25 GeV to 50% for pT jet ∼ 300 GeV
according to the Pythia [7] event generator.
The jets measured experimentally also contain parti-cles produced from the hadronization of the beam rem-nants (the “underlying event”). It should be emphasized that because colour fields connect all the strongly interact-ing partons in the pp event, no unambiguous assignment of particles to the hard scattering parton or underlying event is possible. The integral of F (z, pT jet) with respect
to z corresponds to the multiplicity of charged particles within the jet. A clear summary of fragmentation phe-nomenology is provided in [8] (Section 17) whose notation is followed here.
The derivation of Dh
i(z, Q) from F (z, pT jet) is beyond
the scope of this paper, but comparisons of F (z, pT jet)
with the predictions of several Monte Carlo (MC) gener-ators will be made. Different features of the Monte Carlo models are probed by these studies. At low values of pT jet,
the comparisons are most sensitive to the non-perturbative models of fragmentation, the connection of the partons to the remainder of the event and to the accretion of parti-cles from the underlying event into the jet. As pT jet rises,
the impact of these effects is diluted and, if all the Monte Carlo models implemented perturbative QCD in the same way, F (z, pT jet) would become similar. In particular the
increase of the total particle multiplicity with the hard scattering energy, here pT jet, is predicted by perturbative
QCD [9].
Two other related quantities that describe the trans-verse shape of the jets are also studied here. The variable prel
T is the momentum of charged particles in a jet
trans-verse to that jet’s axis: prelT =
|pch× pjet|
|pjet| . (4)
The following distribution is measured
f (prelT , pT jet) ≡ 1 Njet dNch dprel T . (5)
Finally, the density of charged particles in y-φ space, ρch(r, pT jet), is measured as a function of the angular
dis-1 ATLAS uses a right-handed coordinate system with its
ori-gin at the nominal interaction point (IP) in the centre of the detector and the Z-axis coinciding with the axis of the beam pipe. The X-axis points from the IP to the centre of the LHC ring, and the Y -axis points upward. Cylindrical coordinates (r,φ) are used in the transverse plane, φ being the azimuthal angle around the beam pipe. The pseudorapidity is defined in terms of the polar angle θ as η = − ln tan(θ/2). The rapidity y for a track or jet is defined by y = 0.5 ln [(E + pZ)/(E − pZ)]
where E denotes the energy and pZis the momentum along the
beam direction. For tracks, the energy is calculated assuming the particle is a pion.
tance r of charged particles from the axis of the jet that contains them, where r is given by:
r = ∆R(ch, jet) =q(φch− φjet)2+ (ych− yjet)2 (6)
Thus ρch(r, pT jet) is given by:
ρch(r, pT jet) ≡ 1
Njet
dNch
2πrdr. (7)
As in the case of the longitudinal variables, a com-parison of these transverse quantities with Monte Carlo generators is sensitive to many of their features. The non-perturbative hadronization processes produce particles that have limited transverse momentum with respect to the parton direction. The mean value of this transverse mo-mentum is of order a few hundred MeV, the scale where the QCD coupling constant becomes non-perturbative. At low pT jet this effect dominates. If there were no other
contributions, prel
T would remain constant with
increas-ing pT jet. Therefore more of the energy would be
concen-trated in the core of the jet as pT jet increases and the
jets would become narrower. However, as pT jet increases
contributions from processes controlled by perturbative QCD radiation become more important, contributing to jet broadening and causing the mean value of prel
T to rise
slowly (approximately logarithmically).
The phenomena described above are incorporated in all the Monte Carlo generators used to describe jet produc-tion in pp collisions, although there are significant differ-ences in how these effects are implemented. For example, Pythiadescribes non-perturbative hadronization using a string model while Herwig [10] uses a cluster model. In Pythia, coherent colour effects are described partly by string fragmentation. These effects are also produced in Herwigand Pythia from gluon radiation. Treatments of the proton remnants are also described using different phe-nomenological approaches. For both generators, the im-plementations require that a number of input parameters be tuned to the data. The results presented in this paper will test whether these Monte Carlo models and their cur-rent input parameters adequately describe jets produced at the LHC. As the results are presented in bins of pT jet,
the explicit dependence on pT jetin the variables defined in
Equations 3, 5 and 7 is often suppressed in the following. The measurement is performed using data with an in-tegrated luminosity of 36 pb−1 recorded in 2010 with the
ATLAS detector at the LHC at a center-of-mass energy of 7 TeV. The measurement covers a kinematic range of 25 GeV < pT jet < 500 GeV and |ηjet| < 1.2. Events are
triggered using a minimum bias trigger and a combina-tion of calorimeter jet triggers. A complementary ATLAS analysis [11] studying the jet fragmentation function and transverse profile of jets reconstructed from charged parti-cle tracks using a total integrated luminosity of 800 µb−1
has been completed. It explores the properties of jets at lower transverse momentum than those typically studied in this paper.
Previous measurement of jet fragmentation functions have been made in e+e− collisions [12–15], in pp collisions
[16, 17] and in ep collisions [18, 19].
This paper is organized as follows. The ATLAS de-tector is described briefly in Section 2. The Monte Carlo generator samples are discussed in Section 3. The event and object selections are described in Section 4. Section 5 contains a description of the analysis. In Section 6 the treatment of systematic uncertainties is presented. Results and conclusions are shown in Sections 7 and 8.
2 The ATLAS Detector
The ATLAS detector is described in detail in Ref. [20]. The subsystems relevant for this analysis are the inner detector (ID), the calorimeter and the trigger. The ID is used to measure the momentum of charged particles. It consists of three subsystems: a pixel detector, a sili-con strip tracker (SCT) and a transition radiation straw tube tracker (TRT). These detectors are located inside a solenoid that provides a 2 T axial field. The ID has full coverage in the azimuthal angle φ and over the pseudora-pidity range 0 < |ηtrack| < 2.5.
The electromagnetic calorimeters use liquid argon as the active detector medium. They consist of accordion-shaped electrodes and lead absorbers and cover the pseu-dorapidity range |η| < 3.2. The technology used for the hadronic calorimeters varies with η. In the barrel region (|η| < 1.7) the detector is made of scintillating tiles with steel radiator. In the endcap region (1.5 < |η| < 3.2) the detector uses liquid argon and copper. A forward calorime-ter consisting of liquid argon and tungsten/copper ab-sorbers serves as both electromagnetic and hadronic calorime-ter at large pseudorapidity and extends the coverage to |η| < 4.9.
The calorimeters are calibrated at the electromagnetic scale which correctly reconstructs the energy deposited by electrons and photons. The calorimeters are not compen-sating and the response of hadrons is lower than that of electrons (e/h > 1). Some fraction of the hadronic en-ergy can also be deposited in the material in front of and in-between calorimeters. The response for hadronic jets [21] is ∼ 50% of the true energy for pT jet = 20 GeV
and |ηjet| < 0.8 and rises both with pT jet and ηjet. For
|ηjet| < 0.8, the response at pT jet= 1 TeV is ∼ 80%.
The ATLAS trigger consists of three levels of event se-lection: Level-1 (L1), Level-2 (L2), and Event Filter. The L2 and event filter together form the High-Level Trigger (HLT). The L1 trigger is implemented using custom-made electronics, while the HLT is based on fast data recon-struction online algorithms running on commercially avail-able computers and networking systems. The triggers rel-evant for this analysis are the L1 minimum bias triggers (MBTS) and the L1 and HLT calorimeter triggers. The minimum bias trigger is based on signals from 32 scintil-lation counters located at pseudorapidities 2.09 < |η| < 3.84. Because non-diffractive events fire the MBTS with high efficiency and negligible bias, this trigger can be used to study jets with low pT jet. However, MBTS triggers were
highly prescaled at large instantaneous luminosities, mak-ing them unsuitable for studies of high pT jets that are
produced at low rate. A series of single jet inclusive trig-gers with different jet ET thresholds and prescales were
de-ployed to ensure that significant data samples were taken over the full range of pT jet [22].
3 Monte Carlo Samples
Several Monte Carlo samples are used in this analysis. Some samples were processed with the ATLAS full de-tector simulation [23] which is based on the GEANT4 toolkit [24]. The simulated events are then passed through the same reconstruction software as the data. These are used to model the response of the detector and to cor-rect the data for experimental effects. The baseline Monte Carlo sample used to determine these corrections is pro-duced using Pythia [7] 6.421 with the ATLAS tune AMBT1 which uses the MRST2007LO* PDFs [25] and was derived using the measured properties of minimum bias events [26]. Several other fully simulated samples are used to assess systematic uncertainties: Pythia using the Perugia2010 tune [27] (CTEQ5L PDFs [28]); Herwig 6.5 [10] using Jimmy 3.41 [29] and Herwig++2.4.2 [30] (MRST2007LO*
PDFs).
Additional Monte Carlo generator samples are used to compare with the final corrected data: Pythia6.421 with the ATLAS MC09 tune [31] (MRST2007LO* PDFs), Herwig++2.5.1 [32] (MRST2007LO* PDFs) , Sherpa [33]
(CTEQ6L [34] PDFs) and Pythia8 (8.105) [35] (MRST2007LO* PDFs).
4 Reconstruction and Event Selection
Events are required to have at least one primary vertex reconstructed using ID tracks. If the event has multiple primary vertices, the vertex with the largestP(pT track)2
is tagged as the hard-scattering vertex.
Jets are reconstructed using the infrared- and collinear-safe anti-ktalgorithm [36] with radius parameter Rc= 0.6
using the FastJet package [37]. The detector input is based on topological clusters [38]. A topological cluster is de-fined to have an energy equal to the energy sum of all the included calorimeter cells, zero mass and a recon-structed direction calculated from the weighted averages of the pseudo-rapidities and azimuthal angles of the con-stituent cells. The weight used is the absolute cell energy and the positions of the cells are relative to the nominal ATLAS coordinate system. The energy of these clusters is measured at the electromagnetic scale, which provides the appropriate calibration for electrons and photons. A
pT jet and ηjet dependent calibration is then applied to
each jet [21]. These calibrations are based on comparing the response from simulated calorimeter jets to that of jets reconstructed using generator particles and matched to the reconstructed jets in η-φ space. The η-φ position of the jet (and hence its momentum) is corrected to account
z -2 10 × 3 10-1 2×10⁻¹ Systematic Uncertainty (%) 0 10 20 30 40 50 < 40 GeV T jet 25 GeV < p ATLAS = 7 TeV s -1 L dt = 36 pb
∫
TotalJet energy scale Jet energy resolution Response Matrix Tracking efficiency Track momentum resolution
z -2 10 × 3 10-1 2×10⁻¹ Systematic Uncertainty (%) 0 10 20 30 40 50 z -2 10 10-1 Systematic Uncertainty (%) 0 2 4 6 8 10 12 14 16 18 < 500 GeV T jet 400 GeV < p ATLAS = 7 TeV s -1 L dt = 36 pb
∫
TotalJet energy scale Jet energy resolution Response Matrix Tracking efficiency Track momentum resolution
z -2 10 10-1 Systematic Uncertainty (%) 0 2 4 6 8 10 12 14 16 18
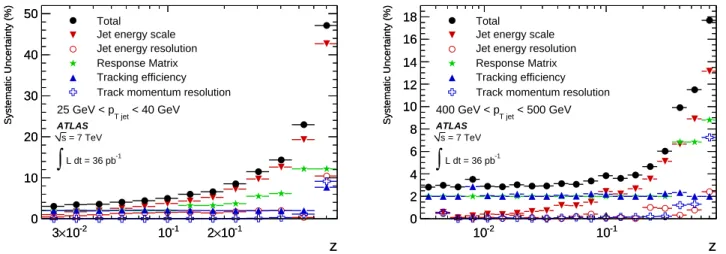
Fig. 1.Systematic uncertainty in F (z, pT jet) from uncertainties in the jet energy scale and resolution, the track reconstruction
efficiency and momentum resolution and the response matrix for 25 GeV < pT jet < 40 GeV (left) and 400 GeV < pT jet <
500 GeV (right). The total uncertainty from the combination is also shown.
(GeV) rel T p 0 0.5 1 1.5 2 2.5 3 Systematic Uncertainty (%) 0 5 10 15 20 25 30 35 40 < 40 GeV T jet 25 GeV < p ATLAS = 7 TeV s -1 L dt = 36 pb
∫
Total Jet energy scale Jet energy resolution Response Matrix Tracking efficiency Track momentum resolution(GeV) rel T p 0 0.5 1 1.5 2 2.5 3 Systematic Uncertainty (%) 0 5 10 15 20 25 30 < 500 GeV T jet 400 GeV < p ATLAS = 7 TeV s -1 L dt = 36 pb
∫
Total Jet energy scale Jet energy resolution Response Matrix Tracking efficiency Track momentum resolutionFig. 2.Systematic uncertainty in f (prel
T , pT jet) from uncertainties in the jet energy scale and resolution, the track reconstruction
efficiency and momentum resolution and the response matrix for 25 GeV < pT jet < 40 GeV (left) and 400 GeV < pT jet <
500 GeV (right). The total uncertainty from the combination is also shown.
for the fact that the primary vertex of the interaction is not at the geometric centre of the detector. Quality cri-teria are applied to ensure that jets are not produced by noisy calorimeter cells, and to avoid problematic detector regions. The jet energy is corrected for the presence of ad-ditional pp interactions in the same bunch crossing using correction constants measured in-situ that depend on the number of reconstructed primary vertices.
Jets are required to have |ηjet| < 1.2. For events
se-lected with the MBTS trigger, jets are required to pass a minimum cut of pT jet> 20 GeV. For events selected using
jet triggers, a trigger-dependent minimum pT jet threshold
is imposed on jets used in the final measurements to en-sure a jet trigger efficiency larger than 99%.
Tracks are selected using the following cuts:
pT track> 0.5 GeV, Npixel≥ 1, NSCT≥ 6,
|d0| < 1.5 mm, |z0sin θ| < 1.5 mm,
where Npixel and NSCT are the number of hits from the
pixel and SCT detectors, respectively, that are associated with the track and d0and z0are the transverse and
longi-tudinal impact parameters measured with respect to the hard-scattering vertex.
Tracks are associated with jets using a simple geomet-ric algorithm. If the distance in η-φ between the track and the jet is less than the radius parameter used in the jet reconstruction (Rc = 0.6), the tracks are considered to
belong to the jet. Track parameters are evaluated at the perigee to the primary vertex and are not extrapolated to the calorimeter. This simple association algorithm facili-tates comparison with particles from the event generator whose parameters correspond to those measured at the primary vertex..
r 0 0.1 0.2 0.3 0.4 0.5 0.6 Systematic Uncertainty 0 2 4 6 8 10 12 < 40 GeV T jet 25 GeV < p ATLAS = 7 TeV s -1 L dt = 36 pb
∫
Total Jet energy scale Jet energy resolution Response Matrix Tracking efficiency Track momentum resolutionr 0 0.1 0.2 0.3 0.4 0.5 0.6 Systematic Uncertainty 0 1 2 3 4 5 6 7 8 < 500 GeV T jet 400 GeV < p ATLAS = 7 TeV s -1 L dt = 36 pb
∫
Total Jet energy scale Jet energy resolution Response Matrix Tracking efficiency Track momentum resolutionFig. 3.Systematic uncertainty in ρch(r, pT jet) from uncertainties in the jet energy scale and resolution, the track reconstruction
efficiency and momentum resolution and the response matrix for 25 GeV < pT jet < 40 GeV (left) and 400 GeV < pT jet <
500 GeV (right). The total uncertainty from the combination is also shown.
F(z)
-1 10 1 10 2 10 < 40 GeV T jet 25 GeV < p ATLAS = 7 TeV s -1 L dt = 36 pb∫
Data Pythia6 AMBT1 Pythia6 MC09 Pythia6 Perugia 2010 Herwig+Jimmy Herwig++ 2.4.2 Herwig++ 2.5.1 Sherpa Pythia8 8.145 4Cz
-2 10 × 3 10-1 2×10⁻¹ (MC-Data)/Data (%) -60 -40 -20 0 20 40 60z
-2 10 × 3 10-1 2×10⁻¹ (MC-Data)/Data (%) -60 -40 -20 0 20 40 60F(z)
-1 10 1 10 2 10 3 10 < 500 GeV T jet 400 GeV < p ATLAS = 7 TeV s -1 L dt = 36 pb∫
Data Pythia6 AMBT1 Pythia6 MC09 Pythia6 Perugia 2010 Herwig+Jimmy Herwig++ 2.4.2 Herwig++ 2.5.1 Sherpa Pythia8 8.145 4Cz
-2 10 10-1 (MC-Data)/Data (%) -60 -40 -20 0 20 40 60z
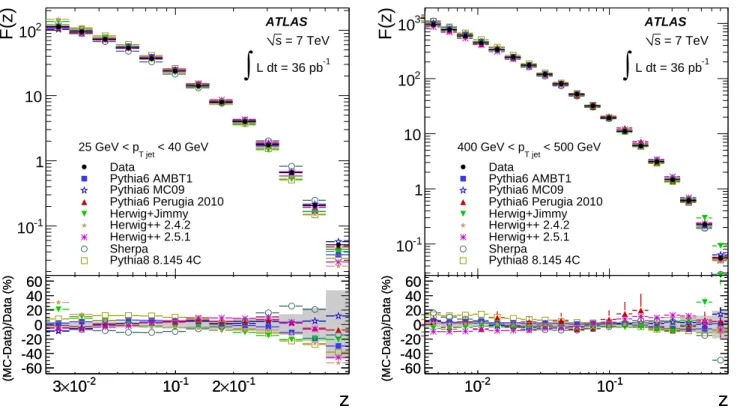
-2 10 10-1 (MC-Data)/Data (%) -60 -40 -20 0 20 40 60Fig. 4. Distributions of F (z) for 25 GeV < pT jet < 40 GeV (left) and 400 GeV < pT jet < 500 GeV (right). The gray band
indicates the total uncertainty.
5 Analysis
The results presented here are obtained using four mea-sured distributions: the jet transverse momentum spec-trum, dNjet(pT jet)/dpT jet, and three differential
distribu-tions of the number of charged tracks, dNtracks(z, pT jet)/dz,
dNtracks(prelT , pT jet)/dprelT and dNtracks(r, pT jet)/dr. To
fa-cilitate comparison with the predictions of Monte Carlo event generators, these distributions are corrected for
de-tector acceptance, reconstruction efficiency and migration due to track and jet momentum resolution effects. This correction procedure is called unfolding. The distributions F (z, pT jet), f (prelT , pT jet) and ρch(r, pT jet) are obtained
from the charged particle differential distributions by nor-malizing the distribution for each pT jet range to the value
of Njet(pT jet) obtained from the unfolding of the jet
pT jet> 25 GeV; however, to decrease the systematic
un-certainty associated with the modeling of the pT jet
spec-trum, jets with 20 GeV < pT jet < 25 GeV are also used
in the unfolding.
A Bayesian iterative unfolding method [39] implemented in the RooUnfold [40] software package is used. This pro-cedure takes as its input the measured distributions and a response matrix obtained from simulated data that pro-vides a mapping between reconstructed objects and those obtained directly from the event generator. This response matrix is not unitary because in mapping from generator to reconstruction some events and objects are lost due to inefficiencies and some are gained due to misreconstruc-tion or migramisreconstruc-tion of truth objects from outside the fiducial acceptance into the reconstructed observables. It is there-fore not possible to obtain the unfolded distributions by inverting the response matrix and applying it to the mea-sured data. Instead, an assumed truth distribution (the “prior”) is selected, the response matrix is applied and the resulting trial reconstruction set is compared to the ob-served reconstruction set. A new prior is then constructed from the old prior and the difference between the trial and the observed distributions. The procedure can iterated un-til this difference becomes small. Monte Carlo based stud-ies of the performance of the procedure demonstrate that in this analysis no iteration is necessary. The initial truth prior is taken to be the prediction of the baseline Monte Carlo generator. Systematic uncertainties associated with this choice and with the modeling of the response matrix are discussed in Section 6.
6 Systematic Uncertainties
The following sources of systematic uncertainties are con-sidered:
1. The jet energy scale (JES) and resolution (JER) un-certainties which affect the measurement of the num-ber of jets in a given pT jet bin and consequently the
measured value of z.
2. The track reconstruction efficiency and momentum re-construction uncertainties which affect the number of tracks in each z, prel
T and Nch(r) bin.
3. The uncertainty in the response matrix which is rived using a particular Monte Carlo sample and de-pends on the details of the event generator.
4. Potential bias due to the failure of the unfolding pro-cedure to converge to the correct value.
These systematic uncertainties are addressed using Monte Carlo methods.
The first two systematic uncertainties, potential bias due to incorrect Monte Carlo modeling of the JES and/or JER and potential bias due to mismodeling by the sim-ulation of the track reconstruction efficiency and/or res-olution, are studied by modifying the detector response in simulated data. These modified Monte Carlo events are then unfolded and compared to the baseline. The sys-tematic uncertainty on the JES is studied by varying the
z
-210
10
-1)
T jetF(z,p
-210
1
210
410
610
810
1010
1210
1410
1610
1810
2010
2210
2410
0 < 40 GeV, x10 T jet 25 GeV < p 2 < 60 GeV, x10 T jet 40 GeV < p 4 < 80 GeV, x10 T jet 60 GeV < p 6 < 110 GeV, x10 T jet 80 GeV < p 8 < 160 GeV, x10 T jet 110 GeV < p 10 < 210 GeV, x10 T jet 160 GeV < p 12 < 260 GeV, x10 T jet 210 GeV < p 14 < 310 GeV, x10 T jet 260 GeV < p 16 < 400 GeV, x10 T jet 310 GeV < p 18 < 500 GeV, x10 T jet 400 GeV < p ATLAS = 7 TeV s∫
L dt = 36 pb-1 Data Pythia6 AMBT1z
-210
10
-1)
T jetF(z,p
-210
1
210
410
610
810
1010
1210
1410
1610
1810
2010
2210
2410
Fig. 5.Distributions of F (z) in bins of pT jet. The circles show
unfolded data and the lines are the predictions from AMBT1 Pythia.
jet energy response by its uncertainty. The JES uncer-tainty varies from 4.6% at pT jet = 20 GeV to 2.5%
at pT jet = 500 GeV [21]. Systematic uncertainties on
the JER are studied by broadening the jet energy reso-lution with an additional ηjet and pT jet dependent
Gaus-sian term. The uncertainty on the JER is below 14% for the full pT jet and ηjet range used in this analysis [41].
The uncertainty on the tracking efficiency is studied by randomly removing a fraction of the tracks in the sim-ulated data. Uncertainties on the tracking efficiency are η-dependent and vary between 2% and 3% for the rele-vant range of ηtrack [42], dominated by the accuracy of
the description of the detector material in the simulation. In addition, there can be a loss of tracking efficiency in the core of jets at high pT jetdue to a single pixel hit receiving
contributions from more than track. Studies of such hit sharing show that the simulation and data agree well and that the resulting systematic uncertainty is negligible for
pT jet< 500 GeV. Uncertainties on the track momentum
broadening of the resolution in curvature with values that vary from 0.0004 GeV−1 to 0.0009 GeV−1 [43].
While the studies described above account for system-atic uncertainties associated with the accuracy of the de-tector simulation, they do not account for the fact that the response matrix itself depends on the fragmentation properties of the jets and hence on the physics descrip-tion in the event generator. Because the response of the calorimeter to hadrons depends on the hadron momen-tum [44], the JES depends at the few per cent level on the momentum spectrum of particles within the jet. Be-cause the probability that a track will share hits in the ID with another track is dependent upon the local density of particles within the jet, the tracking resolution depends weakly on the transverse profile of particles within the jet. These effects have been studied by unfolding fully simu-lated Monte Carlo samples created from Perugia2010, Herwig 6.5 (with Jimmy 3.41) and Herwig++ using the
baseline response matrix obtained with Pythia AMBT1. Differences between the unfolded results for each tune and the true distributions obtained from that same tune are studied as a function of z, prel
T and Nch(r) for each bin in
true pT jet and used to assess the systematic uncertainty.
Potential bias in the unfolding procedure itself is stud-ied by creating 1000 pseudo-experiments where the “data” are drawn from the baseline fully simulated Monte Carlo samples via a bootstrap method [45] and unfolding these ”data” using the standard procedure. The mean results obtained from these samples show negligible bias and have a spread that is consistent with the reported statistical uncertainties. The systematic uncertainty due to the un-folding procedure is thus deemed to be negligible in com-parison to the other uncertainties.
The resulting systematic uncertainties on F (z, pT jet),
f (prel
T , pT jet) and ρch(r, pT jet) for the 25 GeV < pT jet <
40 GeV (left ) and 400 GeV < pT jet < 500 GeV (right )
are shown in Figures 1 through 3. For F (z, pT jet),
un-certainties on the tracking efficiency and response matrix dominate at low z while the jet energy scale dominates at high z. For f (prel
T , pT jet) the jet energy scale, response
matrix and tracking efficiency uncertainties are all sig-nificant and the overall uncertainty rises with prel
T . For
ρch(r, pT jet), the response matrix and tracking efficiency
uncertainties are significant for all pT jet and r while the
jet energy scale contribution is most important for small
pT jet.
7 Results
This section presents comparisons of acceptance-corrected, unfolded data to the predictions of several Monte Carlo generators. The gray band on all the figures indicates the total uncertainty which is dominated by the systematic uncertainty. Figure 4 shows distributions of F (z) in two bins of pT jet. Figure 5 shows distributions of F (z) in all
bins of pT jet compared to AMBT1 Monte Carlo.
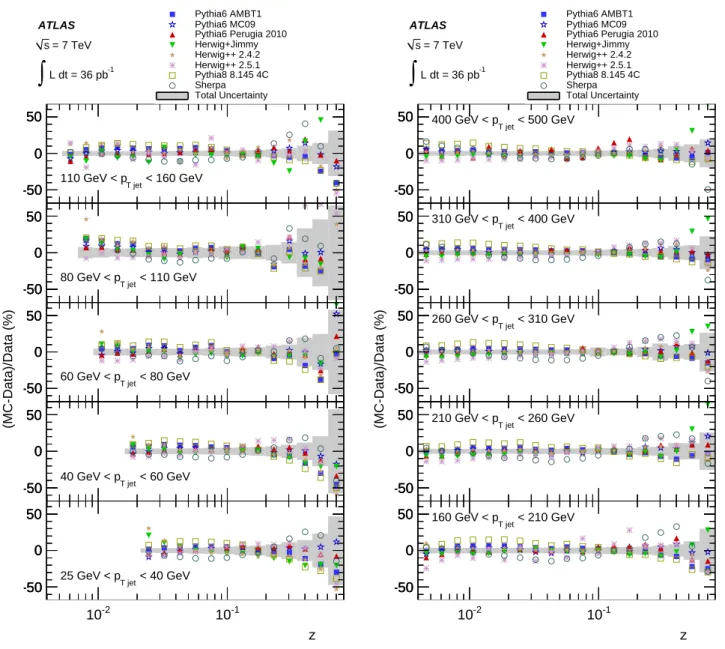
Com-parisons of the data and the Monte Carlo samples are shown in Figure 6. All the Pythia 6 tunings show good
agreement with the data. Herwig+Jimmy disagrees with the data at large z for pT jet > 200 GeV. Herwig++2.5.1
is below the data at low z for pT jet > 100 GeV while
Herwig++2.4.2 has too many particles at low z for pT jet <
100 GeV. Pythia8 and Sherpa provide a poor description of the data.
Figure 7 (left ) shows the distribution of hzi for the data and for a selection of Monte Carlo samples as a func-tion of pT jet. A comparison with the Monte Carlo
gen-erators shows that the AMBT1 and MC09 Pythia and Perugia2010 datasets show good agreement with the data over the entire pT jetrange. The agreement with
Her-wig+Jimmy is satisfactory. Herwig++2.5.1 is inconsistent
with the data for pT jet> 40 GeV and 2.4.2 is inconsistent
for pT jet < 100 GeV. Pythia8 is ∼ 8% below the data
at all pT jet. Sherpa agrees well.
The charged particle multiplicity as a function of pT jet
is shown in Figure 7 (right ). The Pythia 6 tunes show reasonable agreement, with AMBT1 being higher than the others. Herwig+Jimmy has slightly too few particles for
pT jet > 200 GeV. Herwig++ 2.4.2 (2.5.1) has too many
(few) particles for pT jet < 200 (> 300) GeV. Sherpa
de-scribes the data well while Pythia8 has ∼ 8% too many particles at all pT jet.
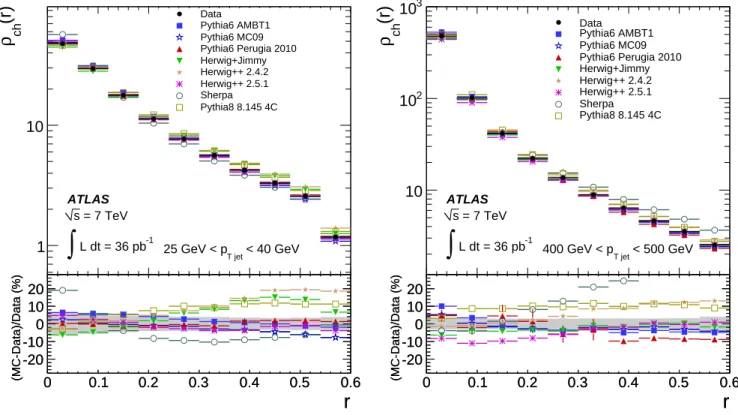
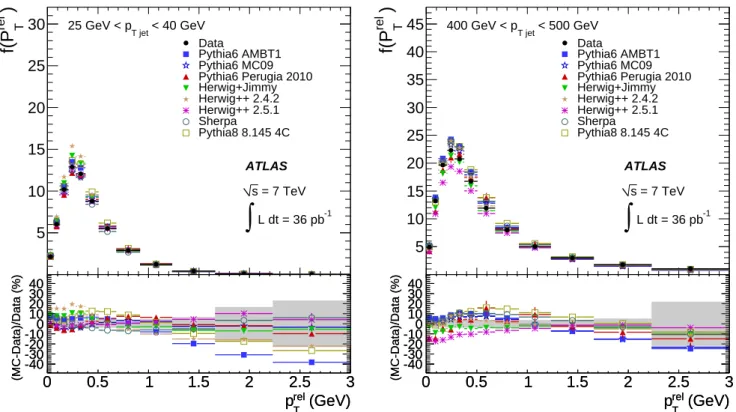
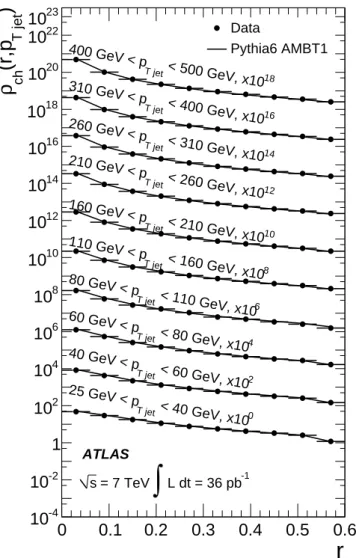
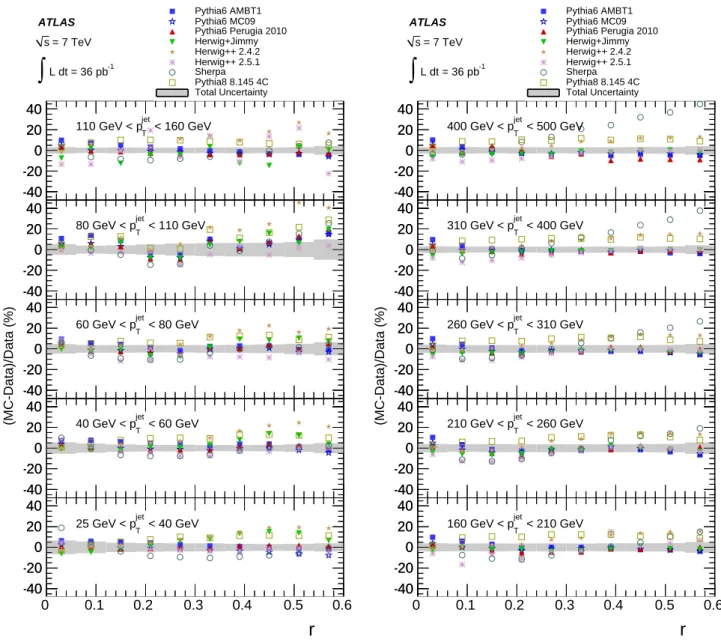
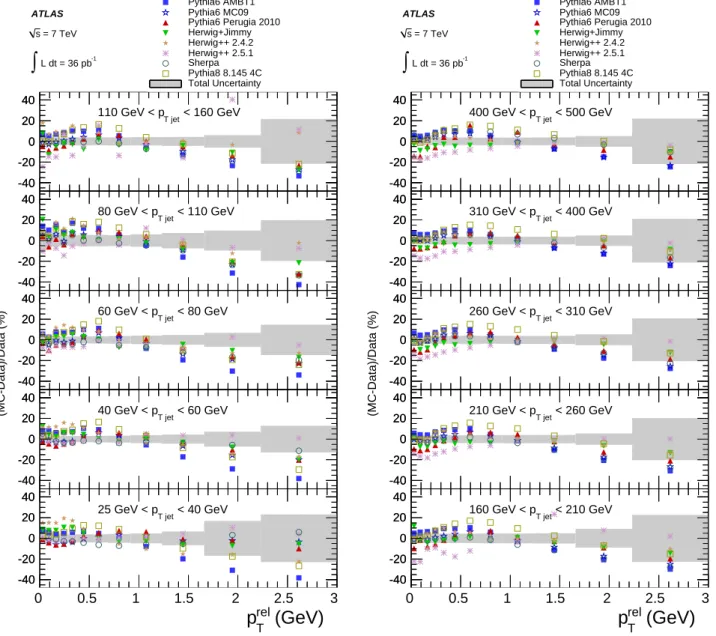
The transverse profile of the jets is described by the ρch(r) and f (prelT ) distributions. Figure 8 shows the
distri-bution of ρch(r) in two bins of pT jet. The sharp decrease
in population in the last bin is a feature of the jet al-gorithm, which tends to incorporate particles close to the radius parameter into the jet. The effect is also seen in [11] (Figure 6) where distributions for two radius parameters are shown. Figure 9 shows the distribution of f (prel
T ) in
the same two pT jetbins. Figures 10 and 11 show
distribu-tions of ρch(r) and f (prelT ), respectively, in all pT jet bins
together with the predictions of the AMBT1 Monte Carlo. Comparisons of ρch(r) for all data and Monte Carlo are
shown in Figure 12. Sherpa, Herwig++2.4.2 and Pythia8
disagree significantly with the data over the full range of the measurement. Pythia8 is consistent with the data only over a very restricted range of pT jet around 80 GeV.
Herwig++2.5.1 shows good agreement except at small r
and for pT jet > 200 GeV. Herwig+Jimmy is consistent
with the data only for pT jet> 160 GeV. All the Pythia 6
tunings except AMBT1 agree; AMBT1 shows disagree-ment for pT jet > 200 GeV. Comparison of f (prelT ) for all
data and Monte Carlos are shown in Figure 13. None of the generators agree with the data within the systematic uncertainties.
The mean value of prel
T as a function of pT jet is shown
in Figure 14. Herwig++2.5.1 has much too large a value
of hprel
T i for pT jet > 100 GeV and 2.4.2 has too small
a value for pT jet < 80 GeV. AMBT1 has too small a
value at all pT jet. Herwig+Jimmy has too large a value
for pT jet> 200 GeV. Agreement of the remaining Monte
-50 0 50 -50 0 50 < 40 GeV T jet 25 GeV < p -50 0 50 -50 0 50 -50 0 50 < 60 GeV T jet 40 GeV < p -50 0 50 -50 0 50 -50 0 50 < 80 GeV T jet 60 GeV < p -50 0 50 -50 0 50 -50 0 50 < 110 GeV T jet 80 GeV < p -50 0 50 -50 0 50 -50 0 50 < 160 GeV T jet 110 GeV < p -50 0 50 -2 10 10-1 z (MC-Data)/Data (%) Pythia6 AMBT1 Pythia6 MC09 Pythia6 Perugia 2010 Herwig+Jimmy Herwig++ 2.4.2 Herwig++ 2.5.1 Pythia8 8.145 4C Sherpa Total Uncertainty ATLAS = 7 TeV s -1 L dt = 36 pb
∫
-50 0 50 -50 0 50 < 210 GeV T jet 160 GeV < p -50 0 50 -50 0 50 -50 0 50 < 260 GeV T jet 210 GeV < p -50 0 50 -50 0 50 -50 0 50 < 310 GeV T jet 260 GeV < p -50 0 50 -50 0 50 -50 0 50 < 400 GeV T jet 310 GeV < p -50 0 50 -50 0 50 -50 0 50 < 500 GeV T jet 400 GeV < p -50 0 50 -2 10 10-1 z (MC-Data)/Data (%) Pythia6 AMBT1 Pythia6 MC09 Pythia6 Perugia 2010 Herwig+Jimmy Herwig++ 2.4.2 Herwig++ 2.5.1 Pythia8 8.145 4C Sherpa Total Uncertainty ATLAS = 7 TeV s -1 L dt = 36 pb∫
Fig. 6.The ratio of F (z) predicted by various Monte Carlo generators to that measured. The gray band indicates the combined statistical and systematic uncertainties.
<z>
0.03 0.04 0.05 0.06 0.07 0.08 Data Pythia6 AMBT1 Pythia6 MC09 Pythia6 Perugia 2010 Herwig+Jimmy Herwig++ 2.4.2 Herwig++ 2.5.1 Sherpa Pythia8 8.145 4C ATLAS = 7 TeV s -1 L dt = 36 pb∫
(GeV) T jet p 30 40 50 102 2×10² (MC-Data)/Data (%) -15 -10 -5 0 5 10 15 (GeV) T jet p 30 40 50 102 2×10² (MC-Data)/Data (%) -15 -10 -5 0 5 10 15 > ch <N 2 4 6 8 10 12 14 16 18 20 Data Pythia6 AMBT1 Pythia6 MC09 Pythia6 Perugia 2010 Herwig+Jimmy Herwig++ 2.4.2 Herwig++ 2.5.1 Sherpa Pythia8 8.145 4C ATLAS = 7 TeV s -1 L dt = 36 pb∫
(GeV) T jet p 30 40 50 102 2×10² (MC-Data)/Data (%) -15 -10 -5 0 5 10 15 (GeV) T jet p 30 40 50 102 2×10² (MC-Data)/Data (%) -15 -10 -5 0 5 10 15Fig. 7.Distributions of < z > (left) and of the mean number of charged particles selected with the requirement pT track¿ 500
MeV (right) as a function of pT jetfor data and various Monte Carlos. The gray band indicated the total uncertainty.
0 0.1 0.2 0.3 0.4 0.5 0.6
(r)
chρ
1 10 < 40 GeV T jet 25 GeV < p ATLAS = 7 TeV s -1 L dt = 36 pb∫
Data Pythia6 AMBT1 Pythia6 MC09 Pythia6 Perugia 2010 Herwig+Jimmy Herwig++ 2.4.2 Herwig++ 2.5.1 Sherpa Pythia8 8.145 4Cr
0 0.1 0.2 0.3 0.4 0.5 0.6 (MC-Data)/Data (%) -20 -10 0 10 20r
0 0.1 0.2 0.3 0.4 0.5 0.6 (MC-Data)/Data (%) -20 -10 0 10 20 0 0.1 0.2 0.3 0.4 0.5 0.6(r)
chρ
10 2 10 3 10 < 500 GeV T jet 400 GeV < p ATLAS = 7 TeV s -1 L dt = 36 pb∫
Data Pythia6 AMBT1 Pythia6 MC09 Pythia6 Perugia 2010 Herwig+Jimmy Herwig++ 2.4.2 Herwig++ 2.5.1 Sherpa Pythia8 8.145 4Cr
0 0.1 0.2 0.3 0.4 0.5 0.6 (MC-Data)/Data (%) -20 -10 0 10 20r
0 0.1 0.2 0.3 0.4 0.5 0.6 (MC-Data)/Data (%) -20 -10 0 10 20Fig. 8. Distributions of ρch(r) for 25 GeV < pT jet< 40 GeV (left) and 400 GeV < pT jet < 500 GeV (right). The gray band
0 0.5 1 1.5 2 2.5 3
)
rel Tf(P
5 10 15 20 25 30 < 40 GeV T jet 25 GeV < p ATLAS = 7 TeV s -1 L dt = 36 pb∫
Data Pythia6 AMBT1 Pythia6 MC09 Pythia6 Perugia 2010 Herwig+Jimmy Herwig++ 2.4.2 Herwig++ 2.5.1 Sherpa Pythia8 8.145 4C (GeV) rel T p 0 0.5 1 1.5 2 2.5 3 (MC-Data)/Data (%) -40 -30 -20 -100 10 20 30 40 (GeV) rel T p 0 0.5 1 1.5 2 2.5 3 (MC-Data)/Data (%) -40 -30 -20 -100 10 20 30 40 0 0.5 1 1.5 2 2.5 3)
rel Tf(P
5 10 15 20 25 30 35 40 45 < 500 GeV T jet 400 GeV < p ATLAS = 7 TeV s -1 L dt = 36 pb∫
Data Pythia6 AMBT1 Pythia6 MC09 Pythia6 Perugia 2010 Herwig+Jimmy Herwig++ 2.4.2 Herwig++ 2.5.1 Sherpa Pythia8 8.145 4C (GeV) rel T p 0 0.5 1 1.5 2 2.5 3 (MC-Data)/Data (%) -40 -30 -20 -100 10 20 30 40 (GeV) rel T p 0 0.5 1 1.5 2 2.5 3 (MC-Data)/Data (%) -40 -30 -20 -100 10 20 30 40Fig. 9. Distributions of f (prel
T ) for 25 GeV < pT jet< 40 GeV (left) and 400 GeV < pT jet < 500 GeV (right). The gray band
r
0
0.1
0.2
0.3
0.4
0.5
0.6
)
T jet(r,p
chρ
-410
-210
1
210
410
610
810
1010
1210
1410
1610
1810
2010
2210
2310
0 < 40 GeV, x10 T jet 25 GeV < p 2 < 60 GeV, x10 T jet 40 GeV < p 4 < 80 GeV, x10 T jet 60 GeV < p 6 < 110 GeV, x10 T jet 80 GeV < p 8 < 160 GeV, x10 T jet 110 GeV < p 10 < 210 GeV, x10 T jet 160 GeV < p 12 < 260 GeV, x10 T jet 210 GeV < p 14 < 310 GeV, x10 T jet 260 GeV < p 16 < 400 GeV, x10 T jet 310 GeV < p 18 < 500 GeV, x10 T jet 400 GeV < p ATLAS = 7 TeV s∫
L dt = 36 pb-1 Data Pythia6 AMBT1Fig. 10. Distributions of ρch(r). The circles show unfolded
data. The lines are the predictions from AMBT1 Pythia.
(GeV)
rel Tp
0
0.5
1
1.5
2
2.5
3
)
T jet,p
rel Tf(P
-410
-110
210
510
810
1110
1410
1710
2010
2310
0 < 40 GeV, x10 T jet 25 GeV < p 2 < 60 GeV, x10 T jet 40 GeV < p 4 < 80 GeV, x10 T jet 60 GeV < p 6 < 110 GeV, x10 T jet 80 GeV < p 8 < 160 GeV, x10 T jet 110 GeV < p 10 < 210 GeV, x10 T jet 160 GeV < p 12 < 260 GeV, x10 T jet 210 GeV < p 14 < 310 GeV, x10 T jet 260 GeV < p 16 < 400 GeV, x10 T jet 310 GeV < p 18 < 500 GeV, x10 T jet 400 GeV < p ATLAS = 7 TeV s∫
L dt = 36 pb-1 Data Pythia6 AMBT1Fig. 11. Distributions of f (prel
T ). The circles show unfolded
0 0.1 0.2 0.3 0.4 0.5 0.6 -40 -20 0 20 40 0 0.1 0.2 0.3 0.4 0.5 0.6 -40 -20 0 20 40 < 40 GeV jet T 25 GeV < p 0 0.1 0.2 0.3 0.4 0.5 0.6 -40 -20 0 20 40 0 0.1 0.2 0.3 0.4 0.5 0.6 -40 -20 0 20 40 < 60 GeV jet T 40 GeV < p 0 0.1 0.2 0.3 0.4 0.5 0.6 -40 -20 0 20 40 0 0.1 0.2 0.3 0.4 0.5 0.6 -40 -20 0 20 40 < 80 GeV jet T 60 GeV < p 0 0.1 0.2 0.3 0.4 0.5 0.6 -40 -20 0 20 40 0 0.1 0.2 0.3 0.4 0.5 0.6 -40 -20 0 20 40 < 110 GeV jet T 80 GeV < p 0 0.1 0.2 0.3 0.4 0.5 0.6 -40 -20 0 20 40 0 0.1 0.2 0.3 0.4 0.5 0.6 -40 -20 0 20 40 < 160 GeV jet T 110 GeV < p 0 0.1 0.2 0.3 0.4 0.5 0.6
r
(MC-Data)/Data (%) Pythia6 AMBT1 Pythia6 MC09 Pythia6 Perugia 2010 Herwig+Jimmy Herwig++ 2.4.2 Herwig++ 2.5.1 Sherpa Pythia8 8.145 4C Total Uncertainty ATLAS = 7 TeV s -1 L dt = 36 pb∫
0 0.1 0.2 0.3 0.4 0.5 0.6 -40 -20 0 20 40 0 0.1 0.2 0.3 0.4 0.5 0.6 -40 -20 0 20 40 < 210 GeV jet T 160 GeV < p 0 0.1 0.2 0.3 0.4 0.5 0.6 -40 -20 0 20 40 0 0.1 0.2 0.3 0.4 0.5 0.6 -40 -20 0 20 40 < 260 GeV jet T 210 GeV < p 0 0.1 0.2 0.3 0.4 0.5 0.6 -40 -20 0 20 40 0 0.1 0.2 0.3 0.4 0.5 0.6 -40 -20 0 20 40 < 310 GeV jet T 260 GeV < p 0 0.1 0.2 0.3 0.4 0.5 0.6 -40 -20 0 20 40 0 0.1 0.2 0.3 0.4 0.5 0.6 -40 -20 0 20 40 < 400 GeV jet T 310 GeV < p 0 0.1 0.2 0.3 0.4 0.5 0.6 -40 -20 0 20 40 0 0.1 0.2 0.3 0.4 0.5 0.6 -40 -20 0 20 40 < 500 GeV jet T 400 GeV < p 0 0.1 0.2 0.3 0.4 0.5 0.6r
(MC-Data)/Data (%) Pythia6 AMBT1 Pythia6 MC09 Pythia6 Perugia 2010 Herwig+Jimmy Herwig++ 2.4.2 Herwig++ 2.5.1 Sherpa Pythia8 8.145 4C Total Uncertainty ATLAS = 7 TeV s -1 L dt = 36 pb∫
Fig. 12. The ratio of ρch(r) predicted by various Monte Carlo generators to that measured. The gray band indicates the
0 0.5 1 1.5 2 2.5 3 -40 -20 0 20 40 0 0.5 1 1.5 2 2.5 3 -40 -20 0 20 40 < 40 GeV T jet 25 GeV < p 0 0.5 1 1.5 2 2.5 3 -40 -20 0 20 40 0 0.5 1 1.5 2 2.5 3 -40 -20 0 20 40 < 60 GeV T jet 40 GeV < p 0 0.5 1 1.5 2 2.5 3 -40 -20 0 20 40 0 0.5 1 1.5 2 2.5 3 -40 -20 0 20 40 < 80 GeV T jet 60 GeV < p 0 0.5 1 1.5 2 2.5 3 -40 -20 0 20 40 0 0.5 1 1.5 2 2.5 3 -40 -20 0 20 40 < 110 GeV T jet 80 GeV < p 0 0.5 1 1.5 2 2.5 3 -40 -20 0 20 40 0 0.5 1 1.5 2 2.5 3 -40 -20 0 20 40 < 160 GeV T jet 110 GeV < p 0 0.5 1 1.5 2 2.5 3
(GeV)
rel Tp
(MC-Data)/Data (%) Pythia6 AMBT1 Pythia6 MC09 Pythia6 Perugia 2010 Herwig+Jimmy Herwig++ 2.4.2 Herwig++ 2.5.1 Sherpa Pythia8 8.145 4C Total Uncertainty ATLAS = 7 TeV s -1 L dt = 36 pb∫
0 0.5 1 1.5 2 2.5 3 -40 -20 0 20 40 0 0.5 1 1.5 2 2.5 3 -40 -20 0 20 40 < 210 GeV T jet 160 GeV < p 0 0.5 1 1.5 2 2.5 3 -40 -20 0 20 40 0 0.5 1 1.5 2 2.5 3 -40 -20 0 20 40 < 260 GeV T jet 210 GeV < p 0 0.5 1 1.5 2 2.5 3 -40 -20 0 20 40 0 0.5 1 1.5 2 2.5 3 -40 -20 0 20 40 < 310 GeV T jet 260 GeV < p 0 0.5 1 1.5 2 2.5 3 -40 -20 0 20 40 0 0.5 1 1.5 2 2.5 3 -40 -20 0 20 40 < 400 GeV T jet 310 GeV < p 0 0.5 1 1.5 2 2.5 3 -40 -20 0 20 40 0 0.5 1 1.5 2 2.5 3 -40 -20 0 20 40 < 500 GeV T jet 400 GeV < p 0 0.5 1 1.5 2 2.5 3(GeV)
rel Tp
(MC-Data)/Data (%) Pythia6 AMBT1 Pythia6 MC09 Pythia6 Perugia 2010 Herwig+Jimmy Herwig++ 2.4.2 Herwig++ 2.5.1 Sherpa Pythia8 8.145 4C Total Uncertainty ATLAS = 7 TeV s -1 L dt = 36 pb∫
Fig. 13. The ratio of f (prel
T ) predicted by various Monte Carlo generators to that measured. The gray band indicates the
8 Conclusion
A measurement of the jet fragmentation properties for charged particles in proton-proton collisions at a center-of-mass energy of 7 TeV is presented. The dataset recorded with the ATLAS detector at the LHC in 2010 with an integrated luminosity of 36 pb−1 is used. Systematic
un-certainties for the fragmentation function which describes how the jet momentum is distributed amongst its con-stituents vary between approximately 4% and 40% de-pending on z and pT jet. The uncertainties increase strongly
with z and are largest at small pT jet. The measurements
of the distributions ρch(r, pT jet) and f (prelT , pT jet) which
describe the shape of jets transverse to the jet direction have uncertainties that fall as pT jet increases, increase at
large values of prel
T and are almost independent of r. They
are less than 5% except in the lowest pT jet range and for
prel
T > 1 GeV.
The measurements are sensitive to several properties of QCD as implemented in and modeled by Monte Carlo event generators. The additional QCD radiation present
as pT jetincreases is modeled by perturbative QCD and
re-sults in a growth of the particle multiplicity. This growth is very well modeled by all the Monte Carlo generators used here. Two other effects that cannot be described by per-turbative QCD impact the measured distributions. The hadronization of partons produced in a QCD radiative shower into the observed hadrons must be modeled in the Monte Carlo generators and is described by a large num-ber of parameters which are tuned to agree with data. Particles produced from remnants of the initial protons (underlying event) can be incorporated into jets whose constituents mainly come from the hard scattering, so the measured jet properties can be sensitive to this modeling. The measured fragmentation functions agree well with the AMBT1 Pythia and Perugia2010 Monte Carlo pre-dictions within statistical and systematic uncertainties. Other tunes and generators show less good agreement indicating that the non-perturbative physics is not ad-equately modeled in these cases. Measurements of the transverse distributions f (prel
T , pT jet) and ρch(r, pT jet) are
also presented. For the prel
T distribution, none of the
gener-ators agree with data within systematic uncertainties over the full kinematic range. For the ρch(r, pT jet) distribution,
Herwig+Jimmy, Pythia MC09 and Perugia2010 are in reasonable agreement with the data.
In summary, none of the Monte Carlo generators stud-ied provide a good description of all the data. The mea-surements presented here provide valuable inputs to con-strain future improvements in Monte Carlo modeling of fragmentation. The full results are available in the HEP-DATA database [46], and a Rivet [47] module for the anal-ysis is also available.
9 Acknowledgments
We honour the memory of our young colleague Christoph Ruwiedel, who was closely involved in the work described
> rel T <p 0.4 0.5 0.6 0.7 0.8 0.9 1
1.1 DataPythia6 AMBT1 Pythia6 MC09 Pythia6 Perugia 2010 Herwig+Jimmy Herwig++ 2.4.2 Herwig++ 2.5.1 Sherpa Pythia8 8.145 4C ATLAS = 7 TeV s -1 L dt = 36 pb
∫
(GeV) T jet p 30 40 50 102 2×10² (MC-Data)/Data (%) -15 -10-5 0 5 10 15 (GeV) T jet p 30 40 50 102 2×10² (MC-Data)/Data (%) -15 -10-5 0 5 10 15Fig. 14. Comparison of the measured value of the average value of prel
T as a function of pT jet with various Monte Carlo
expectations.
here and died shortly before its completion. We thank CERN for the very successful operation of the LHC, as well as the support staff from our institutions without whom ATLAS could not be operated efficiently.
We acknowledge the support of ANPCyT, Argentina; YerPhI, Armenia; ARC, Australia; BMWF, Austria; ANAS, Azerbaijan; SSTC, Belarus; CNPq and FAPESP, Brazil; NSERC, NRC and CFI, Canada; CERN; CONICYT, Chile; CAS, MOST and NSFC, China; COLCIENCIAS, Colom-bia; MSMT CR, MPO CR and VSC CR, Czech Repub-lic; DNRF, DNSRC and Lundbeck Foundation, Denmark; ARTEMIS, European Union; IN2P3-CNRS, CEA-DSM/IRFU, France; GNAS, Georgia; BMBF, DFG, HGF, MPG and AvH Foundation, Germany; GSRT, Greece; ISF, MIN-ERVA, GIF, DIP and Benoziyo Center, Israel; INFN, Italy; MEXT and JSPS, Japan; CNRST, Morocco; FOM and NWO, Netherlands; RCN, Norway; MNiSW, Poland; GRICES and FCT, Portugal; MERYS (MECTS), Romania; MES of Russia and ROSATOM, Russian Federation; JINR; MSTD, Serbia; MSSR, Slovakia; ARRS and MVZT, Slovenia; DST/NRF, South Africa; MICINN, Spain; SRC and Wallenberg Foun-dation, Sweden; SER, SNSF and Cantons of Bern and Geneva, Switzerland; NSC, Taiwan; TAEK, Turkey; STFC, the Royal Society and Leverhulme Trust, United King-dom; DOE and NSF, United States of America.
The crucial computing support from all WLCG part-ners is acknowledged gratefully, in particular from CERN and the ATLAS Tier-1 facilities at TRIUMF (Canada), NDGF (Denmark, Norway, Sweden), CC-IN2P3 (France),
KIT/GridKA (Germany), INFN-CNAF (Italy), NL-T1 (Nether-lands), PIC (Spain), ASGC (Taiwan), RAL (UK) and BNL (USA) and in the Tier-2 facilities worldwide.
References
1. V.N. Gribov and L.N. Lipatov, Sov. J. Nucl. Phys. 15 (1972) 675–684
2. G. Altarelli and G.Parisi, Nucl. Phys. B126 (1977) 298 3. Y.L Dokshitzer, Sov. Phys. JETP 46 (1977) 641–653 4. H. Georgi and H.D. Politzer, Nucl. Phys. B136 (1978) 445 5. J.F. Owens, Phys. Lett. B76 (1978) 85
6. T. Uematsu, Phys. Lett. B79 (1978) 97
7. T. Sj¨ostrand, S. Mrenna and P.Z. Skands, JHEP 05 (2006) 026
8. K. Nakamura et al.(Particle Data Group), J. Phys. G37 (2010) 075021
9. A.H. Mueller, Phys. Lett. B104 (1981) 161–164 10. G. Corcella et al., JHEP 01 (2001) 010
11. The ATLAS Collaboration, Properties of jets from tracks in proton-proton collisions at center-of-mass energy√s = 7 TeV with the ATLAS detector, CERN-PH-EP-2011-110, accepted by Phys. Rev. D, 2011
12. The OPAL Collaboration, Z. Phys. C68 (1995) 203–214 13. The DELPHI Collaboration, Z. Phys. C73 (1996) 11–60 14. The ALEPH Collaboration, Phys. Lett. B357 (1995) 487–
499
15. P. M¨attig, Phys. Rept. 177 (1989) 141
16. G. Arnison et al., Phys. Lett. B132 (1983) 223
17. The CDF Collaboration, Phys. Rev. Lett. 65 (1990) 968– 971
18. ZEUS Collaboration, Phys. Lett. B414 (1997) 428–443 19. H1 Collaboration, Phys. Lett. B654 (2007) 148–159 20. The ATLAS Collaboration, JINST 3 (2008) S08003 21. The ATLAS Collaboration, Jet energy scale and its
sys-tematic uncertainty in proton-proton collisions at √s = 7 TeV with ATLAS 2010 data , ATLAS-CONF-2011-032 https://cdsweb.cern.ch/record/1337782
22. The ATLAS Collaboration, Eur. Phys. J. C 71 (2011) 1512
23. The ATLAS Collaboration, Eur. Phys. J C 70 (2010) 823– 874
24. GEANT4 Collaboration, S. Agostinelli et al., Nucl. Instr. Meth. A506 (2003) 250–303
25. A. Sherstnev and R.S. Thorne, Eur. Phys. J. C55 (2008) 553–575
26. The ATLAS Collaboration, New J. Phys. 13 (2011) 053033 27. P.Z. Skands, Phys. Rev. D82 (2010) 074018
28. J. Pumplin et al., JHEP 07 (2002) 012
29. J.M. Butterworth, J.R. Forshaw and M.H. Seymour, Z. Phys. C72 (1996) 637–646
30. M. Bahr et al., Eur. Phys. J. C58 (2008) 639–707 31. The ATLAS Collaboration, ATLAS Monte Carlo tunes
for MC09, ATL-PHYS-PUB-2010-002
http://cdsweb.cern.ch/record/1247375/files/ATL-PHYS-PUB-2010-002.pdf 32. S. Gieseke et al., Herwig++ 2.5 Release Note, 2011
33. T. Gleisberg et al., JHEP 02 (2009) 007
34. J. Pumplin, A. Belyaev, J. Huston, D. Stump and W.K. and Tung, JHEP 02 (2006) 032
35. T. Sj¨ostrand, S. Mrenna and P.Z. Skands, Comput. Phys. Commun. 178 (2008) 852–867
36. M. Cacciari, G.P. Salam and G. Soyez, JHEP 04 (2008) 063
37. M. Cacciari and G.P. Salam, Phys. Lett. B 641 (2006) 057 38. W. Lampl, et. al, Calorimeter clustering algorithms:
De-scription and performance, ATL-LARG-PUB-2008-002 https://cdsweb.cern.ch/record/1099735
39. G. D’Agostini, Nucl. Instrum. Meth. A362 (1995) 487–498 40. T. Adye, RooUnfold: unfolding framework and algorithms, presentations to the Oxford and RAL ATLAS Groups May 2008
http://hepunx.rl.ac.uk/∼adye/talks/080520-unfold.pdf
41. The ATLAS Collaboration, Jet energy resolution and re-construction efficiencies from in-situ techniques with the ATLAS Detector Using Proton-Proton Collisions at a Cen-ter of Mass Energy√s = 7 TeV, ATLAS-CONF-2010-054 42. The ATLAS Collaboration, New J. Phys. 13 (2011) 053033 43. The ATLAS Collaboration, Muon Momentum Resolution in First Pass Reconstruction of pp Collision Data Recorded by ATLAS in 2010, ATLAS-CONF-2011-003
http://cdsweb.cern.ch/record/1322424
44. The ATLAS Collaboration, ATLAS Calorimeter Response to Single Isolated Hadrons and Estimation of the Calorime-ter Jet Scale Uncertainty, ATLAS-CONF-2011-028 http://cdsweb.cern.ch/record/1337075
45. B. Efron, Annals of Statistics 7 (1979) 1
46. A. Buckley and M. Whalley, PoS ACAT2010 (2010) 067 47. A. Buckley et al., arXiv: 1003.0694 (2010).
The ATLAS Collaboration
G. Aad48, B. Abbott111, J. Abdallah11, A.A. Abdelalim49, A. Abdesselam118, O. Abdinov10, B. Abi112,
M. Abolins88, H. Abramowicz153, H. Abreu115, E. Acerbi89a,89b, B.S. Acharya164a,164b, D.L. Adams24, T.N. Addy56,
J. Adelman175, M. Aderholz99, S. Adomeit98, P. Adragna75, T. Adye129, S. Aefsky22, J.A. Aguilar-Saavedra124b,a,
M. Aharrouche81, S.P. Ahlen21, F. Ahles48, A. Ahmad148, M. Ahsan40, G. Aielli133a,133b, T. Akdogan18a,
T.P.A. ˚Akesson79, G. Akimoto155, A.V. Akimov94, A. Akiyama67, M.S. Alam1, M.A. Alam76, J. Albert169,
S. Albrand55, M. Aleksa29, I.N. Aleksandrov65, F. Alessandria89a, C. Alexa25a, G. Alexander153, G. Alexandre49,
T. Alexopoulos9, M. Alhroob20, M. Aliev15, G. Alimonti89a, J. Alison120, M. Aliyev10, P.P. Allport73,
S.E. Allwood-Spiers53, J. Almond82, A. Aloisio102a,102b, R. Alon171, A. Alonso79, M.G. Alviggi102a,102b, K. Amako66, P. Amaral29, C. Amelung22, V.V. Ammosov128, A. Amorim124a,b, G. Amor´os167, N. Amram153, C. Anastopoulos29,
L.S. Ancu16, N. Andari115, T. Andeen34, C.F. Anders20, G. Anders58a, K.J. Anderson30, A. Andreazza89a,89b,
V. Andrei58a, M-L. Andrieux55, X.S. Anduaga70, A. Angerami34, F. Anghinolfi29, N. Anjos124a, A. Annovi47,
A. Antonaki8, M. Antonelli47, A. Antonov96, J. Antos144b, F. Anulli132a, S. Aoun83, L. Aperio Bella4, R. Apolle118,c,
G. Arabidze88, I. Aracena143, Y. Arai66, A.T.H. Arce44, J.P. Archambault28, S. Arfaoui29,d, J-F. Arguin14,
E. Arik18a,∗, M. Arik18a, A.J. Armbruster87, O. Arnaez81, C. Arnault115, A. Artamonov95, G. Artoni132a,132b,
D. Arutinov20, S. Asai155, R. Asfandiyarov172, S. Ask27, B. ˚Asman146a,146b, L. Asquith5, K. Assamagan24,
A. Astbury169, A. Astvatsatourov52, G. Atoian175, B. Aubert4, E. Auge115, K. Augsten127, M. Aurousseau145a,
N. Austin73, G. Avolio163, R. Avramidou9, D. Axen168, C. Ay54, G. Azuelos93,e, Y. Azuma155, M.A. Baak29,
G. Baccaglioni89a, C. Bacci134a,134b, A.M. Bach14, H. Bachacou136, K. Bachas29, G. Bachy29, M. Backes49,
M. Backhaus20, E. Badescu25a, P. Bagnaia132a,132b, S. Bahinipati2, Y. Bai32a, D.C. Bailey158, T. Bain158,
J.T. Baines129, O.K. Baker175, M.D. Baker24, S. Baker77, E. Banas38, P. Banerjee93, Sw. Banerjee172, D. Banfi29,
A. Bangert137, V. Bansal169, H.S. Bansil17, L. Barak171, S.P. Baranov94, A. Barashkou65, A. Barbaro Galtieri14,
T. Barber27, E.L. Barberio86, D. Barberis50a,50b, M. Barbero20, D.Y. Bardin65, T. Barillari99, M. Barisonzi174,
T. Barklow143, N. Barlow27, B.M. Barnett129, R.M. Barnett14, A. Baroncelli134a, G. Barone49, A.J. Barr118,
F. Barreiro80, J. Barreiro Guimar˜aes da Costa57, P. Barrillon115, R. Bartoldus143, A.E. Barton71, D. Bartsch20,
V. Bartsch149, R.L. Bates53, L. Batkova144a, J.R. Batley27, A. Battaglia16, M. Battistin29, G. Battistoni89a,
F. Bauer136, H.S. Bawa143,f, B. Beare158, T. Beau78, P.H. Beauchemin118, R. Beccherle50a, P. Bechtle41,
H.P. Beck16, M. Beckingham48, K.H. Becks174, A.J. Beddall18c, A. Beddall18c, S. Bedikian175, V.A. Bednyakov65,
C.P. Bee83, M. Begel24, S. Behar Harpaz152, P.K. Behera63, M. Beimforde99, C. Belanger-Champagne85, P.J. Bell49,
W.H. Bell49, G. Bella153, L. Bellagamba19a, F. Bellina29, M. Bellomo29, A. Belloni57, O. Beloborodova107,
K. Belotskiy96, O. Beltramello29, S. Ben Ami152, O. Benary153, D. Benchekroun135a, C. Benchouk83, M. Bendel81,
N. Benekos165, Y. Benhammou153, D.P. Benjamin44, M. Benoit115, J.R. Bensinger22, K. Benslama130,
S. Bentvelsen105, D. Berge29, E. Bergeaas Kuutmann41, N. Berger4, F. Berghaus169, E. Berglund49, J. Beringer14,
K. Bernardet83, P. Bernat77, R. Bernhard48, C. Bernius24, T. Berry76, A. Bertin19a,19b, F. Bertinelli29,
F. Bertolucci122a,122b, M.I. Besana89a,89b, N. Besson136, S. Bethke99, W. Bhimji45, R.M. Bianchi29, M. Bianco72a,72b,
O. Biebel98, S.P. Bieniek77, K. Bierwagen54, J. Biesiada14, M. Biglietti134a,134b, H. Bilokon47, M. Bindi19a,19b,
S. Binet115, A. Bingul18c, C. Bini132a,132b, C. Biscarat177, U. Bitenc48, K.M. Black21, R.E. Blair5, J.-B. Blanchard115, G. Blanchot29, T. Blazek144a, C. Blocker22, J. Blocki38, A. Blondel49, W. Blum81, U. Blumenschein54,
G.J. Bobbink105, V.B. Bobrovnikov107, S.S. Bocchetta79, A. Bocci44, C.R. Boddy118, M. Boehler41, J. Boek174,
N. Boelaert35, S. B¨oser77, J.A. Bogaerts29, A. Bogdanchikov107, A. Bogouch90,∗, C. Bohm146a, V. Boisvert76,
T. Bold163,g, V. Boldea25a, N.M. Bolnet136, M. Bona75, V.G. Bondarenko96, M. Bondioli163, M. Boonekamp136,
G. Boorman76, C.N. Booth139, S. Bordoni78, C. Borer16, A. Borisov128, G. Borissov71, I. Borjanovic12a, S. Borroni87,
K. Bos105, D. Boscherini19a, M. Bosman11, H. Boterenbrood105, D. Botterill129, J. Bouchami93, J. Boudreau123,
E.V. Bouhova-Thacker71, C. Bourdarios115, N. Bousson83, A. Boveia30, J. Boyd29, I.R. Boyko65, N.I. Bozhko128,
I. Bozovic-Jelisavcic12b, J. Bracinik17, A. Braem29, P. Branchini134a, G.W. Brandenburg57, A. Brandt7, G. Brandt15,
O. Brandt54, U. Bratzler156, B. Brau84, J.E. Brau114, H.M. Braun174, B. Brelier158, J. Bremer29, R. Brenner166,
S. Bressler152, D. Breton115, D. Britton53, F.M. Brochu27, I. Brock20, R. Brock88, T.J. Brodbeck71, E. Brodet153,
F. Broggi89a, C. Bromberg88, G. Brooijmans34, W.K. Brooks31b, G. Brown82, H. Brown7,
P.A. Bruckman de Renstrom38, D. Bruncko144b, R. Bruneliere48, S. Brunet61, A. Bruni19a, G. Bruni19a,
M. Bruschi19a, T. Buanes13, F. Bucci49, J. Buchanan118, N.J. Buchanan2, P. Buchholz141, R.M. Buckingham118,
A.G. Buckley45, S.I. Buda25a, I.A. Budagov65, B. Budick108, V. B¨uscher81, L. Bugge117, D. Buira-Clark118,
O. Bulekov96, M. Bunse42, T. Buran117, H. Burckhart29, S. Burdin73, T. Burgess13, S. Burke129, E. Busato33,
P. Bussey53, C.P. Buszello166, F. Butin29, B. Butler143, J.M. Butler21, C.M. Buttar53, J.M. Butterworth77,
W. Buttinger27, S. Cabrera Urb´an167, D. Caforio19a,19b, O. Cakir3a, P. Calafiura14, G. Calderini78, P. Calfayan98,
R. Calkins106, L.P. Caloba23a, R. Caloi132a,132b, D. Calvet33, S. Calvet33, R. Camacho Toro33, P. Camarri133a,133b,
M. Cambiaghi119a,119b, D. Cameron117, S. Campana29, M. Campanelli77, V. Canale102a,102b, F. Canelli30,h, A. Canepa159a, J. Cantero80, L. Capasso102a,102b, M.D.M. Capeans Garrido29, I. Caprini25a, M. Caprini25a,
D. Capriotti99, M. Capua36a,36b, R. Caputo148, R. Cardarelli133a, T. Carli29, G. Carlino102a, L. Carminati89a,89b,
M.P. Casado11, M. Cascella122a,122b, C. Caso50a,50b,∗, A.M. Castaneda Hernandez172, E. Castaneda-Miranda172,
V. Castillo Gimenez167, N.F. Castro124a, G. Cataldi72a, F. Cataneo29, A. Catinaccio29, J.R. Catmore71, A. Cattai29, G. Cattani133a,133b, S. Caughron88, D. Cauz164a,164c, P. Cavalleri78, D. Cavalli89a, M. Cavalli-Sforza11,
V. Cavasinni122a,122b, F. Ceradini134a,134b, A.S. Cerqueira23a, A. Cerri29, L. Cerrito75, F. Cerutti47, S.A. Cetin18b,
F. Cevenini102a,102b, A. Chafaq135a, D. Chakraborty106, K. Chan2, B. Chapleau85, J.D. Chapman27,
J.W. Chapman87, E. Chareyre78, D.G. Charlton17, V. Chavda82, C.A. Chavez Barajas29, S. Cheatham85,
S. Chekanov5, S.V. Chekulaev159a, G.A. Chelkov65, M.A. Chelstowska104, C. Chen64, H. Chen24, S. Chen32c,
T. Chen32c, X. Chen172, S. Cheng32a, A. Cheplakov65, V.F. Chepurnov65, R. Cherkaoui El Moursli135e,
V. Chernyatin24, E. Cheu6, S.L. Cheung158, L. Chevalier136, G. Chiefari102a,102b, L. Chikovani51a, J.T. Childers58a,
A. Chilingarov71, G. Chiodini72a, M.V. Chizhov65, G. Choudalakis30, S. Chouridou137, I.A. Christidi77,
A. Christov48, D. Chromek-Burckhart29, M.L. Chu151, J. Chudoba125, G. Ciapetti132a,132b, K. Ciba37, A.K. Ciftci3a, R. Ciftci3a, D. Cinca33, V. Cindro74, M.D. Ciobotaru163, C. Ciocca19a,19b, A. Ciocio14, M. Cirilli87,
M. Ciubancan25a, A. Clark49, P.J. Clark45, W. Cleland123, J.C. Clemens83, B. Clement55, C. Clement146a,146b,
R.W. Clifft129, Y. Coadou83, M. Cobal164a,164c, A. Coccaro50a,50b, J. Cochran64, P. Coe118, J.G. Cogan143,
J. Coggeshall165, E. Cogneras177, C.D. Cojocaru28, J. Colas4, A.P. Colijn105, C. Collard115, N.J. Collins17,
C. Collins-Tooth53, J. Collot55, G. Colon84, P. Conde Mui˜no124a, E. Coniavitis118, M.C. Conidi11, M. Consonni104,
V. Consorti48, S. Constantinescu25a, C. Conta119a,119b, F. Conventi102a,j, J. Cook29, M. Cooke14, B.D. Cooper77,
A.M. Cooper-Sarkar118, N.J. Cooper-Smith76, K. Copic34, T. Cornelissen50a,50b, M. Corradi19a, F. Corriveau85,k,
A. Cortes-Gonzalez165, G. Cortiana99, G. Costa89a, M.J. Costa167, D. Costanzo139, T. Costin30, D. Cˆot´e29,
L. Courneyea169, G. Cowan76, C. Cowden27, B.E. Cox82, K. Cranmer108, F. Crescioli122a,122b, M. Cristinziani20,
G. Crosetti36a,36b, R. Crupi72a,72b, S. Cr´ep´e-Renaudin55, C.-M. Cuciuc25a, C. Cuenca Almenar175,
T. Cuhadar Donszelmann139, M. Curatolo47, C.J. Curtis17, P. Cwetanski61, H. Czirr141, Z. Czyczula175,
S. D’Auria53, M. D’Onofrio73, A. D’Orazio132a,132b, P.V.M. Da Silva23a, C. Da Via82, W. Dabrowski37, T. Dai87,
C. Dallapiccola84, M. Dam35, M. Dameri50a,50b, D.S. Damiani137, H.O. Danielsson29, D. Dannheim99, V. Dao49,
G. Darbo50a, G.L. Darlea25b, C. Daum105, J.P. Dauvergne29, W. Davey86, T. Davidek126, N. Davidson86,
R. Davidson71, E. Davies118,c, M. Davies93, A.R. Davison77, Y. Davygora58a, E. Dawe142, I. Dawson139,
J.W. Dawson5,∗, R.K. Daya39, K. De7, R. de Asmundis102a, S. De Castro19a,19b, P.E. De Castro Faria Salgado24,
S. De Cecco78, J. de Graat98, N. De Groot104, P. de Jong105, C. De La Taille115, H. De la Torre80,
B. De Lotto164a,164c, L. De Mora71, L. De Nooij105, D. De Pedis132a, A. De Salvo132a, U. De Sanctis164a,164c,
A. De Santo149, J.B. De Vivie De Regie115, S. Dean77, R. Debbe24, D.V. Dedovich65, J. Degenhardt120,
M. Dehchar118, C. Del Papa164a,164c, J. Del Peso80, T. Del Prete122a,122b, M. Deliyergiyev74, A. Dell’Acqua29,
L. Dell’Asta89a,89b, M. Della Pietra102a,j, D. della Volpe102a,102b, M. Delmastro29, P. Delpierre83, N. Delruelle29,
P.A. Delsart55, C. Deluca148, S. Demers175, M. Demichev65, B. Demirkoz11,l, J. Deng163, S.P. Denisov128,
D. Derendarz38, J.E. Derkaoui135d, F. Derue78, P. Dervan73, K. Desch20, E. Devetak148, P.O. Deviveiros158,
A. Dewhurst129, B. DeWilde148, S. Dhaliwal158, R. Dhullipudi24,m, A. Di Ciaccio133a,133b, L. Di Ciaccio4,
A. Di Girolamo29, B. Di Girolamo29, S. Di Luise134a,134b, A. Di Mattia88, B. Di Micco29, R. Di Nardo133a,133b,
A. Di Simone133a,133b, R. Di Sipio19a,19b, M.A. Diaz31a, F. Diblen18c, E.B. Diehl87, J. Dietrich41, T.A. Dietzsch58a,
S. Diglio115, K. Dindar Yagci39, J. Dingfelder20, C. Dionisi132a,132b, P. Dita25a, S. Dita25a, F. Dittus29, F. Djama83,
T. Djobava51b, M.A.B. do Vale23a, A. Do Valle Wemans124a, T.K.O. Doan4, M. Dobbs85, R. Dobinson29,∗,
D. Dobos29, E. Dobson29, M. Dobson163, J. Dodd34, C. Doglioni118, T. Doherty53, Y. Doi66,∗, J. Dolejsi126,
I. Dolenc74, Z. Dolezal126, B.A. Dolgoshein96,∗, T. Dohmae155, M. Donadelli23d, M. Donega120, J. Donini55,
J. Dopke29, A. Doria102a, A. Dos Anjos172, M. Dosil11, A. Dotti122a,122b, M.T. Dova70, J.D. Dowell17,
A.D. Doxiadis105, A.T. Doyle53, Z. Drasal126, J. Drees174, N. Dressnandt120, H. Drevermann29, C. Driouichi35,
M. Dris9, J. Dubbert99, T. Dubbs137, S. Dube14, E. Duchovni171, G. Duckeck98, A. Dudarev29, F. Dudziak64,
M. D¨uhrssen 29, I.P. Duerdoth82, L. Duflot115, M-A. Dufour85, M. Dunford29, H. Duran Yildiz3b, R. Duxfield139,
M. Dwuznik37, F. Dydak29, M. D¨uren52, W.L. Ebenstein44, J. Ebke98, S. Eckert48, S. Eckweiler81, K. Edmonds81,
C.A. Edwards76, N.C. Edwards53, W. Ehrenfeld41, T. Ehrich99, T. Eifert29, G. Eigen13, K. Einsweiler14,
E. Eisenhandler75, T. Ekelof166, M. El Kacimi135c, M. Ellert166, S. Elles4, F. Ellinghaus81, K. Ellis75, N. Ellis29,
J. Elmsheuser98, M. Elsing29, D. Emeliyanov129, R. Engelmann148, A. Engl98, B. Epp62, A. Eppig87, J. Erdmann54, A. Ereditato16, D. Eriksson146a, J. Ernst1, M. Ernst24, J. Ernwein136, D. Errede165, S. Errede165, E. Ertel81,
M. Escalier115, C. Escobar123, X. Espinal Curull11, B. Esposito47, F. Etienne83, A.I. Etienvre136, E. Etzion153,
D. Evangelakou54, H. Evans61, L. Fabbri19a,19b, C. Fabre29, R.M. Fakhrutdinov128, S. Falciano132a, Y. Fang172,
M. Fanti89a,89b, A. Farbin7, A. Farilla134a, J. Farley148, T. Farooque158, S.M. Farrington118, P. Farthouat29,
P. Fassnacht29, D. Fassouliotis8, B. Fatholahzadeh158, A. Favareto89a,89b, L. Fayard115, S. Fazio36a,36b,
R. Febbraro33, P. Federic144a, O.L. Fedin121, W. Fedorko88, M. Fehling-Kaschek48, L. Feligioni83, D. Fellmann5,
C.U. Felzmann86, C. Feng32d, E.J. Feng30, A.B. Fenyuk128, J. Ferencei144b, J. Ferland93, W. Fernando109,
S. Ferrag53, J. Ferrando53, V. Ferrara41, A. Ferrari166, P. Ferrari105, R. Ferrari119a, A. Ferrer167, M.L. Ferrer47,
D. Ferrere49, C. Ferretti87, A. Ferretto Parodi50a,50b, M. Fiascaris30, F. Fiedler81, A. Filipˇciˇc74, A. Filippas9,