Publisher’s version / Version de l'éditeur:
Industrial Robot Journal, 32, May 3, pp. 240-247, 2005-05-01
READ THESE TERMS AND CONDITIONS CAREFULLY BEFORE USING THIS WEBSITE.
https://nrc-publications.canada.ca/eng/copyright
Vous avez des questions? Nous pouvons vous aider. Pour communiquer directement avec un auteur, consultez la
première page de la revue dans laquelle son article a été publié afin de trouver ses coordonnées. Si vous n’arrivez pas à les repérer, communiquez avec nous à PublicationsArchive-ArchivesPublications@nrc-cnrc.gc.ca.
Questions? Contact the NRC Publications Archive team at
PublicationsArchive-ArchivesPublications@nrc-cnrc.gc.ca. If you wish to email the authors directly, please see the first page of the publication for their contact information.
NRC Publications Archive
Archives des publications du CNRC
This publication could be one of several versions: author’s original, accepted manuscript or the publisher’s version. / La version de cette publication peut être l’une des suivantes : la version prépublication de l’auteur, la version acceptée du manuscrit ou la version de l’éditeur.
For the publisher’s version, please access the DOI link below./ Pour consulter la version de l’éditeur, utilisez le lien DOI ci-dessous.
https://doi.org/10.1108/01439910510593938
Access and use of this website and the material on it are subject to the Terms and Conditions set forth at
Landmine detection using an autonomous terrain-scanning robot
Najjaran, H.; Goldenberg, A.
https://publications-cnrc.canada.ca/fra/droits
L’accès à ce site Web et l’utilisation de son contenu sont assujettis aux conditions présentées dans le site LISEZ CES CONDITIONS ATTENTIVEMENT AVANT D’UTILISER CE SITE WEB.
NRC Publications Record / Notice d'Archives des publications de CNRC:
https://nrc-publications.canada.ca/eng/view/object/?id=b8e61c66-ca46-4e58-b9d4-5c48b9c62fed https://publications-cnrc.canada.ca/fra/voir/objet/?id=b8e61c66-ca46-4e58-b9d4-5c48b9c62fed
Landmine detection using an autonomous
terrain-scanning robot
Najjaran, H.; Goldenberg, A.A.
NRCC-46424
A version of this document is published in / Une version de ce document se trouve dans :
Industrial Robot Journal, v. 32, no. 3, 2005, pp. 240-247
Doi:
10.1108/01439910510593938
Landmine Detection Using an Autonomous Terrain Scanning Robot
H. Najjaran, N. Kircanski, A. A. Goldenberg
Abstract
This paper describes the software of a terrain scanning robot capable of autonomously manipulating a typical handheld detector for remote sensing of buried landmines in a manner similar to a human operator. The autonomous manipulation of the detector on unknown terrain requires an online terrain map to generate an obstacle free path for the end effector of the robot. The software includes a twofold process of map building and path planning that is implemented into a real-time software platform to take place in parallel to the other functions of the robot.
Map building features a distributed sensor fusion system to tackle the uncertainties associated with the sensor data. It provides local terrain maps by fusing the redundant measurements and complementary data obtained from competitive rangefinders and joint position sensors, respectively. The fusion takes place in a multi-step data processing module that includes a batch processing filter, a static filter, and a fuzzy adaptive Kalman filter. The latter requires the dynamic model of the process so that a stochastic model is introduced for the terrain undulations. An important parameter of the model, which significantly influences the output of the filter, is the standard deviation of the probability distribution of the process disturbances. A systematic fuzzy modeling technique is used to determine the standard deviation based on the terrain type and to adapt the filter, accordingly. The outlier rejection is carried out using the Mahalanobis distance between the estimated states of the system and the new measurements.
Path planning is carried out based on the terrain map to move the detector at a constant distance and parallel to the ground. Unlike the traditional methods, the path is generated in the non-Cartesian coordinate frame of the sensors to avoid a great deal of transformations involved in reproducing the terrain map in a Cartesian coordinate frame.
Keywords: Mine detection, autonomous mobile manipulator, terrain scanning, range image, map building, path planning, dynamic modeling, fuzzy terrain typing, and fuzzy adaptive Kalman filter
1 Introduction
In recent years, the significance of low cost and sustainable technologies for mine detection and mine neutralization has been increasingly recognized by many organizations and universities in different countries. The current solution for removing landmines from civilian areas is the use of trained technicians who manually search for buried objects using a prodder and a metal detector. This process is rather slow (20-50 square meters per hour), dangerous, and expensive; thus, investing in a mechanized solution will be both humane and economic. Since the risk of mine clearance missions is
primarily related to the lack of knowledge about the location of the mines, researchers have mostly focused on finding a mechanized solution for mine detection [1-4]. When the mines are located, neutralization may become a less hazardous procedure. Mine neutralization is outside the scope of this research.
There are two methods for detecting hidden landmines: prodding and remote sensing. In prodding, a probe is gently inserted into soil to examine the existence of a buried object. Although there have been several attempts to mechanize prodding, a practical solution is still unavailable. Dawson et al., propose the use of a sharpened probe but do not describe the approach in detail [5]. Shahri et al., describe a mechatronics solution for measuring the stiffness of soil using a bayonet attached to a dexterous manipulator [6]. The most recent work on this method proposes the use of a robot to insert a comblike series of ultrasonically vibrating probes into the soil [7]. The probes are in the form of hollow tubes that not only measure the stiffness of the soil but also scratch the surface of the buried objects and transfer the dust to a miniature onboard mass spectrometer to determine whether the surface is a plastic, metal, wood, or other material that can be used in landmines. Remote sensing is the other methodology in which the presence of an unexpected object on or underneath the surface is examined using sensors such as electromagnetic induction sensors (EMI) [8-10], X ray backscatter radiography [11], ground penetrating radar (GPR) [8,10,12], infrared cameras (IR) [13], and thermal neutron analyzers. Although prodding may yield more reliable results, remote sensing is considered more appropriate for robotics applications because it is significantly faster, safer, and more attainable. Meanwhile, the reliability of remote sensing may be improved by fusing synergistic measurements of different types of detectors [8,10,14,15].
Recent advances in the development of accurate and reliable sensors for mine detection are so promising that researchers have become interested in the development of unmanned ground vehicles and robotic systems that can carry the sensors with the minimum interaction of human operators. There are different system configurations available for both handheld and vehicle-mounted sensors. Typically, the vehicles are equipped with large GPR and IR systems and a series of metal detectors to search for antitank landmines buried in roads and broad fields [16]. These are usually used in military missions to provide a safe route through minefields. On the other hand, robots are more suitable for off-road missions and antipersonnel unexploded ordnance (UXO) detection. Specifically, robots are useful for civilian mine clearance missions whose reliability must be above 99.6% as defined in the UN agenda.
Manipulated by a robotic arm that is adequate in term of the degrees of freedom, one or a group of the sensors can precisely scan the terrain and provide sufficient information to determine the existence of an anomaly in the soil. Since most landmines are made of metal or at least have a piece
of metal (e.g., a detonator), metal detectors are commonly used to detect landmines. A metal detector is essentially a coil that generates a pulsing electromagnetic field and measures the eddy currents induced by a metal object moving in the field [17]. The performance and reliability of a metal detector, determined by signal to noise ratio, largely depends on the distance, orientation, size, and scanning speed of the sensor. Although other types of sensors may adopt different sensing methods, they all have common requirements, as far as the robotic manipulation is concerned. For example, a GPR consists of a radio transmitter and receiver that are connected to a pair of antennas coupled to the ground (host dirt). The transmitted signal penetrates to the ground and is reflected from any object that has different electromagnetic properties than the host dirt. The antennas are in the form of 25×25 cm plates that must face the ground for scanning [18]. Therefore, remote sensing requires a terrain scanning robot capable of moving relatively large sensors at a constant speed while maintaining the sensor at a constant distance from the ground and parallel to the surface (the detector plate normal must be parallel to the local terrain normal). Such manipulation in an unstructured environment can be a difficult task for a mobile robot.
This research has focused on the development of a generic algorithm for terrain modeling and path planning of a terrain scanning robot to carry out such manipulation autonomously and in real time. The result of the research has been implemented into a mine detector robot named MR-2 [1,19,20]. MR-2 is a dual-arm mobile manipulator capable of autonomously scanning unstructured terrain using a typical mine detector in a manner similar to a human operator. The mine detector closely follows terrain undulations using an articulated robotic arm mounted on a mobile robot platform. The autonomous motion may be synthesized based on a 3D model of the terrain that is developed in real time using rangefinders carried by another articulated arm, also mounted on the platform of the robot. MR-2 has been manufactured by Engineering Services Inc. (ESI) in a project supported by Defence R&D Canada-Suffield (DRDC Suffield).
This paper is organized as follows: the geometry of the robot is described in Section 2. The path planning and map building procedures of the robot are explained in Section 3 and Section 4, respectively. Finally, Section 5 concludes with a list of the achievements of this research and development project.
2
Terrain Scanning Robot
The robot is an off-road mobile manipulator that is used to scan unstructured terrain with vegetation, stones, and various obstacles and locate buried landmines using an off-the-shelf handheld mine detector such as a metal detector or GPR. It consists of a dual-arm manipulator and a teleopertaed mobile platform. The manipulator includes a mine detector (MD) arm that autonomously
manipulates a mine detector to follow the undulations of the terrain at a close distance (30-100 mm depending on the type of the mine detector). The autonomous scanning is provided by real-time path planning based on a terrain map. The map is generated online based on the range measurements acquired from a scanning laser rangefinder and two ultrasonic rangefinders. The rangefinders are mounted on the second arm (sensor arm) that moves on top of the MD arm. The manipulator is carried by a teleopertaed vehicle (Figure 1).
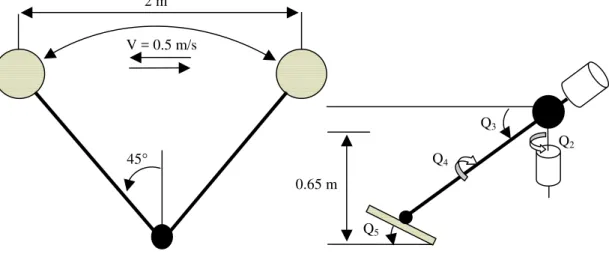
The MD arm is an articulated arm with five degrees of freedom. Four degrees of freedom are sufficient for moving the mine detector along an arc (i.e., a side-to-side scan) and maintaining it at a constant distance from the ground and parallel to the terrain profile. The fifth degree of freedom corresponds to a linear motion along the mobile platform in order to advance the arm when the platform is stationary. Figure 2 shows the top view and side view of the MD arm. The scanning speed of the MD arm remains constant during scanning, but it can be adjusted to maximize the performance of the mine detector. The maximum tracking error of manipulator is ±3 mm for a relatively smooth surface, but it may be increased for rugged terrain with sharp undulations.
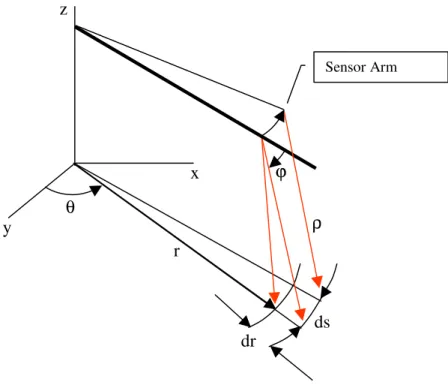
The sensor arm carries multiple rangefinders including a scanning laser rangefinder, two ultrasonic rangefinders mounted vertically, and two rangefinders mounted horizontally. The measurements of the latter are used to prevent the collision of the arms with side walls when the robot is scanning hallways and narrow passages. The laser rangefinder and the two vertical ultrasonic rangefinders measure the distance of the sensors from the ground. The measurements are fused to the coordinates of the sensors, obtained from the joint position sensors, to generate a raster range image that is the representation of the terrain in the sensor coordinate frame. The range image is then used to derive a terrain map that is a required for path planning and motion execution of the MD arm. The coordinates of the range image are shown in Figure 3, where
ρ
is the range value,θ
is the angular position of the sensor arm, andϕ
is the angular position of the mirror of the laser scanner.3 Path
planning
The autonomy of mobile robots and manipulators requires the computation of an obstacle free path that can lead the robot or its end effector to desired points in the task space. The path must satisfy the constraints imposed by the environment, physical requirements, hardware and software limitations, and more specific requirements such as a payload, speed, and acceleration. Path planning is a procedure to determine the desired joint coordinates of the robot when the end effector moves along a desired trajectory. The desired joint coordinates are used to define the set points for the motion controller of the robot.
Path planning in an unstructured environment is carried out based on the model of the environment. The model usually encompasses 3D representations of the obstacles and undulations of the task space. Specifically, the terrain scanning robot needs a 3D terrain map that represents the coordinates of the obstacles and terrain undulations. The terrain map may be generated either offline or online based on the information obtained from sensor data or interpretation procedures. An offline map can only include a priori information previously captured from the environment so that it lacks the spontaneous information required in modeling of the phenomena that change continuously. The problem will become more significant in natural environments where there is an extremely dynamic situation, due to the fact that not only does the robot move but also the environment is subject to change. Thus, the terrain scanning robot requires online map building that is capable of sensing the environment and updating the terrain map in real time.
Path planning begins with the determination of a path for the end effector, and then the paths of the other joints are determined based on the path of the end effector using the inverse kinematics method. The kinematics chain of the robot relates the coordinates of the end effector to the coordinates of the other joints, but a geometrical model of the end effector is required to relate the coordinates of the end effector to the terrain map. In other words, the model acts as an interface between the task space and robot joint space to transform the information required for the computation of the joint coordinates (Figure 4). This model should comply with the number of degrees of freedom of the robot. For example, the terrain scanning robot has five degrees of freedom, so the model of the end effector includes five coordinates (i.e., three positions and two orientations). The number of degrees of freedom of the terrain scanning robot is sufficient to maintain a plate (e.g., a metal detector) at a desired position and orientation.
Another important point is that the map and the model of the end effector must be expressed in a common coordinate frame. The choice of the coordinate frame is determined by considering the total processing load required for the transformations involved. Traditionally, the path is generated in Cartesian coordinate frame so that it requires an elevation map (i.e., a map represented a Cartesian coordinate frame). The derivation of the elevation map from a range image, represented in the sensor coordinate frame, involves nonlinear transformations and complicated algorithms that impact the efficiency of the terrain mapping and path planning procedures. In general terms, for an observer moving with the end effector, which is smaller than the scene of interest, it would be more efficient to transform the model of the end effector to the observer’s coordinate frame. In our approach, the model of the end effector is obtained in the image coordinate frame so that the terrain map and the range image are identical; and hence the coordinate transformation step is omitted. However, the
coordinates of the end effector must be defined in the image coordinate frame so that the conventional kinematics models cannot be used.
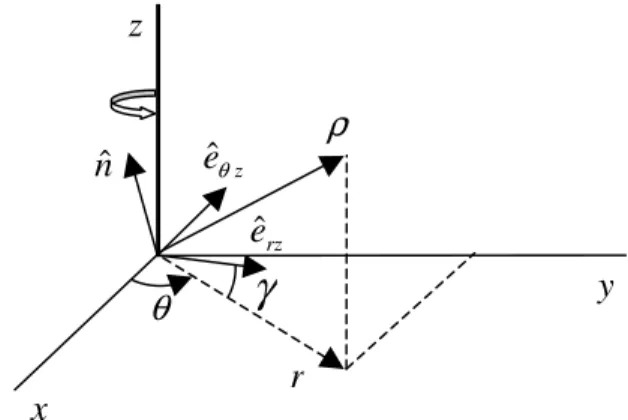
The end effector of the terrain scanning robot is a plate, so the position and orientation of the end effector can be specified by one point and two orthogonal vectors in the image coordinate frame. Since the image coordinate frame rotates with the sensor arm, it is proposed to use a pair of rotating orthogonal tangents (Figure 5). The range vector ρ and its projection onto the horizontal plane rr rotate about the z axis, and so do the tangent vectors eˆ and rz eˆθz. The tangent vector
eˆ
rz is definedin the rz plane and given by,
0 0 0 0 0 0 sin cos cos sin 0 ϕ ρ ϕ ϕ ρ ϕ ϕ ϕ= = a +− a dr dz (1) where ρ0 and ϕ ϕ ϕ0 ρ = = d d
a are the range and the rate of change of the range with respect to ϕ at the point of interest, respectively.
The other tangent vector eˆθz is perpendicular to
eˆ
rz and it is obtained from dz dθ that is calculated in the map filtering process explained in Section 4. The two tangent vectors eˆ and rz eˆθz can be directly obtained from the range image. The orientation of the local normal of the terrain is the cross product of the two tangent vectors, nˆ=eˆrz×eˆθz. The position and orientation of the detector plate are calculated such that the normal vector of the plate is aligned with the normal vector of the terrain, and then the joint coordinates of the robot are determined using the inverse kinematics method.4 Map
Building
Map building involves a dynamic modeling process to generate the terrain maps in real-time. A dynamic model is developed based on observations obtained instantaneously from either different sensing systems or different interpretation procedures. Thus, dynamic modeling may be defined as the process of maintaining a description of the external environment over time. Since, in practice, preparing a global model of the environment requires an extremely fast and complete sensing ability, it is usually preferable to build local models from a set of partial sources of information and integrate them into a dynamic model assuming that the environment can change slightly between two observations (i.e., relative continuity). A general framework for integrating the local observations into a dynamic model may include three phases: “predict”, “match”, and “update” [21]. First, the current state of the model is used to predict the state of the external world at the time when the next observation is acquired. Second, the predicted and observed states of the system are compared using
appropriate mathematical measures. Finally, the accepted observations are integrated to update the model.
The map building of the terrain scanning robot is a dynamic modeling process. It consists of image registration, map filtering, and outlier rejection. Image registration provides the local observations in the form of laser scan lines; map filtering updates the model of the terrain, and outlier rejection determines the discrepancy between the observation and the predicted states obtained from the updated model.
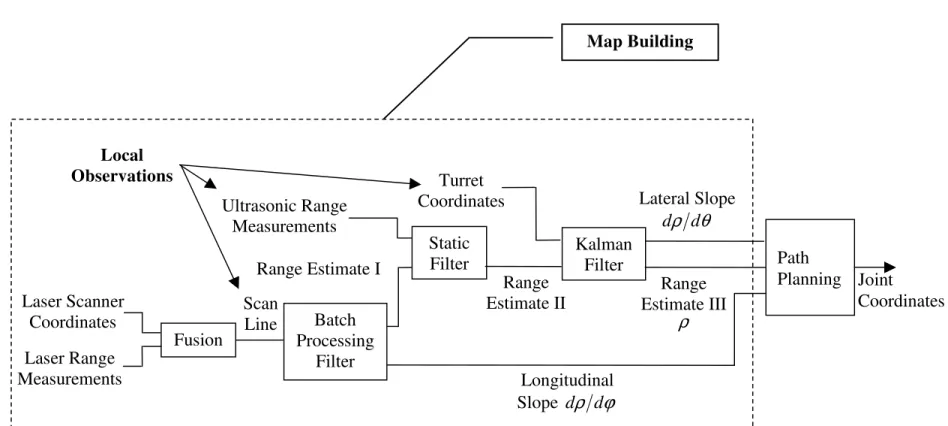
Figure 6 portrays the image registration and filtering of the map building process of the terrain scanning robot. The process features a real-time distributed sensor-fusion algorithm. Image registration produces the scan lines by acquiring and fusing the point coordinates obtained from complementary sensors, which are the rangefinders and joint position sensors. Map filtering integrates the scan lines into the terrain map overtime using a series of filters. Map filtering also fuses other local measurements including the ultrasonic range measurements and the turret angle at the time when the scan line is registered. Map filtering incorporates redundant data of multiple sensors to deal with the uncertainties associated with the sensor data and inexact modeling.
In order to test the significance of a new measurement, the distance between the measurement at position
θ
i and the predicted value is compared using a “test of hypothesis” such as Pitman’s closeness test. The simplest definition for the distance is taken from the Euclidean distance that is the straight distance between two quantities. Although the computation of the Euclidean distance is simple, it may not be sufficient for our application because the discrepancy between the measurements and the predicted values are naturally larger for a steep surface than a flat surface. Thus, the possibility of rejecting a true measurement (i.e., type II error) is rather high while using the Euclidian distance. Therefore, it is required to use a criterion that not only determines the discrepancy between the range measurements and the predicted values but also takes into account the characteristics of the terrain. The software of the terrain scanning robot uses the Mahalanobis distance [22-24] that is the distance between two quantities normalized with their error covariance.Image registration and map filtering are the main parts of the software, so they are elaborated in Section 4.1 and 4.2. Section 4.3 introduces another feature of the software, “a fuzzy adaptive Kalman filter” that enhances the performance and robustness of terrain tracking, significantly.
4.1 Image Registration
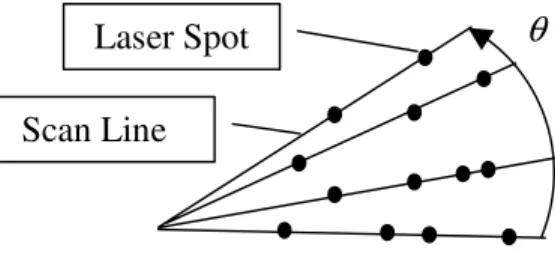
The range image is a 3D-raster image consisting of a number of laser spots located on several concentric scan lines (Figure 7). Each scan line is associated with an angular position of the sensor arm. Given the angular position of the sensor arm, each spot is specified by a laser mirror angle and a
range value. Neither the scan lines nor the spots are necessarily equidistant. The range is measured using an AMCW laser sensor that has been equipped with a rotating mirror for scanning. A DC motor rotates the mirror at 1000-2500 RPM, depending on the sampling rate of the rangefinder, and an optical encoder measures the mirror angle.
The coordinates of the spots and scan lines are stored in two databases called “Map-Data” and “Move-Table”, respectively. The former includes the range values and corresponding mirror angles of the spots. The latter memorizes the scan line data including the status of the data, time, joint coordinates at the time when the scan takes place, and the primary key of the “Move-Table” database, which is an index referring to the part of the “Map-Data” database that maintains the laser spots of the current scan line (Figure 8).
Figure 9 represents the flowchart of the image registration procedure. The image registration procedure involves the fusion of the range measurements acquired from a range sensing system and the corresponding coordinates of the sensing system. The range image is obtained with respect to the coordinate frame of the rangefinder that is usually a non-Cartesian coordinate frame (e.g., spherical, cylindrical, etc.). A range image may consist of several scan lines; however, the local range images are as concise as one scan line in the dynamic modeling process to allow the terrain scanning robot to operate in real time. Although it may not be used in the operation of the robot, buffering the local range images yields a global image that, when transformed into the Cartesian coordinate frame using the locus method [19,25], represents a useful 3D terrain map for visualization.
4.2 Map Filtering
Map filtering is a multiple step process to update the dynamic model of the terrain in real time. The main purpose of filtering is to obtain a better estimate of the states of the system based on a series of uncertain measurements acquired from different sensors and over time. Map filtering includes two types of data processing: batch processing and recursive processing. The distinction lies in the availability of the data in the measurement vector. In batch processing, the entire measurement vector is available and used in the estimation. In recursive processing, on the other hand, the estimate is updated based on the part of the measurement vector that is currently available, and then the process is repeated until all measurements are used. Map filtering is carried out in three steps:
1) A preliminary estimate of the range ρ and the longitudinal slope dρ dϕ (the change of the range with respect to the change of the scanning coordinate along the sensor arm) are obtained on a scan line. Since the data of a scan line is downloaded from the embedded memory of the sensor, all measurements are used by a batch processing estimator (i.e., the least squares method).
2) The measurements of two ultrasonic rangefinders are fused to the preliminary estimate of the range using a static filter provided that the probability distribution function of the laser and ultrasonic sensors are known. The optimal estimate of the range and the joint probability distribution of all measurements are obtained based on all data acquired from laser and ultrasonic rangefinders at the time when the scan line is obtained. The static filter can be used in a batch or recursive manner.
3) To this point, the states of the system are estimated statically, so the filters cannot maintain the history of the system and deal with the dynamic nature of the terrain scanning process. In other words, the estimation requires a stochastic process since the scene of interest as well as the states of the system change overtime. Thus, a Kalman filter is used to update the states of the system recursively, under the assumption that both the process and measurements are subjected to white noise. A Kalman filter requires a dynamic model of the system so a novel method for modeling the undulations of a surface is introduced. The model is a linear model that encompasses the range and lateral slope dρ dθ (i.e., the change of the range with respect to the change of the turret angle across the arm of the robot). The model can be decomposed to nominal and perturbation parts under the assumption of linearity. However, the perturbation of the model can be neglected if the filtering step size (i.e., the distance between two scan lines) is maintained infinitesimal.
Dynamic Model of the Terrain Undulations - To obtain a local model of terrain undulations, it is assumed that the range of a point on the terrain can change only slightly from one observation to the next provided that the observations are sufficiently close. It is also assumed that the position of the observer is a piecewise linear function of time (i.e., the observer travels at a constant velocity between two measurements). Thus, the difference equation (3.8) is attributable to the observer position θ instead of time.
Figure 10 shows the proposed model for the undulations of the terrain observed by a rangefinder. The range x1i at point P observed at position i θi is the range x1(i−1) of the adjacent point P i−1
observed at position θi−1 plus the change of the range due to the lateral slope x2(i−1) and the disturbance of the slope w2( )i−1 at point P . i−1
Now, one may ask why noise is applied on the lateral slope and not on the range itself. The answer is that the model would be more robust using a parameter (a random variable) whose variance remains constant during the process. Since the measurement of terrain undulations requires a discrete model in which step size is not necessarily constant, it makes more sense to choose the slope that is
independent of the step size. In other words, had we applied noise on the range, we should change its variance proportional to the step size. In our approach, however, a constant variance of the slope disturbance suffices. Thus, the robustness of the model is improved while the process disturbance is applied on the lateral slope.
Terrain undulations can be modeled using a discrete stochastic linear system without a deterministic input. The process model is given by,
( ) 1 1 , ) 1 ( 2 1 1 1 , 2 1 − − − − − + = i i i i i i i i i x x x x w G F (2)
where x1i and x2i are the states of the system at position θi. The state transition matrix F and the noise input matrix G are given by,
− = − = − − − 0 1 , 1 1 1 1 , 1 i i i i i i θ θ θ θ G F (3)
Denoted by
w
, the terrain disturbance between two positions is approximated by white noise in order that it can be identified using the standard deviation of the probability distribution of the disturbances that is named “slope standard deviation”. White noise is a justifiable assumption for either terrain disturbances or the range measurement noise, especially for natural terrain. White noise implies that the noise is generated by a number of independent random sources, and it is not correlated in time. The assumption of white noise facilitates the stochastic analysis because the white noise may be defined by only one parameter that is the variance of a Gaussian probability distribution function.Slope Standard Deviation - The slope standard deviation specifies the terrain disturbances modeled by white noise. In Figure 11, a normal distribution curve is used to illustrate the significance of the slope standard deviation. The slope standard deviation SSlope is obtained by assuming a range
for the slope variation between two adjacent observations at a certain confidence level and projecting it onto the z-score axis of a normal distribution curve. For instance, for a surface whose slope variation is bounded between −1 and 1 (i.e., the inclination bounded between -45° and 45°) at a 95% confidence level, the slope standard deviation is equal to 0.510. It means it is almost certain that the slope variation will not exceed ±1 between two measurements. Thus, the steeper the terrain undulations, the greater the slope variation range and the greater the slope standard deviation. In practice, natural terrain may be characterized by relatively low slope standard deviations whereas artificial environment with sharp edges and range discontinuities entail greater standard deviations.
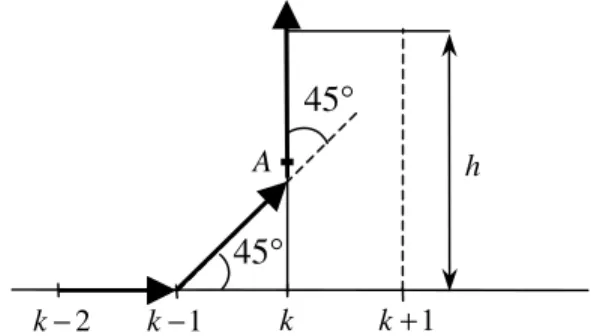
Geometrical interpretation of the slope standard deviation - To simplify the interpretation, the range
x
1 and the lateral slopex
2 are shown by the height of the slope at a point (Figure 12). It is assumed that the height is measured by a sensor whose noise variance is known. In the previous example, the slope standard deviation is 0.510 so that slope variations of more than ±1 are unlikely to happen. If the sensor advances from position k−2 to position k−1 the system output will stay the same because the sensor returns an identical value for the elevation. At position k, the sensor reads a height h and dictates a jump to the system. However, due to the constraint imposed by the slope standard deviation, the system can hardly postulate slope variations of greater than 1 that is the inclination changes of more than 45°. Thus, the system output cannot reach the measured height and stops somewhere close to 45° depending on the measurement variance (e.g., point A). At position1
+
k , the sensor returns the same height as that of the step k so that the inclination increases by another 45°; the overall inclination reaches 90°. At this point since an inclination of 90° (infinite slope) can accept any elevation, the system output is not controlled by the filter and yields the measurement. It is noted that if the system had used a slope standard deviation of 0.294 (i.e., a slope variation of [-0.577, 0.577] or inclination change of [−30°, 30°]), the same process would be completed after three steps.
4.3 Adaptive Filtering Using Fuzzy Terrain Modeling
The model of the terrain undulations is defined as a linear state vector whose state transition and noise matrices are invariant. It was discussed that the optimality of the model largely depends on two parameters of the system: 1) the standard deviation of the probability distribution of the lateral slope disturbance; and 2) the variance of the joint probability distribution associated with the measurements of the sensing system. Thus, to complete the parameter identification of the modeling procedure it is required to specify two parameters: slope standard deviation,SSlope, and the measurement variance. The latter is determined based on the statistical analysis of the sensors, the batch processing filter, and the static filter. The analysis may be carried out offline and in normal operating conditions under the assumption that the sensing systems have stationary statistics. However, the former depends on the characteristics of the terrain that may vary significantly for different types of terrain. Thus, the performance of the system may be optimized if SSlope is updated online based on the terrain type.
The online determination of SSlope involves terrain typing that requires an online modeling method
capable of quantifying the nature of the surrounding terrain based on real-time observations. One approach may be the use of a qualitative modeling method known as black box approach. Black box modeling determines the dynamic model of a system exclusively based on the input-output records
(i.e., without a priori knowledge about the system). The inputs into the terrain typing procedure may be the statistics of the observations (e.g., the mean and standard deviation of the range measurements), and the output is the slope standard deviation. Black box modeling is mainly used in two circumstances: 1) when an exact mathematical model is not available; and 2) when a mathematical model is available but the desired outputs are different from the actual outputs of the system. Terrain typing for the determination of the slope standard deviation involves both cases. First, due to the uncertainties associated with the sensing system, there is no precise mathematical model available to relate the slope standard deviation to the measurements. Second, the actual characteristics of the terrain are not necessarily the same as the desired terrain map that is input to path planning (e.g., the sharp edges of the terrain must be eliminated in the map).
A qualitative model may represent the behavior of a system by linguistic terms and IF-THEN statements, which are called rules. For example, if the inputs into the black box modeling process are the mean
ρ
and the standard deviationσ
ρ of the range measurements for an arbitrary terrain surface, and the output is SSlope, a simple qualitative model may be defined by the following threerules: i) if
ρ
is small andσ
ρ is small, then SSlope is small; ii) ifρ
is small butσ
ρ is large, then SlopeS is medium; and iii) if
ρ
is large andσ
ρ is large, then SSlope is large, where the rules may beattributed to flat, rugged, and protuberant terrain, respectively.
Typically, the rules of qualitative models are in the form of linguistic terms that may not be appropriate for physical systems modeled by mathematical expressions. Fuzzy logic based modeling is a special case of qualitative modeling that can deal with quantitative data using the fuzzy sets, although the fuzzy sets can be used thereafter to derive the linguistic terms from a fuzzy model [26]. Having modeled by fuzzy logic, the terrain characteristics are directly quantified by the model output.
Fuzzy logic terrain typing includes a fuzzy knowledgebase and a fuzzy inference engine (Figure 13). The inference engine determines the terrain standard deviation of the slope and continuously adapts the gains of the Kalman filter based on real-time observations using an a priori knowledgebase that represents the input-output relationships. The knowledgebase is developed offline based on the empirical data that relates the inputs or antecedents to the output or consequence. The output is the slope standard deviation, and the inputs may be selected from a finite number of candidate parameters that can be measured by the sensors or derived from the sensor data. The parameters are selected using an optimization procedure that determines the most significant candidates [27]. Since the measurements are prone to error, it is often more appropriate to use the statistics of the sensor data such as the mean or the standard deviation of the measurements.
Relevant candidates for terrain typing may include the mean and standard deviation of the height, slope (i.e., the change of the height), and rate of the change of the slope at a point. The terrain characteristics are naturally related to these parameters, but the significance of each parameter must be verified by the optimization procedure before they are included in the model.
The offline knowledgebase preparation experiments involve the determination of: 1) the candidate parameters for different terrain surfaces; and 2) a slope standard deviation that adapts the filter such that the terrain scanning robot follows the terrain undulations most appropriately. For example, Table 1 lists the input and output data for a typical ramp profile. The inputs include the mean and standard deviation of height H, change of height S, and the second order change of height
δ
S, that are denoted byM
H,
σ
H,M
S,
σ
S, and MδS,σ
δS, respectively. The last column of the table includes the most appropriate slope standard deviation, SSlope, for such terrain. The appropriate slope standard deviation is determined by inspection. Table 2 shows the effect of the slope standard deviation on the performance of the filter where “Small” and “Large” indicate that the response of the filter is either too slow or too fast, respectively. It is noted that the appropriate slope standard deviation corresponds to a range and not to an exact value so that the standard deviation will be better modeled by fuzzy sets than by crisp values.5 Conclusions
With the development of the state-of-the-art mine detectors, remote sensing has been recognized a possible solution for dealing with the longtime problem of landmines in the world. However, the reliability of the remote sensing method largely depends on appropriate manipulation of the detector. Typically, the manipulation of a mine detector involves moving a relatively large plate at a constant speed and maintaining the plate at a constant distance from the ground. The terrain scanning robot is a mobile dexterous manipulator that can autonomously scan natural terrain in real time using a typical mine detector. Thus, the development of the terrain scanning robot has been a great step forward towards the feasibility of the remote sensing method.
More specific conclusions of the research may be related to the map building and path planning procedures.
Map building is the core of the software of the terrain scanning robot. In general terms, map building is a dynamic modeling process that includes three phases: predict, match, and update. This process indicates a generic framework that is suitable for every autonomous robot that uses sensor data to perform in an unknown environment. Therefore, the map building procedure of the terrain
scanning robot may be used as an example for the software development of other mobile robots or manipulators.
Sensor fusion is an essential part of the map building procedure because: (i) it provides a complete model of the environment based on the partial information obtained from individual sensors that are not capable of measuring the desired features of the environment; and (ii) it improves the reliability of the sensing systems using the redundant data obtained from competitive sensors.
The use of a Kalman filter (i.e., a dynamic filter) in the map building procedure allows for maintaining a local map of the terrain and updating it online, whereas without the filter a global map would be necessary. It is noted that the local map is updated in real time so that the path planning and the other functions of the robot may be executed in parallel.
The Kalman filter requires a dynamic model of the process. The model is a linear stochastic model that represents the terrain undulations. The parameter identification as well as the robustness of the model has been discussed in detail. The model can be used in both Cartesian and spherical coordinate frames; thus, it may be used in many other robotics applications that use a dynamic filtering method for map building.
An important parameter of the stochastic model is the standard deviation of the probability distribution of the process disturbances (viz., the slope standard deviation). Depending on the terrain type, the slope standard deviation influences the output of the Kalman filter significantly. Specifically, the online identification of the slope standard deviation changes the gains of the Kalman filter and yields an adaptive filter. The online identification of the slope standard deviation is carried out using fuzzy logic based on fuzzy knowledgebase developed by a systematic fuzzy dynamic modeling technique. This introduces a novel fuzzy adaptive Kalman filter that can be used in many signal and data processing applications.
The systematic fuzzy modeling of the terrain is an excellent method for the determination of the terrain type. The systematic modeling uses only input-output records without a priori knowledge about the type of the terrain. Therefore, this method may be used for characterization of the terrain in many other applications such as planetary mobile robots.
Outlier rejection is necessary to eliminate the erroneous measurements based on their significance level. Traditional methods use the Euclidean distance between the predicted values and the measurements to reject or accept them. These methods are sensitive to the disturbances of the process. More precisely, they cannot distinguish between the discrepancies due to the process disturbances or the measurement errors. In this research, the outlier rejection is carried out based on the Mahalanobis distance that is more robust criterion for discrepancy between two random variables.
Path planning for the autonomous mobile robots and manipulators is carried out based on the sensor data usually obtained with respect to a non-Cartesian coordinate frame. The traditional path planning methods generate the path in the robot Cartesian coordinate frame. Thus, they have limited real-time applications due to the processing load required for the data transformation from sensor coordinate frame into the robot coordinate frame. In this research, however, a new approach is used to obtain the path in the sensor coordinate frame based on a mathematical model of end effector in the sensor coordinate frame. This approach can be used in other autonomous mobile robots that use sensors to model the environment.
6 Acknowledgments
This work has been supported by Defence R&D Canada, Suffield (DRDC-Suffield) under the contract W7702-6-R625/001/EDM with the Canadian Center for Mine Action Technologies (CCMAT). We would like to acknowledge the staff of DRDC Suffield, particularly Dr. Yoga Das, Robert Chesney, and Kevin Russell for their supports during the course of this research.
7 References
[1] Y. Das, K. Russell, N. Kircanski, A. A. Goldenberg, “An Articulated Robotic Scanner for Mine Detection – a Novel Approach to Vehicle Mounted Systems,” SPIE, 1999 Conference (Aerosense), Orlando, Florida, 5-9 April 1999.
[2] J. D. Nicoud, “Vehicles and Robots for Humanitarian Demining”, Industrial Robot, vol. 24, no. 2, 1997, pp. 164-168.
[3] J. Trevelyan, “Robots and Landmines”, vol. 24, no. 2, July 1997, pp. 114-125.
[4] R. Cassinis, G. Bianco, A. Cavagnini, P. Ransenigo, “Strategies for Navigation of Robot Swarms to Be Used in Landmine Detection”, 1999 Third European Workshop on Advanced Mobile Robots (Eurobot’99). Proceedings IEEE, pp. 211-218.
[5] K. M. Dawson, T. G. Williams, “The Detection of Buried Landmines using Probing Robots”, Robotics and Autonomous Systems, vol. 23, no. 4, July 1998, pp. 253-263.
[6] A. M. Shahri, F. Naghdy, “Detection of Anti-personnel Mines using Mechatronics Approach”, The International Society for Optical Engineering, vol. 3392, 1998; pp. 808-819.
[7] Y. Bar-Cohen, “Detecting Landmines”, NDT Update, November 2001.
[8] P. Gao, L. M. Collins, “Time-domain Metal Detector and GPR Data Processing and Fusion for Landmine Detection”, Proceedings of the SPIE 2000 – The International Society for Optical Engineering, vol. 4038, 2000, pp. 847-852.
[9] P. Gao, L. M. Collins, N. Geng, L. Carin, “Classification of Buried Metal Objects using Wideband Frequency-domain Electromagnetic Induction Responses: A Comparison of Optimal and Sub-optimal Processors”, IEEE 1999 International Geosceince and Remote Sensing Symposium, IGARSS’99.
[10] P. Gao, S. Tantum, L. M. Collins, “Single Sensor Processing and Sensor Fusion of GPR and EMI Data for Landmine Detection”, Proceedings of SPIE 1999 – The International Society for Optical Engineering, vol. 3710, pp. 1139-1148.
[11] S. Zhong, A. M. Jacobs, E. T. Dugan, D. Ekdahl, “X-ray Lateral Migration Radiography System for the Application of Landmine Detection”, Proceedings of SPIE 2000 – The International Society for Optical Engineering, vol. 4142, pp. 150-160.
[12] P. D. Gader, M. Mystkowski, Z. Yunxin, “Landmine Detection with Ground Penetrating Radar using Hidden Markov Models”, IEEE Transaction on Geosceince and Remote Sensing, , vol. 39, 2001, pp. 1231-1244.
[13] G. H. Miller, S. C. Culbertson, J. Mobley, C. DiMazio, T. Vo-Dinh, “Near Infrared (NIR) Emitter/Detector Probe for Sensing Buried Objects and Landmines”, Proceedings of SPIE 1999 – The International Society for Optical Engineering, vol. 3752, pp. 307-313.
[14] G. A. Clark, “Computer Vision and Sensor Fusion for Detecting Buried Objects”, Annual Asilomar Conference on Signal, Systems, and Computers (26th), October 1992.
[15] N. Del Grande, “Sensor Fusion Methodology for Remote Detection of Buried Landmines”, Lawrence National Lab Symposium on Sensor Fusion, April 1990.
[16] C. D. Metz, “Recent Developments in Tactical Unmanned Ground Vehicles”, Proceedings AUVS-92, 19th Annual Technical Symposium and Exhibition, June 1992.
[17] F1A4 Metal Detector Manual, Minelab Electronics Inc, 2000.
[18] F. Guerne, “GPR Mine Sensors for Data Acquisition in the Field” International Workshop on Sustainable Humanitarian Demining (SusDem’97), September 1997.
[19] H. Najjaran, N. Kircanski, “Path Planning for a Terrain Scanning Robot,” Proceedings of International Symposium of Robotics, May 2000.
[20] H. Najjaran, N. Kircanski, A. A. Goldenberg, “Image Registration for a Terrain Scanning Robot,” 2001 IEEE International Conference on Robotics and Automation, May 2001.
[21] James l. Crowley, Yves Demazeau “Principles and Techniques for Sensor Fusion,” signal processing, vol. 32, no. 1-2, May 1993, pp 5-27.
[22] C. Xu, S. A. Velastin, “The Mahalanobis Distance Hough Transform with the Extended Kalman Filter Refinement”, 1994 Symposium on Circuits and Systems.
[23] J. Veganay, “Outlier Rejection for Autonomous Acoustic Navigation”, Proceedings of the 1996 IEEE International Conference on Robotics and Automation.
[24] G. V. S. Raju, H. Wang, “Sensor Fusion using Pitman’s Closeness Technique and Complete Linkage Algorithm”, Proceedings of the 1994 IEEE International Conference on Multisensor Fusion and Integration for Intelligent Systems.
[25] S. Kweon, T. Kanade, “High-Resolution Terrain Map from Multiple Sensor Data,” IEEE Trans. Pattern Analysis and Machine Intelligence, vol. 14, no. 2, February 1992.
[26] M. Sugeno, T. A. Yasukawa, “Fuzzy-logic-based Approach to Qualitative Modeling”, IEEE Transactions on Fuzzy Systems, vol. 1, 1993.
[27] M.R. Emami, A. A. Goldenberg, I. B. Turksen, “Development of a Systematic Methodology of Fuzzy Logic Modeling”, IEEE Transactions on Fuzzy Systems, vol. 6, 1998, pp. 346.
Figure and Tables
Figure 1
Terrain scanning robot
Figure 2
Mine detector arm
J4’ J3’ J2 J5 J3 J4 J1 L4 L6 L2 L5 L1 L3 V = 0.5 m/s 45° 2 m 0.65 m Q5 Q4 Q3 Q2Figure 3
Sensor coordinate frame
Figure 4
Model of the end effector as an interface between the task and joint space
y
dr
r
ds
ρ
θ
ϕ
x
z
Sensor ArmA Model of the
End Effector
Joint Space:
Robotic
Manipulator
Task Space:
Environment
Figure 5
A pair of rotating orthogonal tangent vectors
y zρ
γ
θ
x
nˆ
eˆθz rzeˆ
rFigure 6
Map building: 1) image registration; and 2) map filtering
Laser Range
Measurements
Laser Scanner
Coordinates
Batch
Processing
Filter
Fusion
Scan
Line
Static
Filter
Ultrasonic Range
Measurements
Range Estimate I
Longitudinal
Slope
d
ρ
d
ϕ
Kalman
Filter
Range
Estimate II
Turret
Coordinates
Range
Estimate III
ρ
Lateral Slope
θ
ρ
d
d
Path
Planning
Local
Observations
Map Building
Joint
Coordinates
Figure 7
Range image
Figure 8
Database of the range image
Figure 9
Image registration flowchart
Laser Spot
Scan Line
θ
Move-Table
Status
Map Index
Configuration
Map-Data
Mirror
Angles
Ranges
Modify mirror
speed
Calibrate and register the data acquired
from desired angles
Reset laser interface
Get the reset position
Yes
No
Read N samples from laser interface
Find the mirror angles of each sample
Samples acquired
from a full rotation?
Figure 10
State transition of the terrain dynamic model
Figure 11
Slope standard deviation
Figure 12
Geometrical interpretation of the slope standard deviation
S = 0.294
S = 0.510
95 99.99
1.15
1 1.99
1.96 3.89
z-score
0.58
Confidence level %
Normal distribution S = 1.00
1 − iθ
θiθ
( )1 1i− x 1x
ix
1 ( )1 2i− w ( )1 2 1 tan− x i− 1 − iP
iP
2 − k k−1 k k+145
°
45
°
h AFigure 13
Fuzzy terrain typing for an adaptive Kalman filter
Table 1
The result of an experiment on a 30º ramp
Table 2
Appropriate slope standard deviation for the 30º ramp
Experiment
M
HσσσσH
M
SσσσσS
M
δδδδSσσσσ
δδδδS SSlopeRamp-30º 0.04234 0.04810
0.00408
0.01108
0.00006
0.01366 0.020
Slope
S