Publisher’s version / Version de l'éditeur:
Vous avez des questions? Nous pouvons vous aider. Pour communiquer directement avec un auteur, consultez la première page de la revue dans laquelle son article a été publié afin de trouver ses coordonnées. Si vous n’arrivez pas à les repérer, communiquez avec nous à [email protected].
Questions? Contact the NRC Publications Archive team at
[email protected]. If you wish to email the authors directly, please see the first page of the publication for their contact information.
https://publications-cnrc.canada.ca/fra/droits
L’accès à ce site Web et l’utilisation de son contenu sont assujettis aux conditions présentées dans le site LISEZ CES CONDITIONS ATTENTIVEMENT AVANT D’UTILISER CE SITE WEB.
Journal of Thermal Spray Technology, 28, 3, pp. 444-459, 2019-01-23
READ THESE TERMS AND CONDITIONS CAREFULLY BEFORE USING THIS WEBSITE. https://nrc-publications.canada.ca/eng/copyright
NRC Publications Archive Record / Notice des Archives des publications du CNRC : https://nrc-publications.canada.ca/eng/view/object/?id=9c5a2cfd-b27f-4fee-9189-e22383d96b5d https://publications-cnrc.canada.ca/fra/voir/objet/?id=9c5a2cfd-b27f-4fee-9189-e22383d96b5d
This publication could be one of several versions: author’s original, accepted manuscript or the publisher’s version. / La version de cette publication peut être l’une des suivantes : la version prépublication de l’auteur, la version acceptée du manuscrit ou la version de l’éditeur.
For the publisher’s version, please access the DOI link below./ Pour consulter la version de l’éditeur, utilisez le lien DOI ci-dessous.
https://doi.org/10.1007/s11666-019-00833-9
Access and use of this website and the material on it are subject to the Terms and Conditions set forth at
Powder development and qualification for high-performance cold spray
copper coatings on steel substrates
Poirier, Dominique; Legoux, Jean-Gabriel; Vo, Phuong; Blais, Bruno;
Giallonardo, Jason D.; Keech, Peter G.
Powder Development and Qualification for High Performance Copper Coatings on Steel Substrates
Dominique Poirier1, Jean-Gabriel Legoux1, Phuong Vo1, Bruno Blais1, Jason D. Giallonardo2, Peter G. Keech2
1National Research Council of Canada 75 de Mortagne Blvd.
Boucherville, QC J4B 6Y4 Canada
2Nuclear Waste Management Organization 22 St. Clair Avenue East, 6thfloor
Toronto, ON M4T 2S3 Canada
*Corresponding author: Dr. Dominique Poirier
National Research Council of Canada 75 de Mortagne Blvd. Boucherville, QC J4B 6Y4 Canada e-mail: [email protected] Phone: +1-450-641-5294 Fax: +1-450-641-5105
Abstract
This paper presents the development work undertaken to tailor Cu powder size specifications to produce dense Cu coatings featuring strong adherence on steel substrates. Through review of historical data generated with powder lots of different sizes in the course of the development of Cu coatings for corrosion protection of Used Fuel Containers (UFCs), it was found that particle size distribution was particularly critical to meet application adhesion requirements of 60 MPa and prevent clogging; D01 and D90 were fixed at 5 and 60 µm respectively. The effect of powder size on coating microstructure and adhesion was further investigated with four Cu powder lots presenting different granulometries. The four lots were analyzed for composition, hardness, microstructure and morphology. Their in-flight particle velocities were measured using a coldspraymeter and the impact temperatures and velocities simulated. Using fixed spraying conditions consisting of a He bond coat and a nitrogen build-up step, 3-4 mm thick coatings were produced out of the four powders and tested for bond strength. Coating cross-sections and fracture surfaces of selected coatings were examined. These trials confirmed that although all powder sizes tested produced dense and sound coatings, tight control of particle size distributions was required to achieve optimal impact velocities that ensure deformation of the steel and hence good coating adhesion.
Introduction
In support of the Nuclear Waste Management Organization’s (NWMO) approach to spent nuclear fuel disposal in Canada, a multi-phased program to develop a Cu cold spray application was undertaken by the National Research Council. A core element of NWMO’s approach is a used fuel container (UFC), consisting of a steel vessel protected by a Cu corrosion barrier, to package used fuel for underground emplacement in a deep geological repository (DGR). The application of Cu cold spray coatings has been focused on the final assembly closure weld process after fuel loading while the bulk of the used fuel container (UFC) steel components, i.e., hemi-spherical head and lower assembly, are Cu coated using electrodeposition. During the multi-phased program, extensive efforts were directed at cold spray process development specifically for this application [1-2].
Early development was mainly concentrated on spray parameters optimization, but an initial comparison of Cu powders acquired from different suppliers and with D50 varying between 20 to 49 µm was also performed. It was found at that time that dense and sound coatings could be obtained from all powders, but some lots were eliminated based on other considerations such as targeted coating composition (level of powder impurities) and tendency for equipment clogging [1-2]. During recent development, a variability in coating bond strengths from one powder lot to another justified further investigation of the effect of powder size on coating properties.
From literature, it has been shown both numerically and experimentally that particle size influences the powder behavior in the cold spray jet; smaller particles will achieve higher in-flight velocity [3-4]. On the other hand, decreasing particle size lowers their inertia; too small particles will be decelerated or deviated by a bow shock present in front of the substrate, decreasing the impact velocity and altering the impact angle [5].
One of the key concepts in cold spray that links the particle velocity with coating built-up is the critical velocity (vc). vc is theoretically defined as the minimal particle velocity required to obtain particle deposition. In other words, particle velocity below the critical velocity will lead to material loss due to erosion while above vc, material gain will occur [6]. Practically, it is not possible to directly measure this parameter and as a consequence, we encounter different “applied” definitions of vc. Experimentally, vc can be considered as the velocity to get 50%DE [7], derived from the deposition efficiency when correlated with the powder particle cumulative size distribution and modelled particle velocities as a function of size [7-8] or determined by spraying individual particles and examining resulting splats [9]. In modelling work, vccan be determined as the onset of shear instability [7,10] or at a certain level of shear instability quantified by a specific particle-substrate interface fraction that has reached a minimum temperature [11]. Although the measured or calculated vcare expected to be similar in all cases, these methods present bias that one must be aware. As an example, in order for a particle to stick on a surface, the onset of shear instability is not enough as the extent of shear instability must be sufficient to counteract the effect of the rebound energy. As a result, the calculated vcusing the onset of the shear instability will be lower than the actual vc.
vcis very high at low particle sizes but quickly decreases with increasing particle size to eventually level off [5]. As a consequence, an optimum particle size range for cold spray, i.e., a range that maximizes the increment of the particle velocity above vc, can be defined. Specifically for Cu on Cu, Schmidt et al. used experimental and modelling data to determine the relationship between critical velocity (νcrit) of Cu powder and the powder particle size (dp) [7]:
, = . (Equation 1)
At room temperature, it can be calculated that vcdecreases from about 550 m/s at 8 µm to about 385 m/s at 60 µm. Those velocities are easily reached by cold spray systems, hence the renowned good cold sprayability of Cu. Deposition efficiencies near 100% and dense coatings have been demonstrated by several research teams [2,8, 12-13]. The relationship between particle in-flight velocity, impact velocity and coating properties is not always straightforward and the exact bonding mechanisms not well understood. Among others, the above theories do not always distinguish the coating build-up step, associated to deposition efficiency and coating microstructure, from the first layer of particles impinging on a substrate of a different material and a specific roughness; the latter case being related to coating adhesion. Clearly, there is a need to pursue research work in this field.
This paper presents the development work undertaken to tailor Cu powder size specifications for the particular cold spray application of nuclear UFCs. From the analysis of historical project results involving the use of several Cu powder lots with varying particle size distribution, a powder size specification has first been defined based on adhesion and clogging constraints. The effect of powder size on coating microstructure and adhesion was then further investigated with an in depth analysis of four Cu powder lots. Modelling was also used for a better understanding of the effect of powder size on particle impact temperatures and velocities.
Experimental
2.1. Feedstock Powders
In the course of the cold spray process development for the UFC application, multiple similar spherical Cu powder lots coming from TLS Technik, Plasma Giken, 5N Plus and Tekna suppliers were tested. The powders were either produced through gas or plasma atomization and these trials allowed powder specification development through lot to lot comparisons.
In a second step, four Cu powders featuring different particle size distributions were selected from the initial lots for further analysis: a fine spherical powder from 5N Plus (D50-33) and three powders from Plasma Giken (D50-39, D50-55 and D50-66). It is worth noting that all powders were stored in inert atmosphere after bag opening to prevent powder ageing.
2.2. Spraying Conditions
All samples were sprayed with a PCS-800 cold spray system from Plasma Giken Co. (Toshima-ku, Tokyo, Japan) using the reference coating system developed for the application in an earlier work [1]. It consists of a bond coat (~70-100 µm) sprayed with He to maximise coating adhesion followed by a N2-sprayed top coat to build the required coating thickness of 3 mm (nominal) after finishing. For both layers, gas temperature and pressure were fixed at 800 °C and 5 MPa. The nozzle used has a diameter of 3.6mm at the throat and of 6.7mm at the exit.
Spraying was performed on 1” dia, 1.5” thick cylinders made of 44W steel (153 HRV). The cylinders were grit blasted (grit 24) prior to spray to a roughness of about 5µm Ra. In order to mimic the spraying pattern of the final UFC cylindrical shape, coupons were installed and sprayed on a cylindrical fixture of 6” dia as shown in Figure 1. The fixture was rotated at 225 RPM and the gun traverse speed was fixed at 3.7 mm/s. Standoff distance was 30 mm and powder feed rates were adjusted to about 80 g/min.
The in-flight particle velocity during cold spraying was measured via a coldspraymeter (Tecnar, St-Bruno, Canada). The system uses a diode laser of 3W to illuminate the particles. The laser reflection from the particles is captured by a dual-slit photomask to measure the particle time of flight for a specific distance (slits are 105µm apart in this specific case) needed to calculate the particle velocity. The measurements were performed at the highest flux of triggered particles, i.e. near the middle of the jet.
2.3. Powder and Coating Characterization
The average particle size and the volume-weighted particle size distribution were measured via a laser diffraction particle size analyzer (LS320, Beckman Coulter, Miami, FL, USA).
The as-received feedstock powder morphology was characterized using a field emission gun scanning electron microscope (FEG-SEM) Hitachi S-4700 (Tokyo, Japan) in secondary electron imaging mode (SEI). Both the as-received feedstock powders and the produced coatings were cold vacuum mounted, grounded, polished and then etched (etchant: 5g Iron (III) nitrate, 25ml HCl, 70ml water) for microstructural examination using an Olympus BX53M (Tokyo, Japan) optical microscope. Powder grain size was estimated measuring the length of at least 20 grains per powder from the 500X etched micrographs.
Powder microhardness was obtained using a Clemex microindentor MMT-X7B with reported values an average of 10 indents taken at 1 gf.
The chemical composition of the feedstock powder was performed in accordance with ASTM E53 and E2575 for Cu and O2respectively.
The coating adhesion was evaluated according to the ASTM C633 standard for coating thicknesses between 3 and 4 mm. The coating samples were glued to grit blasted (Al2O3, grit 24) mild steel cylinders and tests were performed using an Instron 5582 universal
testing machine (Burlington, Canada) at a constant speed of 1.02 mm/min. Selected fracture surfaces were observed either by recording images at different focal planes (Z-stack) using the Olympus optical microscope or under the Hitachi FEG-SEM.
2.4. Modelling
Numerical simulation of the particle trajectory up to its impact on the substrate can provide insight into the impact velocity and temperature and its dependence on the particle size and density. For these simulations to be accurate, the full effect of the substrate on the flow must be taken into account. Therefore, complete 2D axisymmetric flow profiles are required to ensure accurate particle tracking.
In this work, 2D compressible flow simulations are carried out using SU2, which is a widely used implicit finite-volume computational fluid dynamics application [14-16] and the particle tracking was carried out using the one-way coupled Particle CFD module of CSAM Digital Solutions, a software developed within Cold Spray Additive Manufacturing (CSAM) industrial R&D group led by the National Research Council. First, the governing equations and their numerical discretization are briefly overviewed along with the meshing strategy and the boundary conditions. Then, the core elements of the particle tracking are detailed.
2.4.1. Equations and discretization of the flow problem
The compressible, turbulent Reynolds-Averaged Navier-Stokes equations in conservative form solved for the flow problem are [16]:
T v c E t , , 0 u V Q F F V (Equation 2)The conservative variables vector V contains the density, the velocity components and the internal energy. The convective fluxes, viscous fluxes and source term are defined as [16]: 0 , T k p E p tot v c u τ τ F u u Ι u u u F
(Equation 3)where ρ is the mean density, u the mean velocity vector, p the mean pressure, I the identity tensor, E the mean total energy, T the temperature and ktotthe total conductivity
(turbulent and laminar). The viscous stress tensor τ is defined as:
3
2
u
u
I
u
τ
T tot
(Equation 4)The total viscosity and conductivity are computed from the laminar viscosity and the turbulent viscosity following the Boussinesq hypothesis:
t t l tot t l tot k Pr Pr
(Equations 5 and 6)where μl is the laminar (or dynamic) viscosity, μt is the turbulent viscosity, Pr is the
Prandlt number and Prt is the turbulent Prandlt number. In this work, the Menter shear
gas equation of state is used and the laminar viscosity is calculated using Sutherland’s law as a function of the gas temperature alone.
These equations are solved in steady-state and axisymmetric coordinates using an adaptive time-stepping approach until the relative dimensionless density residual reached is below 10-11. Initially, a first-order upwind scheme for the conservative and the turbulent variables is used to obtain a coarser solution. This solution is then used as the initial condition for a second resolution with a second order JST scheme. This ensures a higher fidelity, minimizes numerical diffusion, reduces computational time and increases robustness.
The height of the computational domain is set to be 10 times the exit diameter of the nozzle to ensure that there is no interaction between the boundary conditions (at ambient pressure and temperature) and the nozzle flow. A total-pressure and total-temperature inlet condition was imposed at the entrance of the nozzle and symmetry was imposed on the axis of the nozzle.
Adequate wall resolution (i.e., y+<1) was maintained over the nozzle inner and outer walls as well as on the substrate. Meshes of the domain were generated using GMSH [18] until mesh-independent solutions were reached for the centerline pressure, velocity and temperature. For cases with and without a substrate, the final meshes contained ~120 thousand quad and triangular elements with extensive mesh refinement close to the
substrate impingement point. On average, the first order and the second order simulations took 3 hours total using 20 cores on a workstation (2X Intel Xeon E5-2660).
2.4.2. Particle tracking
One-way coupled particle tracking is carried out using the steady-state flow calculations. One-way coupling assumes that the mean gas flow is not affected by the flow of the particles. Considering the small volume fraction used in the present work (<0.1%), this hypothesis is a valid one. Newton’s second law is solved for each particle using a fourth order Runge-Kutta scheme. Bilinear interpolation is used to interpolate the flow
properties at the center of mass of the particles. Drag force, unresolved pressure gradient and unresolved viscous stress are considered in the force balance. Saffman lift, Magnus lift, virtual mass and Basset force were found to be negligible in this context. We refer the reader to Blais et al. [19-20] for a thorough discussion on these forces.
To the best of the authors’ knowledge, this represents the first usage of SU2 for RANS cold-spray simulation; however, this software platform has previously been validated in large range of applications related to compressible flows and is used by a large community to study external and internal compressible flows [14-16].
Similar one-way and two-way coupling modeling work has been carried in the past using commercial software (such as Fluent) notably by Schmidt et al. [7] and Samareh et al. [21]; however, it is unclear if these authors used meshes with resolved boundary layers or with wall-functions. Considering the complexity of the shock-substrate interaction and
the influence of the bow shock on the particle trajectory, a resolved boundary layer is preferable to obtain an accurate flow field and, consequently, accurate predictions of the particle impact velocity.
Results
3.1. Powder Size Specification Definition
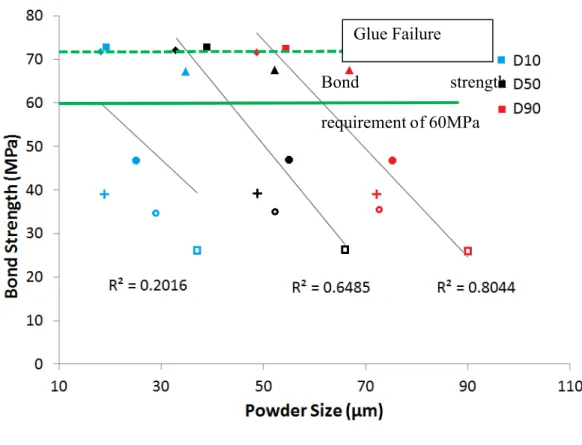
Early work for this application was performed using a typical powder definition for thermal spray, i.e., by specifying the upper sieving mesh at -53 or -75 µm. Although dense coatings were obtained with all powder lots, it was found that coating adhesion and powder tendency for nozzle clogging displayed great variation from one lot to another, showing that a powder specification tailored to cold spray was required. In order to define a specific upper size limit that would ensure a coating bond strength of 60 MPa or above, adhesion results obtained from constant spraying set up and conditions were compiled for various spherical Cu powder lots used over several years of repeated trials and they present slight variations in terms of particle size distribution. Figure 1 presents the coating bond strength as a function of powder D10, D50 or D90 for the different powder lots. For two sample lots, failure occurred in the glue; this means that the coating adhesion exceeded that of the glue, but is not quantitative through this test. It is interesting to note that the coefficient of determination R2of a linear relationship between powder size and coating adhesion is higher when D90 is used compared to D50 or D10. This indicates that the coarser particles play a critical role in term of coating adhesion. A D90 < 60 µm was initially recommended strictly from these experimental observations to ensure meeting the application requirement of 60 MPa bond strength. The next sections
will present a detailed analysis to better understand this particle size/adhesion relationship.
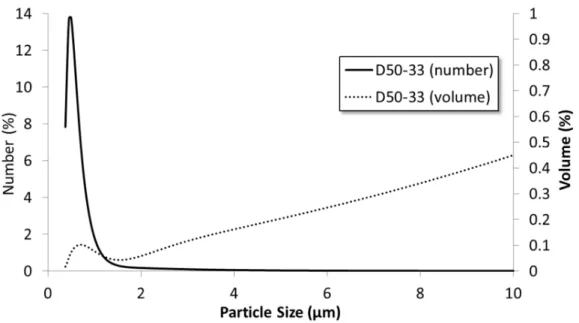
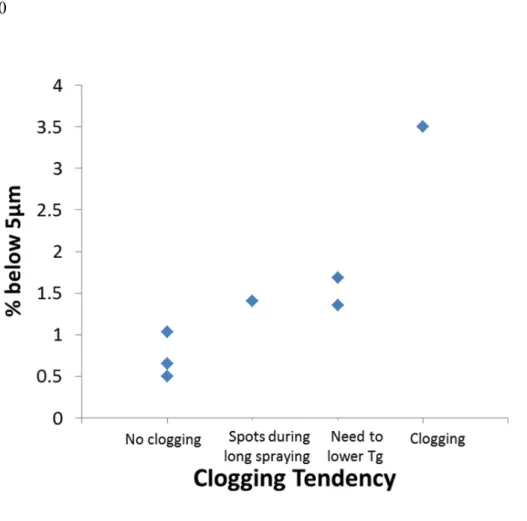
Another aspect that is of concern when spraying Cu at high temperature is the occurrence of clogging in the gun nozzle. It is known that very fine particle particles can stick within the cold spray system’s nozzle and/or injector, causing clogging. In the course of the different trials, it was noticed that some powder lots had a higher clogging tendency than others. Figure 3 shows the lower end of the particle size distributions in number and in volume of powder D50-33. We can observe an increase in particle volume below 2 µm. Although the observed peak is relatively small when the particle size distribution is shown in “%vol”, we can see from the number particle size distribution that those fines represent the highest number of particles in the powder lot. This bump is believed to represent the problematic fines leading to clogging and a standard D10 does not allow capture of those features. Error! Reference source not found. Figure 4 presents a relationship between powder fines and clogging tendency during cold spray. Clogging tendency was evaluated semi-quantitatively with powders divided in four categories as follows:
Powder lots that fit in the “no clogging” category did not show any indication of clogging;
In the “spots during long spraying” category were grouped the lots for which we could see isolated spots at the surface of the coatings for long spray runs at the reference conditions. These spots are believed to be the result of powder
accumulations in the gun, at the initiation of a clogging phenomenon, which are suddenly detached and propelled toward the coating surface.
In the category “need to lower Tg”, were put powders that could not be used at standard conditions due to clogging, but for which successful spraying could be achieved when gas temperature was decreased from 800 to 600°C
In the category “clogging” is the powder lot that could not be sprayed without clogging, even when gas temperature was lowered.
As expected, “% below 5µm” was found to be a better metric of fines compared to conventional D10 for revealing the relationship. Among the various powders tested, powders with 1 vol% or less of particles below 5 µm have not shown any powder clogging issues; hence the addition of a D01 >5 µm requirement in the powder specification. There is some variability in the results which suggest that powder hardness and/or powder surface state also impact the tendency for clogging.
3.2. Effect of Powder Size on Coating Properties
In order to provide a better understanding of the effect of particle size on coating properties, four Cu powder lots with different particle size distributions were characterized in more detail. The relationship between the particle size distributions and corresponding particle velocities achieved during cold spray was assessed using an in-flight particle diagnostic (coldspraymeter) and modelling. Finally, the impact of this change in particle velocity on coating properties was evaluated.
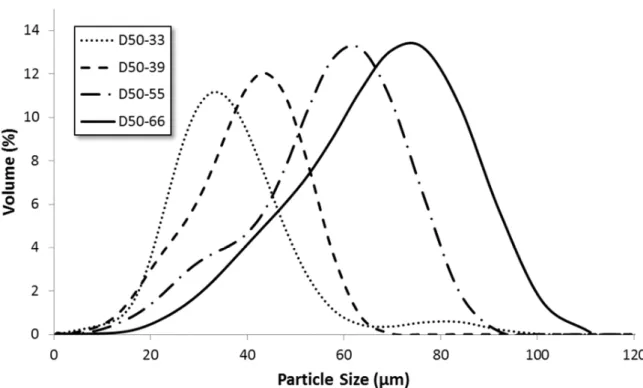
The particle size distribution of the four powder lots is shown in Figure 5 and Table 1. D50-33 powder is the finest with a D50 of 33µm while D50-66 is the largest with a D50 of 66um. D50-33 has some coarse particles toward 80µm while D50-39, D50-55 and D50-66 particle size distributions present a shoulder toward the fines. Regarding powder
morphology, (d)
Figure 6 compares the powder particles of the four powders. All powders are generally spherical, but D50-33 powder contains more satellites and some irregular particles.
Although the main subject of this study was the effect of powder particle size on coating properties, an in-depth characterisation of powder metallurgical state was performed to ensure potential bias from other powder features were identified. Table 2 presents the powder purity, oxygen level and powder hardness. All powders are at least 99.9% pure. From literature, a variation from 99.95% purity Cu to 99.9% purity Cu increases the UTS
by less than 2% and decrease the yield strength by 8% [22], and as such, the effect of this variation in composition on powder mechanical properties is considered to be negligible.
Little variability in oxygen content has been measured among the different powder lots used in the current study, going from 0.028% (D50-39) to 0.032% (D50-33). The oxygen content of D50-66 is not available but the very similar colour of this powder lot compared to the others is an indication that the powder content is in the same range. From literature, a variation in oxygen content from 0.01% to 0.06%, results in an increase in powder critical velocity of about 150 m/s [23]. It has also been shown that Cu powder oxidizing in air, causing a gain of oxygen of only about 0.007%, decreased the powder deposition efficiency from near 65% to 40-45% [24]. Presumably, the oxygen would be concentrated in the powder surface oxides, and these layers can act as barriers that need to be broken/dispersed to allow proper particle bonding upon impact and can result in a significant increase in critical velocity [25]. From literature, it can be observed that broken oxides can also be entrapped in the coating, detrimentally affecting coating strength and ductility [26-27]. As a consequence, even if powder variation in oxygen content was minimised, it cannot be ruled out that this factor could have some effect on the results presented in the next sections.
From Table 2, values for powder hardness are 48 for the 66 powder, 52 for the D50-55 powder, 62 for the D50-33 and 64 for the D50-39. Since powder compositions were similar in all cases, this variation in powder hardness is attributed to differences in powder microstructures. (d)
Figure 7 presents the single phase microstructures of the four different pure Cu powders showing that the coarsest grains are obtained with the coarser D50-55 and D50-66 powders (about 25 µm) while the smallest grains are obtained with the finest D50-33 and D50-39 powders (about 10 and 15 µm respectively). The latter powders present the highest hardness. This increase is attributed to grain boundary strengthening, which is typically described by the Hall-Petch equation [28]:
= + + ⁄ (Equation 7)
Where HO and KH are constants for a particular material, d is the average grain diameter and H is the resulting material hardness. By using a Ho of 25 kg/mm2 and a KH of 10 kg/mm3/2[28], a decrease in grain size from 25 to 15µm leads to a calculated decrease in microhardness of 18%, which is very close to the decrease in hardness obtained here (19-25%). In this specific case however, the size of the indent (5-10 µm, i.e., within the grain size range) probably introduced some bias in the microhardness measurements.
3.3. Particles In-flight Velocities
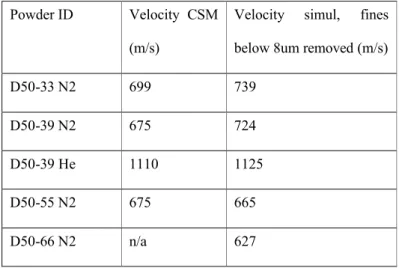
Table 3 presents simulated in-flight particle velocities for D50-33, D50-55, D50-39 and D50-66 powders for the reference conditions under nitrogen gas, as well as for D50-39 powder under He. The in-flight particle velocities measured from the coldspraymeter are also shown for the different powders and conditions. In order to be able to compare the experimental results with the simulation, the simulation was performed with a free jet (no substrate modelled). Also, since the coldspraymeter does not detect fine particles, the fines below 8 µm were removed from the simulation. The value of 8 µm is a rough estimate, as the level of particle detection of the coldspraymeter, that would need to be
further studied and will depend on several factors such as the acquisition parameters, the power of the laser used, the particle flow rate, the particle reflectivity, etc. The match between simulated and measured in-flight particle velocities is good, with a difference below 50 m/s for all cases, validating the model. Furthermore, the results are consistent with data found in literature (about 750 m/s and 1200 m/s obtained for a Cu powder of 30 µm (D50) with N2 and He as process gas, respectively. Spray conditions; PCS-305 Plasma Giken system, nozzle of 3 mm and 6.5 mm inner (throat) and outlet diameter respectively, 800°C, 4MPa, 30 mm) [29].
The particle velocities are nearly doubled when He is used as the process gas compared to N2. We recall that the Mach number distribution on the nozzle axis is only dependent on the geometry, on the specific heat ratio (γ) and on the inlet pressure of the nozzle [21]. Since He has a higher specific heat ratio than N2(1.66 vs 1.4, respectively) and a higher individual gas constant (2077.1 J/(kg.K) vs 296.8 J/(kg.K), respectively), it has a considerably higher speed of sound = [30]. Thus, the nozzle produces a gas at a velocity, and a relative velocity between the gas and the particles, that is significantly higher for He than for N2which, in turn, leads to faster particles.
Generally speaking, and as expected, higher velocities are achieved with smaller powders, although the differences measured for the three lots under N2are small. In the free jet condition, i.e., no substrate, there is no effect of bow shock and the finer particles are only affected by the expansion of the gas as it exits the nozzle.
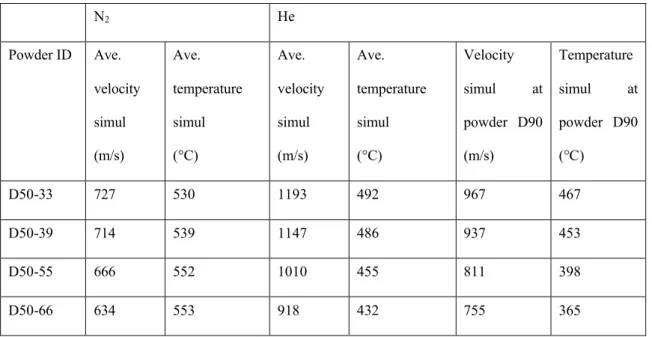
Simulations were repeated to obtain the average particle impact velocities and temperature for a standoff distance of 30 mm (standard conditions) for the four powders (Table 4), under N2 and He. These simulations are believed to be more accurate representation of the process than the in-flight particle speeds as the effect of the substrate is taken into account. Similarly to previous simulations, particles are much faster when He is used as propelling gas. Also, even though smaller lots reach higher average speed for both process gases, the difference in particle velocities from one powder lot to another is larger with He (delta of 93 m/s for N2(average velocities) vs a delta of 275 m/s for He (average velocities).
From Figure 8 illustrating the particle velocities as a function of particle diameter for simulations with and without substrate, bow shock starts to have an effect in lessening the increase in particle speed with the decrease in particle size for particles below about 20µm, and the particle speed abruptly falls for particles below 8µm. The powder D50-55 has a low amount of particles below 20 µm (only 6vol% below 20 µm), so the average value obtained for the latest simulation (Table 4) is the same as the prior simulations without substrate (Table 3); however, there is a small difference in the simulation with and without substrate for the two finer powders due to the difference in velocities of the fines (13 vol% below 20 µm for D50-33 for instance).
The average impact particle temperature is lower when He is used rather than N2due to the lower residence time in the convergent section. Interestingly enough, the trend in particle temperature vs particle size is reversed when He is used instead of N2. This is
most probably due to a combined effect of the reduced residence time in the convergent section, the effect of the increased gas velocity on the heat transfer coefficient as well as changes in the shock structure close to the substrate. In any case, the variation in impact particle temperature is relatively small.
Considering the strong relationship obtained between coating adhesion and particle size when the D90 was used in section 3.1, particle impact velocities and temperatures for the D90 of the four powder lots are also shown in Table 4 for the He process gas. Compared to average values, the delta in velocity stays the same at 30% but the delta in temperature between the finer and coarser lot is increased (102°C vs 61°C).
3.4. Coating Properties
3.4.1. Coating microstructure
Figure 9 presents the coating microstructures obtained with the different powders. All coatings are dense and sound, indicating that the small variation in particle impact velocities observed earlier with N2does not result in a change in coating microstructure. In this case, velocities achieved with N2as the process gas are to be considered as this corresponds to the spraying conditions for the actual coating buildup. Equation 1 shown earlier was used to calculate the critical velocity (νcrit) of Cu powder as a function of particle size (dp).
Simulated particle impact temperatures (Tp) were used as input in the equation. The eta (η) ratio was calculated as the particle velocity divided by the critical velocity as a function of particle size (
Figure 10 : ) [31]. Indeed, since the particle in-flight velocities are well above the critical velocity and η well above 1 for all powder sizes tested (i.e., between 3 and several hundred microns), dense coatings are obtained in all cases. Although an erosion phenomena was approximated to occur at η above 2 for several materials [31], it was not observed here, even for the very high particle velocities achieved with He (η above 3) and thus, not considered for this analysis. Etched microstructures (Figure 9) reveal that the splats from the 55 and 66 coatings are less flattened than the splats of D50-33 and D50-39, probably because of the lower particle velocities for this powder. A similar trend for individual experimental Ti splats [32] and simulated Cu splats [33] has been observed elsewhere.
3.4.2. Coating adhesion
The cold spray trials performed with the four powder lots and shown in section 3.4.1 did not show an important variation in coating microstructure with variation in particle sizes but did present significant differences in terms of coating adhesion. From Table 5, we can see that a coating adhesion well above the application requirement of 60 MPa is obtained with powders D50-33 and D50-39 (glue failure); however, lower values of 47 MPa and 26 MPa are obtained when powder D50-55 and D50-66 are used, respectively.
Meaningful imaging of fracture surfaces was found to be impractical due to the roughness induced by the grit blasting performed prior to the spray on the steel substrate; however, it has been possible to evaluate the extent of the steel fracture surface covered with Cu from EDS analysis. From an analysis of 5 fields at a magnification of 250X for each sample, 39±3% of the surface area of the D50-55 sample was found to be covered by Cu while 20±3% of the area was covered by Cu for the D50-66 sample. This ratio of half corresponds well to the ratio in adhesion obtained from the pull tests.
The steel fracture surfaces obtained from coatings sprayed on polished steel substrate surfaces were also observed under OM (Figure 11). Figure 11 (a) shows the fracture surface of a coating sprayed using the reference conditions but with N2only (no He bond coat) using Cu TLS Technik powder (d10: 35 µm, d50: 52 µm, D90: 67 µm). Spontaneous coating debonding occurred before a thickness of 1mm could be achieved. The surface is deformed due to particle impacts but a very low fraction of it contains traces of Cu. Figure 11 (b) shows the fracture surface of a coating sprayed using the reference conditions, but with a coarser Cu powder (Plasma Giken d10: 27 µm, d50: 59 µm, d90:87 µm) to ensure that the coating would fail in an adhesive mode under a pull test and expose a substrate fracture surface. The Cu traces form a clear ring showing extensive deformation. Compared to the sample produced under nitrogen, the fracture surface area covered with Cu is approximately 5 to 10 times greater. A coating bond strength of 51 ± 16 MPa was achieved for a 4.3 mm thickness coating. One has to return to the bonding mechanisms to explain this variation in coating adhesion and fracture appearance.
Discussion
4.1. Coating adhesion and bonding mechanisms
There are two main bonding mechanisms that are typically proposed for cold spray coatings: mechanical interlocking and metallurgical bonding [6]. Mechanical interlocking has been identified as the predominant bonding mechanism for low pressure cold spray of Cu on steel [34]. For this system, the adhesion is strongly related to the steel roughness prior to coating. Adhesion strength as high as 55 MPa could be achieved for 600 µm thick coatings for substrate roughness Rq above 60 µm. Early work regarding the current application [2] has shown bond strength varying up to 41 MPa for 500 µm nominal Cu coatings sprayed on grit blasted steel surfaces under varying spraying conditions with N2. No clear relation was found between particle in-flight velocities and coating adhesion for velocities varying between 475 and 825 m/s. The relatively low adhesion achieved together with the insensitivity to the particle in-flight velocities allow for us believe that mechanical interlocking is the main bonding mechanism for Cu coating sprayed on steel at particle velocities typically achieved with N2as the process gas, i.e., velocities below about 825 m/s.
Metallurgical bonding can occur if there is an intimate contact between two clean surfaces. In cold spray, there is a general agreement that adiabatic shear instability can cause the removal of contaminant layers by plastic flow and the use of pressure to force the surfaces into intimate contact [10]. From Grujicic et al. [10], simulations based on finite element analysis and shear localisation analysis predict very similar critical
velocities needed to produce shear localization for Cu on Cu (570-585m/s) vs Cu on 316L stainless steel (570-580m/s). Even though these velocities were easily achieved in the current work with N2as the process gas (i.e., when the He bond coat was not used), coatings would spontaneously debond from polished steel substrates before reaching a thickness of 1 mm. The reason for this behavior is that the critical velocities calculated above corresponded to the velocity for which shear instability was initiated and is insufficient to predict the extent of particle/substrate deformation needed to provide sufficient bonding. Figure 11 (a) shows the steel surface after spontaneous coating debonding. The surface is deformed due to particle impacts but a very low fraction of it displays traces of Cu, indicative of metallurgical bonding. The extent of adiabatic shearing will govern the fraction of the interface that is bonded, and would be a better indication of coating adhesion. For instance, it has been shown by Assadi et al. [33] that bond strength of Cu coating on Cu was about 30-40 MPa, which corresponds to 20% of the UTS of bulk Cu, for spraying conditions where the particles in-flight velocities were just above the critical velocity. This showed good agreement with their modelling work estimating that 15 to 25% of the interfacial area underwent shear instability.
In order to maximise the fraction of bonded interface, particle velocities significantly higher than the critical velocities have to be achieved. Under such conditions, i.e., an in-flight particle velocity about 20% higher than the critical velocity for the specific case of Ti, it has been shown for same substrates [32] that both the splat and the substrate deform extensively and a combined adiabatic shear process leads to an increase in the length of the conformal interface. In this regime, an increase in splat adhesion has been observed
with increasing particle velocities for Ti [32], regardless if the increased particle velocity was due to a change in spraying conditions or to a decrease in particle size. For the current application, a soft material was sprayed on a hard substrate; this is expected to change the extent of deformation of one material relative to the other. In a wipe test performed on stainless steel 304 substrates, Cu particles have been shown to deform at relatively low impacting velocity and then maintain a constant flattening ratio over a wide range of impact velocities. On the other hand, the crater volume present on the substrate has been shown to increase continuously within the window of impact velocities tested [35]. Simulation work has confirmed that early deformation, as well as the increase in temperature, in the case of dissimilar materials is concentrated in the soft counterpart, i.e., the Cu powder in the current case [36]; however, it has been shown that the bond ratio, defined as the fraction of bonded particles (deposits) to the total incident particles (craters plus deposits), was higher when both substrate and particle were comparably deformed, i.e., when the contact area was increased [36]. Figure 11 (b) is indicative of the increase in substrate deformation and resulting increase in bonded area when particle velocity is significantly raised by using He. The Cu traces forming a well delineated ring are located in the particle impact area showing higher adiabatic shear instability [7]. The increase in fracture surface area covered with Cu is consistent with the increase in coating bond strength. This is an indication that the mechanism to maximise coating adhesion is similar regardless if the substrate and particles are of the same material or if particles are sprayed on a harder substrate; however, in the latter case, much higher particle velocities are needed to ensure deformation of the hard substrate.
4.2. Coating adhesion as a function of particle velocities
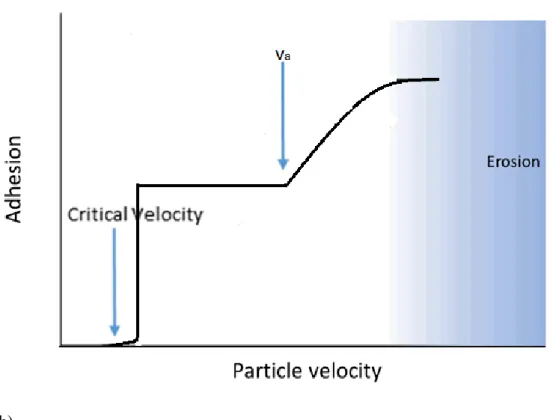
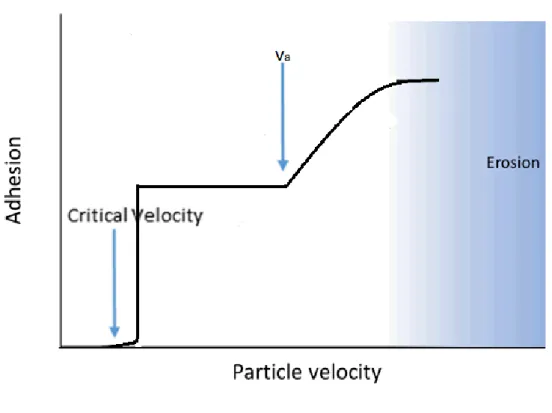
From this review of the mechanisms and of the current results, a schematic linking the particle velocities to the coating adhesion in the case of soft particle/hard substrate can be
generated first for an initially polished, or flat substrate (
(b)
Figure 12a). For low particle velocities, the bonding developed by the impacting particles is below the rebound energy of the particle and there is no coating buildup. A coating will start to build-up at the critical velocity, which will depend on the incoming particle material as well as the substrate composition. In the specific case of a soft material sprayed on a hard substrate, the critical velocity could be approximated by the velocity required to initiate adiabatic shear instability in the incoming particle. Depending on the size of the powder, this critical velocity is expected to be in the range of 500 m/s for Cu on steel [7]. At this particle velocity, deformation is concentrated in the soft particles and minimal on the hard substrate side [36]. As particle velocity is further increased, some deformation of the steel substrate starts to occur, improving extent of particle intimate contact with the substrate. Coating adhesion will increase linearly with particle speed and the increase in crater volume [32, 35]. The theoretical
upper limit for coating adhesion value is achieved when the adiabatic shear instability is extended to all particle boundaries in contact with substrate and would correspond to the tensile strength of the coating or substrate materials, depending which one is the lowest. An erosion phenomenon is also expected to play a role at some point, although it is not further discussed here as it has not been observed in the current study.
For a given initial substrate surface roughness (
(b)
Figure 12 b), mechanical interlocking is the main bonding mechanism at low particle speed. Any variation in particle velocity between the critical velocity and va will not increase coating adhesion, as the mechanical roughening induced by the incoming particles is negligible compared to the initial roughness, hence the early results showing no relationship between particle velocities and adhesion when using N2 [2]. vais the velocity for which metallurgical bonding would start to be predominant, hence a further increase in coating adhesion. It is inferred that for a specific coating adhesion level, a higher particle velocity may be required for a rough surface due to the impacting angle deviating from 90° [37].
The larger particles of D50-55 and D50-66 powders reach velocities of 811 and 755 m/s, respectively (Table 4), which is below the values for which adhesion has been shown to
be independent of particle velocities [2]. It has been shown in the section above that coarser powders have lower splat adhesion due to their lower particle speed [32]. It is inferred that the few coarser particles of the powder lots present incomplete splat bonding, i.e., regions with bad contact interface. Those regions probably act as weak points at the interface where cracks and debonding is initiated. This could indicate that a plateau could be reached in term of coating adhesion once complete bonding is achieved for all particles. Combining these results with the analysis of the adhesion as a function of D90 (Figure 2), we can define the D90 for the particles at 60 µm.
Conclusions
In the course of the development of a high performance Cu coating for corrosion protection of UFCs, it was found through data historical review that a control of fines is required to avoid gun clogging (D01 >5 µm) and control of coarse is needed to meet coating bond strength requirements of 60 MPa (D90 <60 µm). The effect of Cu powder size on coating microstructure and adhesion to steel was further investigated from the comparison of four powder lots presenting different particle size distributions but similar other powder features. Simulations show an important decrease in impact particle speed as particle size increases. This effect is accentuated when He is used as the process gas, compared to N2. Impact particle velocities were found to vary from 634 to 727 m/s with N2 process gas, which are well above the critical velocities of Cu powder. As a consequence, dense coatings have been obtained for all powders; however, coating adhesion to a steel substrate has shown great sensitivity to particle size, as the larger lots
with a D90 of 90 and 75 µm produced coating adhesion of 26 and 47MPa respectively while the two smaller lots (D90 of 49 and 54 µm) reached glue failure above 70 MPa. This was explained by the fact that high particle velocities are required for the Cu to penetrate and deform the hard steel to increase contact area and adequately bond to the substrate. A linear relationship was found between particle size (D90) and coating adhesion, explained by the decreasing particle speed for coarser particles.
Table Captions
Table 1: Copper Powder Sizes...32 Table 2: Copper Powder Composition and Hardness...32 Table 3: Particle in-flight velocities, measured and simulated, for the four powder lots (no substrate)...32 Table 4: Average simulated particle impact velocities and temperatures for the four powder lots (substrate at 30mm) ...33 Table 5: Coating Bond Strength ...33
Figure Captions
Figure 1 Spraying fixture showing circular “puck” coupons to be used for characterization and adhesion testing
Figure 2 Coating bond strength as a function of powder D10, D50 and D90 using spraying reference conditions. The different symbols represent different powder lots.
Figure 3 Lower end of the particle size distributions in number and in volume of powder D50-33. Figure 4 Effect of fines on powder lot tendency for clogging during the cold spray process. Figure 5 Powder size distributions for the four lots
Figure 6 Powder morphologies (a) D50-33 (b) D50-39 (c) D50-55 (d) D50-66 Figure 7 Powder microstructures (a) D50-33 (b) D50-39 (c) D50-55 (d) D50-66
Figure 8 Simulated particle velocities as a function of particle diameter for the two process gases studied and with and without the presence of a substrate.
Figure 10 : ŋ ratio as a function of particle size for He and N2spraying conditions.
Figure 11 Coating fracture interface (a) 1512031csB screened TLS, spontaneous bonding (b) 1503252csB with 5A23F2 51 ± 16 (A)
Figure 12 Schematic of coating adhesion as a function of particle velocity (a) polished surface and (b) roughened surface.
Table 1: Copper Powder Sizes Powder ID D10 (µm) D50 (µm) D90 (µm) D50-33 18 33 49 D50-39 19 39 54 D50-55 25 55 75 D50-66 37 66 90
Table 2: Copper Powder Composition and Hardness
Powder ID Cu (%) O (%) Hardness 1gf
D50-33 99.93 0.032 62 ± 4
D50-39 99.32 0.028 64 ± 7
D50-55 99.94 0.034 52 ± 5
D50-66 99.9 n/a 48 ± 11
Table 3: Particle in-flight velocities, measured and simulated, for the four powder lots (no substrate)
Powder ID Velocity CSM (m/s)
Velocity simul, fines below 8um removed (m/s) D50-33 N2 699 739
D50-39 N2 675 724 D50-39 He 1110 1125 D50-55 N2 675 665 D50-66 N2 n/a 627
Table 4: Average simulated particle impact velocities and temperatures for the four powder lots (substrate at 30mm)
N2 He Powder ID Ave. velocity simul (m/s) Ave. temperature simul (°C) Ave. velocity simul (m/s) Ave. temperature simul (°C) Velocity simul at powder D90 (m/s) Temperature simul at powder D90 (°C) D50-33 727 530 1193 492 967 467 D50-39 714 539 1147 486 937 453 D50-55 666 552 1010 455 811 398 D50-66 634 553 918 432 755 365
Table 5: Coating Bond Strength
Powder ID Bond Strength (MPa) Failure mode D50-33 >72 Glue D50-39 >73 Glue D50-55 47 ± 9 Adhesive D50-66 26 ± 5 Adhesive
Figure 1 Spraying fixture showing circular “puck” coupons to be used for characterization and adhesion testing
Figure 2 Coating bond strength as a function of powder D10, D50 and D90 using spraying reference conditions. The different symbols represent different powder lots.
Bond strength
requirement of 60MPa Glue Failure
Figure 3 Lower end of the particle size distributions in number and in volume of powder D50-33.
Figure 4 Effect of fines on powder lot tendency for clogging during the cold spray process.
(a)
(c)
(d)
(a)
(c)
(d)
Figure 8 Simulated particle velocities as a function of particle diameter for the two process gases studied and with and without the presence of a substrate.
1511262csB (c) (d)
1511261csB (e) (f)
1510151csB (g)
Figure 9 Coating microstructures (a-b) D50-33 (c-d) D50-39 (e-f) D50-55 (g-h) D50-66
(b)
Figure 11 Coating fracture interface (a) 1512031csB screened TLS, spontaneous bonding (b) 1503252csB with 5A23F2 51 ± 16 (A)
(a)
Figure 12 Schematic of coating adhesion as a function of particle velocity (a) polished surface and (b) roughened surface.
REFERENCES
[1] P. Vo, D. Poirier, J.-G. Legoux, E. Irissou and P. Keech, Application of Copper Coatings onto Used-Fuel Canisters for the Canadian Nuclear Industry, High Pressure Cold Spray: Principles and Applications, ASM International 2016, p 253-276
[2] P. Vo, D. Poirier, J.-G. Legoux, P.G. Keech, D. Doyle, P. Jakupi and E. Irissou, Development of Cold Spray Technology for Copper Coating of Carbon Steel Used Fuel Container Prototypes for CANDU fuel, Nuclear Waste Management organization, 2015, p 64
[3] X.-J. Ning, J.-H. Jang and H.-J. Kim, The effects of powder properties on in-flight particle velocity and deposition process during low pressure cold spray process, Appl.
Surf. Sci., 2007, 253(18), p7449-7455
[4] T. Hussain, S. Yue and C.J. Li, Characteristics of Feedstock Materials, Modern Cold Spray; Materials, Process and Applications, Springer, 2015, p 73-105
[5] T. Schmidt, F. Gaertner and H. Kreye, New developments in cold spray based on higher gas and particle temperature, J. Therm. Spray Technol., 2006, 15(4), p 488-494 [6] P. King, M. Yandouzi and B. Jodoin, The Physics of Cold Spray, Modern cold spray; Materials, Process and Application, J. Villafuerte, Springer, 2015, p 44-67
[7] T. Schmidt, H. Assadi, F. Gärtner, H. Richter, T. Stoltenhoff, H. Kreye and T. Klassen, From Particle Acceleration to Impact and Bonding in Cold Spraying, J. Therm.
Spray Technol., 2009, 18(5), p 794
[8] T. Stoltenhoff, H. Kreye, and H.J. Richter An Analysis of the Cold Spray Process and Its Coatings, J. Therm. Spray Technol., 2002, 11(4), p 542-550
[9] J. Lee, S. Shin, H.J. Kim and C. Lee, Effect of gas temperature on critical velocity and deposition characteristics in kinetic spraying, Appl. Surf. Sci., 2007, 253 (7), p 3512-3520
[10] M. Grujicic, C.L. Zhao, W.S. DeRosset and D. Helfritch, Adiabatic shear instability based mechanism for particles/substrate bonding in the cold-gas dynamic-spray process, Mater. Design, 2004, 25, p 681–688
[11] T. Schmidt, F. Gärtner, H. Assadi and H. Kreye, Development of a generalized parameter window for cold spray deposition, Acta Mater., 2006, 54(3), p 729-742
[12] D.L. Gilmore, R.C. Dykhuizen, R.A. Neiser, T.J. Roemer and M.F. Smith, Particle velocity and deposition efficiency in the cold spray process, J. Therm. Spray Technol., 1999, 8(4), p 576-82
[13] C.J. Li, W.Y. Li, Y.Y. Wang, G.J. Yang and H. Fukanuma, A theoretical model for prediction of deposition efficiency in cold spraying, Thin Solid Films, 2005, 489(1-2), p 79-85
[14] F. Palacios, M.R. Colonno, A.C. Aranake, A. Campos, S.R. Copeland, T.D. Economon, A.K. Lonkar, T.W. Lukaczyk, T.W.R. Taylor and J.J. Alonso, Stanford University Unstructured (SU 2): an open-source integrated computational environment for multi-physics simulation and design, 51st AIAA Aerospace Sciences Meeting
[15] T.D. Economon, F. Palacios S.R. Copeland, SU2: an open-source suite for multiphysics simulation and design, AIAA J., 2015, 54(3), p 828-846
[16] T.D. Economon, F. Palacios, J.J. Alonso, G. Bansal, D. Mudigere, A. Deshpande, A. Heinecke and M. Smelyanskiy, Performance optimizations for scalable implicit RANS calculations with SU2." Comput. Fluids, 2016, 129, p 146-158
[17] F.L. Menter, Zonal two equation kw turbulence models for aerodynamic flows. In23rd fluid dynamics, plasmadynamics, and lasers conference 1993 Jul (p. 2906).
[18] C. Geuzaine and J.F. Remacle, Gmsh: A 3-D finite element mesh generator with built-in pre-and post-processing facilities, Int. J. Numer. Method. Eng. 2009, 79(11) p 1309-1331
[19] B. Blais, M. Lassaigne, C. Goniva, L. Fradette and F. Bertrand, Development of an unresolved CFD–DEM model for the flow of viscous suspensions and its application to solid–liquid mixing, J. Comput. Phys., 2016, 318(1), p 201-221
[20] B. Blais, O. Bertrand, L. Fradette and F. Bertrand, CFD-DEM simulations of early turbulent solid–liquid mixing: Prediction of suspension curve and just-suspended speed.
Chem. Eng. Res. Des., 2017, 123, p 388-406
[21] B.Samareh, O. Stier, V. Lüthen, A. Dolatabadi, Assessment of CFD modeling via flow visualization in cold spray process, J. Therm. Spray Technol., 2009, 18(5-6), p 934-943
[22] J.R. Davis, A.S.M.I.H. Committee, Copper and Copper Alloys, ASM International 2001
[23] C.J. Li, H.T. Wang, Q. Zhang, G.J. Yang, W.Y. Li and H.L. Liao, Influence of spray materials and their surface oxidation on the critical velocity in cold spraying, J. Therm.
Spray Technol., 2010, 19(1/2), p 95-101
[24] K.H. Ko, J.O. Choi, H. Lee and B.J. Lee, Influence of oxide chemistry of feedstock on cold sprayed Cu coatings, Powder Technol., 2012, 218, p 119-123
[25] K. Kang, S. Yoon, Y. Ji and C. Lee, Oxidation dependency of critical velocity for aluminum feedstock deposition in kinetic spraying process., Mater. Sci. Eng. A, 2008,
486(1-2), p 300-307
[26] S. Yin, X. Wang, W. Li, H. Liao and H. Jie, Deformation behavior of the oxide film on the surface of cold sprayed powder particle, Appl. Surf. Sci., 2012, 259, p 294-300 [27] W.-Y. Li, C.-J. Li and H. Liao, Significant influence of particle surface oxidation on deposition efficiency, interface microstructure and adhesive strength of cold-sprayed copper coatings, Appl. Surf. Sci., 2010, 256(16), p 4953-4958
[28] A.S. Taha and F.H. Hammad, Application of the Hall-Petch Relation to Microhardness Measurements on Al, Cu, Al-MD 105, and Al-Cu Alloys, Phys. Status
Solidi A, 1990, 119, p 455-462
[29] R. Huang and Fukanuma, Study of the Influence of Particle Velocity on Adhesive Strength of Cold Spray Deposits, J. Therm. Spray Technol., 2012, 21(3-4), p 541-549 [30] John David Anderson, Modern compressible flow: with historical perspective. Vol. 12, New York: McGraw-Hill, 1990
[31] H. Assadi, T. Schmidt, H. Richter, J. Kliemann, K. Binder, F. Gärtner, T. Klassen, H. Kreye, On parameter selection in cold spraying, J. Therm. Spray Technol., 20 (2011), p 1161-1176
[32] D.Goldbaum, J. M. Shockley, R.R. Chromik, A. Rezaeian, S. Yue, J.G. Legoux and E.Irissou, The Effect of Deposition Conditions on Adhesion Strength of Ti and Ti6Al4V Cold Spray Splats, J. Therm. Spray Technol., 2012, 21(2), p 288-303
[33] H. Assadi, F. Gartner, T. Stoltenhoff and H. Kreye, Bonding mechanism in cold gas spraying, Acta Mater., 2003, 51(15), p 4379-4394.
[34] A. Nastic, B. Jodoin, R. Fernandez, D. MacDonald, M.Vijay, A. Tieu, W. Yan, B. Daniels and M. Xu, Enhancement of adhesion strength of thick copper coatings on used nuclear fuel steel containers prepared with the forced pulsed waterjet (FPWJ), technical report taken from www.vln-tech.com.
[35] R.C. Dykhuizen, M.F. Smith, D.L. Gilmore, R.A. Neiser, X. Jiang and S. Sampath, Impact of High Velocity Cold Spray Particles, J. Therm. Spray Technol., 1999, 8(4), p 559-564
[36] G. Bae, Y. Xiong, S.Kumar, K. Kang and C. Lee, General aspects of interface bonding in kinetic sprayed coatings, Acta Mater., 2008, 56(17), p 4858-4868
[37] A. Nastic, M. Vijay, A. Tieu, S. Rahmati and B. Jodoin, Experimental and Numerical Study of the Influence of Substrate Surface Preparation on Adhesion Mechanisms of Aluminum Cold Spray Coatings on 300M Steel Substrates, J. Therm.