HAL Id: hal-00797055
https://hal.archives-ouvertes.fr/hal-00797055
Submitted on 5 Mar 2013HAL is a multi-disciplinary open access archive for the deposit and dissemination of sci-entific research documents, whether they are pub-lished or not. The documents may come from teaching and research institutions in France or abroad, or from public or private research centers.
L’archive ouverte pluridisciplinaire HAL, est destinée au dépôt et à la diffusion de documents scientifiques de niveau recherche, publiés ou non, émanant des établissements d’enseignement et de recherche français ou étrangers, des laboratoires publics ou privés.
Radial Variations of Vibrational Properties of Three
Tropical Woods
Tian Zhang, Shu-Lin Bai, Sandrine Bardet, Tancrède Alméras, Bernard
Thibaut, Jacques Beauchêne
To cite this version:
Tian Zhang, Shu-Lin Bai, Sandrine Bardet, Tancrède Alméras, Bernard Thibaut, et al.. Radial Variations of Vibrational Properties of Three Tropical Woods. Journal of Wood Science, Springer Verlag, 2011, 57 (5), pp.377-386. �10.1007/s10086-011-1189-7�. �hal-00797055�
Article publié à citer :
Zhang T., Bai S.-L., Bardet S., Alméras T., Thibaut B., Beauchêne J. (2011) Radial Variations of Vibrational Properties of 3 Tropical Woods, Journal of Wood Science, vol. 57, 377-386.
Radial Variations of Vibrational Properties of Three
Tropical Woods
Tian Zhang 1, Sandrine Bardet 2, Shu-Lin Bai 1 *, Jacques Beauchêne 3, Tancrède Alméras 2, Bernard Thibaut 2
1. Department of Advanced Materials and Nanotechnology, College of Engineering, Peking University, Beijing 100871, China
2. Laboratoire de Mécanique et Génie Civil (LMGC), Université Montpellier 2, CNRS UMR-5508, CC 048-Place Eugène Bataillon, 34095 Montpellier Cedex 5, France
3. CIRAD, UMR Ecofog, BP 701, 97387 Kourou Cedex, Guyane française, France
*. Corresponding author: Tel.: +86 10 6275 3328. Fax: +86 10 6275 7563. E-mail address: [email protected]
Abstract
Radial trends of vibrational properties, including the specific dynamic modulus (E’/ρ) and damping coefficient (tanδ), were investigated for 3 tropical rainforest hardwood species,
Simarouba amara, Carapa procera and Symphonia globulifera by free-free flexural vibration
test. The microfibril angle (MFA) was estimated through X-Ray diffraction. Consistent patterns of radial variations were observed for all studied properties. E’/ρ was found to decrease from pith to bark, which is strongly related to the increasing pith-bark trend of MFA. The variation of tanδ along the radius can be partly explained by MFA, and partly by the gradient of extractives due to heartwood formation. The coupling effect of MFA and extractives could be separated through the analysis of log(tanδ) – log(E’/ρ) diagram. For the studied species, the extractive content putatively associated to heartwood formation generally tends to decrease the wood damping coefficient. However, this weakening effect of extractives was not observed for inner part of the heartwood, suggesting the mechanical action of extractives was reduced during their chemical ageing.
Key words: tropical woods, vibrational properties, dynamic modulus, damping coefficient, microfibril angle, extractives, wood ageing
Introduction
The diversity of wood mechanical properties depends on genetic and environmental factors, and is found at all levels between: gymnosperms and angiosperms, tropical and temperate trees, species of any of these groups, populations of a given species, trees of a given population, and finally sampling locations within a single tree. The within-tree variability is of special interest because it is often found larger than the between-tree variability, and cannot easily be reduced or manipulated since it results from ontogenetic gradients. Understanding this diversity and its link with wood structure and chemical composition is an important issue in order to find optimal use for each kind of wood.
Wood is a natural composite material composed of cellulose, hemicelluloses, lignin and small amount of extractives. A large part of cellulose is present in a crystalline state in the form of microfibrils. The microfibrils can be considered to be elastic and wind spirally around the cell wall axis, at an angle termed as the microfibril angle (MFA). MFA has been found to be an important microstructural factor influencing wood mechanical properties (Côté, 1981; Bodig and Jayne, 1993; Dinwoodie, 2000). Hemicelluloses and lignin mix together and distribute inside the cell wall. This mixture forms a matrix considered to be viscoelastic and the main source of energy dissipation in wood. Extractive compounds are present mainly in the heartwood and in lower quantity compared with the other wood structural constituents. These secondary constituents are determinant for some wood properties, such as color and durability. Additionally, they have been shown to influence wood viscoelastic behavior (Matsunaga et al., 1999; Brémaud et al., 2010a; Brémaud et al., 2010c; Minato et al., 2010), although this effect differs from case to case: some extractives induce a strong decrease of the damping coefficient, while some other slightly increase it (Obataya et al., 1999), and some have limited effect (Sakai et al., 1999).
The microfibrils represent about 45% of the wood in weight and are by far the stiffest constituent. Much work has been carried out on the relation between MFA and mechanical properties (Cowdrey and Preston, 1966; Cave and Walker, 1994; Färber et al., 2001). It is found that the mechanical properties of wood in grain direction are improved when the MFA decreases. In fact, a wood cell wall can be considered as a fiber-reinforced composite (Cave, 1968), therefore the mechanical properties along microfibril direction are superior to other directions. On the other hand, MFA is also found to be an important factor in determining wood viscoelastic properties: in dry wood, a positive relation is generally found between MFA and the damping coefficient (tanδ) obtained by dynamic tests (Norimoto et al., 1986), and in quasi-static creep test, the creep compliance is found to be strongly related to MFA (Gril et al., 2004; Kojima and Yamamoto, 2004). In fact, it is a usual methodology to compare directly the dynamic modulus and damping coefficient in evaluating the acoustic properties of woods. A strong negative correlation has repeatedly been observed between E’/ρ and tanδ (Ono and Norimoto, 1983; Aizawa et al., 1998; Obataya et al., 2000). A “standard relation” was established to describe the statistical relation between these properties (Ono and Norimoto, 1983), based on more than 1000 specimens taken from 20 softwood species. The validity of this relation has also been shown on hardwood species (Brémaud et al., 2010a). Recently, using selective extractions, Brémaud et al. (Brémaud et al., 2010a; Brémaud et al., 2010b) showed that wood extractives modified this “standard relation” by changing the intercept of the line, not its slope.
A large part of the within-tree diversity in wood properties occurs in the radial direction (Zobel and van Buijtenen, 1989). In fact, variations along the radius result from the superposition of two gradients. The first gradient is related to the effect of cambial age (Lenz et al., 2010). A piece of wood near the pith was produced by a younger cambium compared to
that near the bark, which brings on the changes in microstructure, particularly in MFA. The second gradient is related to the distinction between sapwood and heartwood (Bamber, 1976). Peripheral wood is physically young, and remains functional for contributing to the conduction of sap. When it gets physically older (i.e., wood in inner locations), it loses its functional hydraulic properties and is subjected to the deposition of extractives, becoming heartwood. From outside rings to inside rings in the heartwood, there is a chemical ageing of the extractives and their bioactivity is known to decrease strongly for old trees: inner heartwood is much less resistant to rot than outer heartwood (Amusant et al., 2004).
In the present study, wood specimens were prepared from 3 tropical rainforest hardwood species along radial direction of the trunks, in order to include a large diversity of microstructures (radial position) and secondary extractive content (heartwood/sapwood). X-ray diffraction tests and free-free flexure vibration tests were undertaken and the vibrational properties were analyzed with respect to MFA and sample locations, aiming at a better understanding how the variations of MFA and extractives affect wood’s viscoelastic properties.
Materials and experimental methods
Wood materials
The 3 tropical rainforest hardwood species chosen for this study are Simarouba
amara, Carapa procera and Symphonia globulifera, abbreviated to be Sa, Cp and Sg,
respectively. Cp is widely used for cabinetwork in South America. Sa is used traditionally by Marons people for making objects since its dry wood has a good resistance to termites. The average specific gravity (wood density over water density), ρ, and weight fraction of the components of the three species obtained from the Mariwenn database (Ollivier, 2007) are listed in Table 1. One tree of each species, with diameter at breast height ranging from 50 cm to 75 cm, was taken at the Paracou experimental forest (Kourou, French Guiana) in October 2008. The wood logs, after cutting from trees, were conditioned for six months at 26°C and 65% relative humidity before the tests. The moisture content measured after vibrational test was approximately 10.7% on average, without significant variations between species.
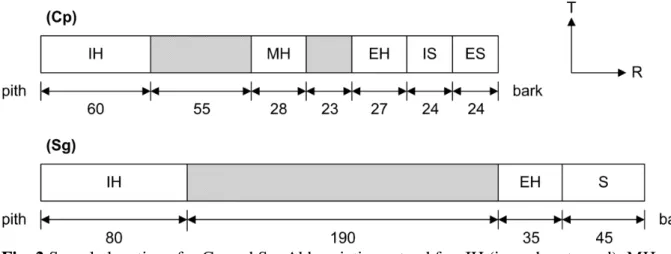
Wood specimens (2×8×200 mm) were machined as close as possible (<5°) to the grain direction. Specimens were taken at different radial positions according to two sampling schemes, as shown in Fig. 1. Specimens of Cp and Sg were machined from tangential boards taken at different distances to the pith. They were grouped as heartwood and sapwood, and further classified as inner, middle and external subgroups according to their original positions on the stem cross-section, as shown in Fig. 2. This sampling method provides information on the radial position of wood specimens, which suggests not only the microstructural variations (MFA was evaluated afterwards), but also the chemical difference. The separation between heartwood and sapwood offers a valid background for discussing the relations between wood properties and putative extractive content. For the species Sa, the heartwood cannot be separated from sapwood by visual assessment. Therefore, specimens were taken at different positions from a single radial board (Fig. 1), without separating into different groups. It should be noted that although both sampling schemes yield longitudinal specimens giving the properties along the grain direction, those of Cp and Sg woods are in the L-R plane, while those of Sa are in the L-T plane. Table 2 gives the numbers of specimens tested in this study.
Table 1 Specific gravity and weight fraction of components of the studied species, from Mariwenn database. N.A. means the data are not available.
Species Specific Gravity Cellulose content (wt%) Hemicellulose content (wt%) Lignin content (wt%) Extractive content (wt%) Simarouba amara 0.391 48 13 33 2.0+2.5
Carapa procera 0.655 40 N.A. 33 12.6+2.0
Symphonia globulifera 0.709 47 24 24 5.0+1.0
Fig. 1 Geometric description showing the direction and dimension of two sampling schemes. Dimensions are in millimeter
Fig. 2 Sample locations for Cp and Sg. Abbreviations stand for: IH (inner heartwood), MH (middle heartwood), EH (external heartwood), S (sapwood), IS (inner sapwood), ES (external sapwood). All dimensions are in millimeter
Table 2 Numbers of tested specimens in free-free flexural vibration test for each group
Species Heartwood Sapwood
Inner Middle External Inner External
Carapa procera 16 20 24 16 18
Symphonia globulifera 20 12 21 23
Simarouba amara 35
Vibrational properties measurements
The vibrational properties, represented by the specific dynamic modulus and the damping coefficient, were experimentally characterized. The specific dynamic modulus, E’/ρ, is the ratio of dynamic elastic modulus to density. It represents the amount of wood stiffness generated by a given amount of cell-wall material, and is therefore a measure of cell-wall quality (depending only on its chemistry and microstructure, not on the amount of cell-wall present in wood). The damping coefficient, tanδ, is representative of the wood dissipative behavior. These properties were measured by free-free flexural vibration method (Hearmon, 1958), using an apparatus previously described (Brémaud et al., 2009; Brémaud et al., 2010c).
E’/ρ was calculated from the resonance frequency of the first vibration mode based on Euler-Bernoulli beam theory such as,
2 4 2 4 2 48 E l f m h π ρ ′ = (1) where l, h are the length and thickness of the specimen, respectively, f is the resonance frequency of the first vibration mode and m is the corresponding vibration constant, which is 4.73 for the first vibration mode. The resonance frequencies excited in this study ranged from 230 to 340 Hz. The value of tanδ was calculated from the linear regression of decay curve. Three measurements were performed for each specimen to get the average value.
Mean microfibril angle (MFA) measurements
The selected wood specimens were characterized with X-Ray diffraction (XRD) to determine the MFA. Wood sections of 2mm-thick were mounted on a sample holder and inserted into an XRD instrument (Gemini-S, Oxford Diffraction) equipped with a Cu source (monitored at 50 kV and 25 mA) and a CCD camera. XRD patterns were recorded along the longitudinal direction of the sample perpendicular to the incident beam, with an exposure time of 15 s. The azimutal pattern of the diffraction arc associated to the (200) crystal plane of cellulose was obtained by integrating the full pattern for angles 2θ = 20° to 24°. The MFA was calculated from these azimutal patterns using Cave’s method: the so-called “T-angle” was determined as half of the span separating the intersections of the tangents at the inflexion points of the peak with the baseline (Cave, 1966, 1997), and the MFA was estimated as 0.6×T. Several authors (Yamamoto et al., 1993; Kretschmann et al., 1997; Ruelle et al., 2007) have shown that this estimation is well correlated to the real mean MFA of wood measured with optic methods. However, the relation between this estimated and the real value is not always 1:1 and sometimes non-linear, and the calibration coefficients depend on species. For one of the studied species (Sa), the calibration was found in the literature (Ruelle et al., 2007), but for other species, as no calibration data could be referred to, we used the raw value of Cave’s estimation. Considering the MFA variability within a specimen, four sections were cut from each selected specimen and the average value was used to represent the estimated mean MFA of this specimen.
Results and discussion
Diversity in vibrational properties
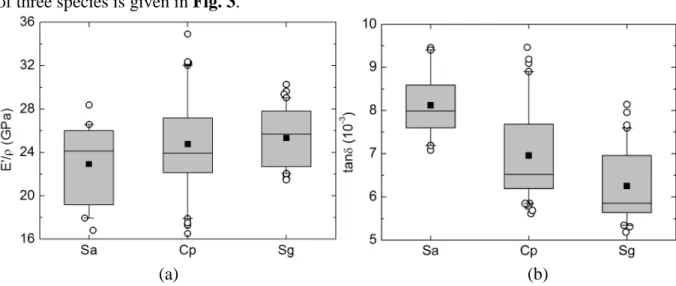
Although all studied trees grew in similar conditions, large variations of wood properties are found: the specific dynamic modulus E’/ρ ranges from 16 to 35 GPa, and the damping coefficient tanδ from 5×10⁻³ to 9.5×10⁻³. This variability is due to the variations in wood microstructure and chemistry between species and within trees. A general comparison of three species is given in Fig. 3.
(a) (b)
Fig. 3 Comparison of vibrational properties (a) E’/ρ and (b) tanδ among 3 studied species. Square dot indicates the average value of the property, the box indicates the median and quartiles, whiskers indicate 5% and 95% quartiles, and circles indicate the outlying values
Analysis of variance shows that the differences between species are significant (p value = 0.022 for E’/ρ and p value < 0.001 for tanδ). Large variations of measured properties are observed within all three species, which are mainly due to the difference of sample cutting locations. This within-tree variability represents 83% of the total variance for E’/ρ and 47% for tanδ. It is noteworthy that the species are clearly different from each other by observing the data of tanδ whereas they cannot be distinguished so evidently regarding the data of E’/ρ. The better discriminating ability of damping coefficient, compared with the specific modulus, was also previously found in comparing woods from 13 botanical families (Brémaud et al., 2009).
Radial trends of vibrational properties and MFA
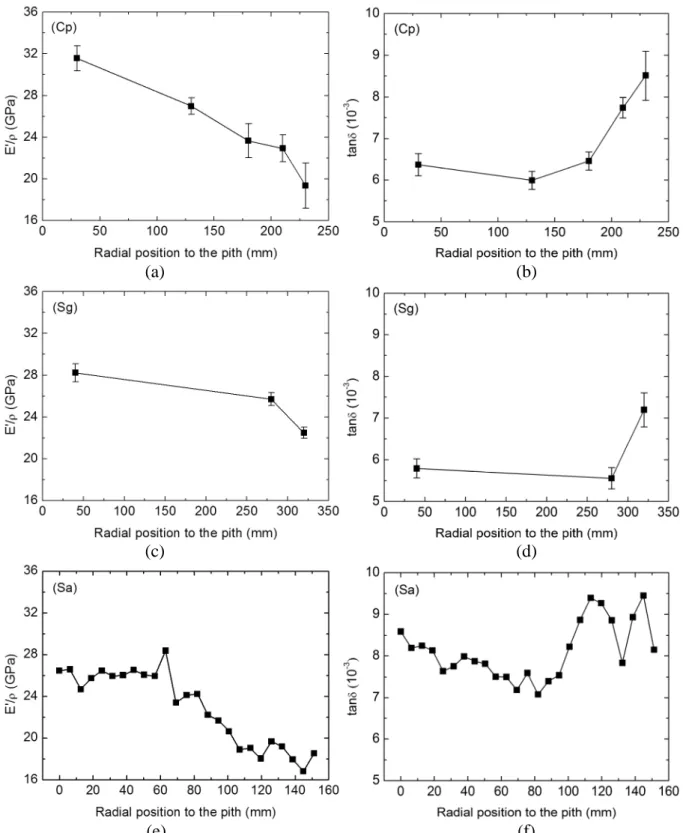
Radial variations of E’/ρ and tanδ are examined for all species (Fig. 4). Generally,
E’/ρ decreases from pith to bark, whereas tanδ shows a reversed tendency. For species Cp, each point represents an average value of 15-25 specimens, therefore a continuous decrease of
E’/ρ along radius is convincing. Regarding tanδ, a distinguishable two-step variation is clear, matching with the separation between heartwood and sapwood. For the species Sg, although only three average points are obtained, the patterns of E’/ρ and tanδ are similar to the case of Cp.
These radial patterns can be applied to Sa as well, and furthermore, provide a reference for classifying Sa specimens, which cannot, as previously mentioned, be grouped by visual assessment. Specifically, the value of E’/ρ keeps almost constant when the distance to
pith is smaller than about 60 mm and then decreases until the bark. From the tanδ data, it seems also that there exist two groups, i.e., a moderate decrease of tanδ from pith to about 80 mm, and then increase. This threshold distance of 60-80 mm is used afterwards to classify Sa specimens into “inner” and “outer” groups, and a hypothesis is made that these two groups are different in their extractive contents.
(a) (b)
(c) (d)
(e) (f)
Fig. 4 Radial trends of vibrational properties E’/ρ (a, c, e) and tanδ (b, d, f) for species Cp, Sg and Sa, respectively. For species Cp and Sg, each point represents the mean value of 15-25 specimens and the error bar indicates the standard deviation
Radial variation of vibrational properties is actually a reflection of growth history of the tree. During tree growth, ontogenetic and environmental condition changes determine its microstructural features (such as fiber length, cell wall thickness and MFA), as well as its chemical constitution (molecular configuration, volume fraction of each constituent, extractives content). The microstructures and chemical constitution then endow the wood with varied properties along the radius.
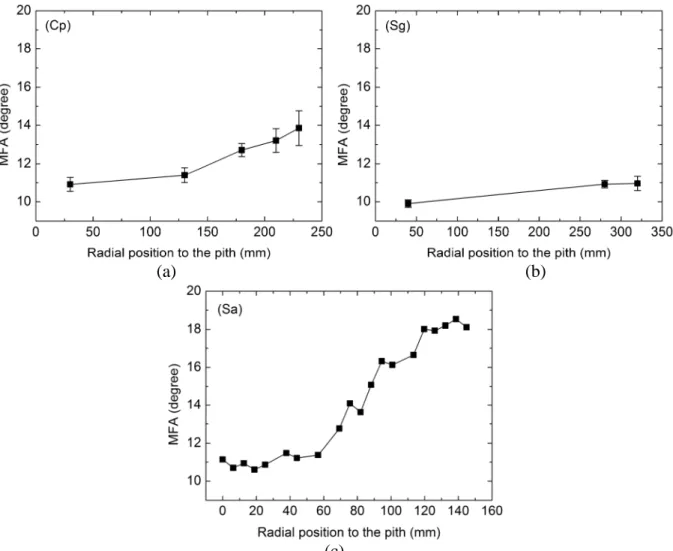
The radial trend of MFA is shown for all species in Fig. 5. An increasing trend of MFA from the pith to bark is found for all three species. It is noticed that MFA of Sa increases slowly when the distance to pith is below about 60 mm, and then quickly over 60 mm. This behavior is similar to that of E’/ρ previously noticed (Fig. 4), which confirms the validity of the classification of Sa specimens. From pith to bark, the MFA of Sa rises about 64%, while the MFA of Cp shows a continuously moderate rise, i.e., 27% increase, and that of Sg is only about 10%.
(a) (b)
(c)
Fig. 5 Radial trends of MFA for species (a) Cp, (b) Sg and (c) Sa. For species Cp and Sg, each point is the mean value of selected specimens and the error bar indicates the standard deviation
In all three studied species, we found that the MFA increases and the specific modulus decreases from the pith towards the bark. This trend is opposite to that usually observed in temperate trees, where the juvenile wood is generally found with a larger MFA and a lower specific modulus than the mature wood (Cowdrey and Preston, 1966; Saren et al., 2004). This opposite trend was already noticed for other species of rainforest trees (Thibaut et al., 2006). A tentative explanation can be given from the viewpoint of tree biomechanics. The usual interpretation of the trend observed in temperate trees is that young trees need a wood with high deformability in order to allow their stem bend without breaking in response to wind loads. This high deformability is provided by a large MFA, and results in a low specific modulus. In later stages, when the tree becomes larger, it needs high stiffness in order to resist its own weight and wind forces (Lichtenegger et al., 1999; Reiterer et al., 1999). This high stiffness is provided by a smaller MFA inducing a higher specific modulus. In contrast, in the tropical rainforests which are in general very dense, i.e., the trees are growing close to each other, the main constraint for the growth of young trees is the poor light availability. Young trees need to achieve sufficient height to receive sunlight. On the other hand, the high density of the forest protects trees from being damaged by external forces, like wind blowing. This condition makes young trees grow preferentially in height, instead of growing in diameter. In order to prevent from buckling caused by its own weight, the young cambium produces trees with a stiff wood (low MFA). In later stages, when the tree is closer to reach the canopy, radial growth becomes quicker and stem stiffness is achieved by a large diameter rather than by a very low MFA.
Relation between vibrational properties, MFA and heartwood formation
The vibrational properties are examined with respect to MFA in Fig. 6. The specific dynamic modulus shows a good correlation with MFA for each tested species (the coefficient of determination of the linear regressions are R2 = 0.80, 0.59 and 0.93 for Cp, Sg and Sa respectively). This relation has repeatedly been observed in other species (Cave and Walker, 1994) and can be expected from micromechanical considerations (Adams and Bacon, 1973; Suarez et al., 1986) and corresponds to the reinforcing effect of cellulose microfibrils: the more they align with the fiber axis, the more efficient this reinforcement is. However, the fact that regression slopes depend on species can not be explained from micromechanical perspective. In fact, same slope should be expected for woods with close cellulose content even if they belong to different species, which is the case between our sampled trees (Table 1). One possible explanation for the different relation between E’/ρ and MFA is traced back to the measurement of MFA. As previously mentioned, the estimation of MFA using X-Ray diffraction may be submitted to a bias that depends on species. Therefore, the observed differences in slope are more likely due a calibrations bias in the MFA estimation (in particular for species Sg and Cp). On the other hand, within each species, this relation applies equally to different wood types, suggesting that the wood type (which associates the differences in extractive content) is not a determinant factor of the specific modulus compared to MFA.
(a) (b)
(c) (d)
(e) (f)
Fig. 6 Dependence of E’/ρ (a, c, e) and tanδ (b, d, f) on MFA. IH: inner heartwood, MH: middle heartwood, EH: external heartwood, IS: internal sapwood, ES: external sapwood, S:
sapwood.
From Fig.6 b, d and f, the linear regression shows that the influence of MFA on damping coefficient tanδdepends on species: it is stronger for Cp (R² = 0.63), weaker for Sg (R² = 0.11) and not significant for Sa. A significant relation is however also found for Sa if only the “outer” group is examined. The relationship between tanδ and MFA can also find its explanation from the theory of micromechanics: the dissipative ability of wood is mainly due
to the viscoelastic nature of the amorphous matrix, and the contribution of the matrix to the behavior in fiber direction is larger when MFA is large, so the damping coefficient is expected to increase along with MFA. However, unlike the specific modulus, the damping coefficient significantly depends on other parameters than the MFA, namely the viscosity of matrix. This is the reason why a data scattering is more obvious for tanδ than E’/ρ (Fig. 6). The viscoelasticity of matrix material has its origin from the main polymers and can be modified by the presence of extractives. Inside a same species, it is reasonable to suppose that radial variations in polymer content and configuration are lower than radial variations in extractive content. Therefore, we assume that extractives are responsible for the variations of viscoelastic properties between our specimens. The influence of extractives on damping coefficient was also revealed by other researchers (Matsunaga et al., 1999; Obataya et al., 2000; Brémaud et al., 2010a; Minato et al., 2010), by changing the extractive content either through extraction or impregnation.
Relation between specific modulus and damping coefficient
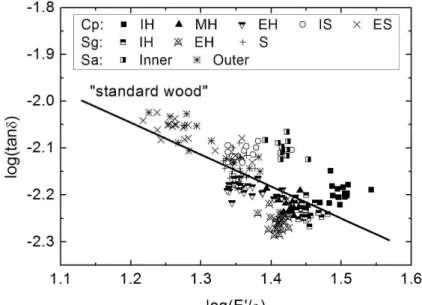
A linear relation between log(tanδ) and log(E’/ρ) proposed by Ono and Norimoto (Ono and Norimoto, 1983), based on the study on more than 1000 specimens of 20 softwood species, is addressed here as “standard relation” and expressed by,
(
)
log tanδ 1.23 0.68 log E ρ
′
1 2
= − − 3 4
5 6 (2)
For the purpose of comparison, the curve of equation (2) is plotted in Fig. 7, together with the values obtained from our species. Linear regression based on all the data is performed first, in order to check the validity of “standard relation”. The resulting slope is -0.72±0.10, which is in a rather good agreement with the standard one (-0.68). For each species, linear regressions are performed as well and it is found that the slope is comparable with the standard one when the experimental data cover a relatively wide range of specific dynamic modulus, like in the case of Cp (-0.62±0.11), although different numerical values are obtained for species with a narrower range of E’/ρ variations, like for Sa (-0.33±0.17) and Sg (-0.98±0.21). A conclusion can be drawn here that “standard relation” describes quite well the relation between tanδ and
E’/ρ, regardless of wood species, radial position and chemical compound.
Fig. 7 Log(tanδ) – log(E’/ρ) diagram for all studied species. The “standard wood” indicates the line defined by “standard relation”
As shown in previous section, E’/ρ and MFA are strongly correlated. In other words, the variation of E’/ρ is equivalent to that of MFA and even more precise, considering the measurement bias of MFA. Therefore, by the log(tanδ) – log(E’/ρ) relation, the damping coefficient can be, to a certain extent, related to wood microstructures. Following this argument, the coefficient in front of E’/ρ in equation (2), the slope, can be considered as the influence of MFA on tanδ. On the other hand, the intercept, which indicates how far the actual tanδ deviates from the MFA-prediction part, reflects the influence of chemistry, the extractives in our case. Proof can be found from the study of Brémaud et al. (2010a), who performed extraction on African Padauk wood and compared the vibrational properties before and after the extraction. It turned out that only the intercept changed while the slope was identical. Based on this observation, it is reasonable to ascribe intercept changes to changes in extractives content.
To clarify our point, Fig. 8 shows a diagram of the interpretation of log(tanδ) – log(E’/ρ) relation. It is considered that the relation is affected by both MFA and chemical components of the woods. Along the curve with increasing specific modulus, the damping coefficient decreases, which is in fact caused by the increase of MFA. Changes of the intercept of this relation (i.e., translations of the line) mean that the woods with the same specific modulus can exhibit different damping properties, which suggests a change of matrix viscosity. In other words, the extractives affect strongly wood viscoelastic properties (damping coefficient) while they have a minor effect on elastic properties along the grain (specific modulus) (Matsunaga et al., 1999; Brémaud et al., 2010b; Minato et al., 2010).
Fig. 8 Principle of the interpretation of log(tanδ) – log(E’/ρ) diagrams used by several authors Based on this hypothesis, wood specimens can be regrouped according to the difference between experimental tanδ and “standard” one predicted by equation (2), assuming that that these new groups should actually reflect the dependence of damping coefficient on the chemistry of matrix. Distances to “standard relation” (DSR) were previously found to be correlated to extractives content on 25 tropical hardwoods (Brémaud et al., 2010c) and to be quite good descriptors of species classification (Brémaud et al., 2009). DSR for each group of woods in this study is indicated in Fig. 9.
Fig. 9 Average and 95% confidence interval of the DSR for each group
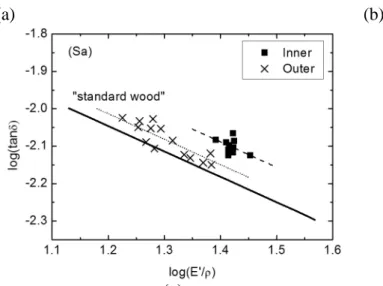
For species Cp, middle heartwood and external heartwood are not significantly different and can be grouped together (Fig. 9). This suggests that they have approximately the same “mechanically active” extractives. Based on this result, linear regression with the slope fixed to be -0.68 is performed for new groups (Fig. 10). The groups MH and EH of Cp are therefore on the same line since their chemical constituents are quite similar, but locate at different position on the curve for the reason that their MFAs are different. By the same process, inner sapwood, external sapwood and inner heartwood can be grouped together (Fig. 9). The inner heartwood, surprisingly, falls into the group of sapwoods. This could mean that the oldest extractives in the inner heartwood are no more mechanically active, like it was shown for biologically active extractives on other species (Rudman, 1966). The other possible explanation is less extractive content in inner heartwood (Nault, 1988; Saito et al., 2008). Since we didn’t perform extraction on our specimen, it is still an open question. On the other hand, the polymeric constituents vary along the radial direction, which may also be the reason of damping variation. The same observation can be done for Sg (Fig. 10), only except that the ageing of inner heartwood mechanically active extractives is less strong. For the case of Cp and Sg, mechanically active extractives work in the same way: lowering the damping coefficient. Sa is known to have some biologically active extractives, although in rather small amounts (Table 1) and it seems that there are also some mechanically active extractives, but they would act in the opposite way, i.e., they enhance instead of weakening the damping of the heartwood, like the extractives of Fagaceae or Sapindaceae (Brémaud et al., 2009).
(a) (b)
(c)
Fig. 10 Linear fitting of log(tanδ) – log(E’/ρ) with the slope fixed to be -0.68 for species (a) Cp, (b) Sg and (c) Sa
Conclusion
By carrying out the free-free flexural vibration tests and X-ray diffraction measurements, the vibrational properties and their relations to radial location and microfibril angle were investigated for 3 tropical rainforest trees. Based on the results, following conclusions can be drawn:
• The radial trends of vibrational properties are quite typical for rainforest trees, which differ from those obtained from the temperate trees. This original remark suggests that the growing conditions have a major impact on patterns of radial variations in wood properties.
• The specific dynamic modulus E’/ρ is, to a big extent, dependent on the MFA. However, this relationship differs between species, which, according to our analysis, confirms that MFA measurement by XRD method needs to be calibrated for many tropical species.
• The damping coefficient tanδ is influenced by both MFA and chemical constituents, the effect of which may be separated in log(tanδ) – log(E’/ρ) diagram.
• Outer heartwood shows in all species a distinct viscoelastic behavior (larger damping for Sa, lower damping for Cp and Sg). These differences in damping behavior could be due either to changes in the constitution of matrix polymer, or to changes in extractive content. We assumed that the main factor making the difference between sapwood and heartwood is the extractive content
• Furthermore, the behavior of inner heartwood differs from that of outer heartwood. This difference was ascribed to the chemical ageing of extractives.
• Mechanical analysis by vibration of radial sequences of specimen is an efficient way to study ontogeny of the xylem through both phenomena of juvenility and duraminisation combined with ageing.
Reference
Adams RD, Bacon DGC. 1973. Effect of fibre orientation and laminate geometry on the dynamic properties of CFRP. J. Composite Mater. 7:402-428.
Aizawa H, Obataya E, Ono T, Norimoto M. 1998. Acoustic converting efficiency and anisotropic nature of wood. Wood research: bulletin of the Wood Research Institute Kyoto University 85:81-83.
Amusant N, Beauchene J, Fournier M, Janin G, Thevenon MF. 2004. Decay resistance in Dicorynia guianensis Amsh.: analysis of inter-tree and intra-tree variability and relations with wood colour. Ann. For. Sci. 61:373-380.
Bamber R. 1976. Heartwood, its function and formation. Wood Science and Technology 10:1-8. Bodig J, Jayne BA. 1993. Mechanics of Wood and Wood Composites: Krieger Publishing Company. Brémaud I, Amusant N, Minato K, Gril J, Thibaut B. 2010a. Effect of extractives on vibrational
properties of African Padauk. Wood Sci. Technol. DOI: 10.1007/s00226-010-0337-3 Brémaud I, Cabrolier P, Gril J, Clair B, Gérard J, Minato K, Thibaut B. 2010b. Identification of
anisotropic vibrational properties of Padauk wood with interlocked grain. Wood Sci. Technol. 44:355-367.
Brémaud I, K. M, B. T. 2009. Mechanical damping of wood as related to species classification: a preliminary survey. Proceedings of the 6th Plant Biomechanics Conference PBM09, Cayenne, French Guyana, Thibaut B. (ed):536-542.
Brémaud I, Minato K, Langbour P, Thibaut B. 2010c. Physico-chemical indicators of inter-specific variability in vibration damping of wood. Ann. For. Sci. 67:707.
Cave ID. 1966. X-ray measurement of microfibril angle. Forest Prod. J. 16:37-42.
Cave ID. 1968. The anisotropic elasticity of the plant cell wall. Wood Sci. Technol. 2:268-278. Cave ID. 1997. Theory of X-ray measurement of microfibril angle in wood. Wood Sci. Technol.
31:225-234.
Cave ID, Walker JCF. 1994. Stiffness of wood in fast-grown plantation softwoods: the influence of microfibril angle. Forest Prod. J. 44:43-48.
Côté WA. 1981. Ultrastructure - critical domain for wood behavior. Wood Sci. Technol. 15:1-29. Cowdrey DR, Preston RD. 1966. Elasticity and Microfibrillar Angle in the Wood of Sitka Spruce.
Proceedings of the Royal Society of London. Series B, Biological Sciences 166:245-272. Dinwoodie JM. 2000. Timber, its nature and behaviour: Taylor & Francis.
Färber J, Lichtenegger HC, Reiterer A, Stanzl-Tschegg S, Fratzl P. 2001. Cellulose microfibril angles in a spruce branch and mechanical implications. J. Mater. Sci. 36:5087-5092.
Gril J, Hunt D, Thibaut B. 2004. Using wood creep data to discuss the contribution of cell-wall reinforcing material. C. R. Biologies 327:881-888.
Hearmon RFS. 1958. The influence of shear and rotatory inertia on the free flexural vibration of wooden beams. Br. J. Appl. Phys. 9:381-388.
Kojima Y, Yamamoto H. 2004. Effect of microfibril angle on the longitudinal tensile creep behavior of wood. J. Wood Sci. 50:301-306.
Kretschmann DE, Alden HA, Verrill S. 1997. Variations of microfibril angle in loblolly pine: Comparison of iodine crystallization and X-ray diffraction techniques. Proceedings of the IAWA/IUFRO International Workshop on the Significance of Microfibril Angle to Wood Quality, Westport, New Zealand. Ed. B.G. Butterfield.
Lenz P, Cloutier A, MacKay J, Beaulieu J. 2010. Genetic control of wood properties in Picea glauca - an analysis of trends with cambial age. Canadian Journal of Forest Research-Revue
Canadienne De Recherche Forestiere 40:703-715.
Lichtenegger H, Reiterer A, Stanzl-Tschegg SE, Fratzl P. 1999. Variation of Cellulose Microfibril Angles in Softwoods and Hardwoods--A Possible Strategy of Mechanical Optimization. Journal of Structural Biology 128:257-269.
Matsunaga M, Minato K, Nakatsubo F. 1999. Vibrational property changes of spruce wood by impregnation with water-soluble extractives of pernambuco (Guilandina echinata Spreng.). J. Wood Sci. 45:470-474.
Minato K, Konaka Y, Brémaud I, Suzuki S, Obataya E. 2010. Extractives of muirapiranga (Brosimun sp.) and its effects on the vibrational properties of wood. J. Wood Sci. 56:41-46.
Nault J. 1988. Radial distribution of thujaplicins in old growth and second growth western red cedar (Thuja plicata Donn). Wood Sci. Technol. 22:73-80.
Norimoto M, Tanaka F, Ohgama T, Ikimune R. 1986. Specific dynamic Young's modulus and internal friction of wood in the longitudinal direction. Wood Res. Tech. Notes 22:53-65.
Obataya E, Ono T, Norimoto M. 2000. Vibrational properties of wood along the grain. Journal of Materials Science 35:2993-3001.
Obataya E, Umezawa T, Nakatsubo F, Norimoto M. 1999. The effects of water soluble extractives on the acoustic properties of reed (Arundo donax L.). Holzforschung 53:63-67.
Ollivier. 2007. Mariwenn Database. http://www.ecofog.gf/Mariwenn/.
Ono T, Norimoto M. 1983. Study on Young's modulus and internal friction of wood in relation to the evaluation of wood for musical instruments. Jpn. J. Appl. Phys. 22:611-614.
Reiterer A, Lichtenegger H, Tschegg S, Fratzl P. 1999. Experimental evidence for a mechanical function of the cellulose microfibril angle in wood cell walls. Philosophical Magazine A 79:2173-2184.
Rudman P. 1966. The causes of variations in the natural durability of wood: inherent factors and ageing their effects on resistance to biological attack. Material und Organismen 1:151–162. Ruelle J, Yamamoto H, Thibaut B. 2007. Growth stresses and cellulose structural parameters in
tension and normal wood from three tropical rainforest angiosperm species. BioResources 2:235-251.
Saito K, Mitsutani T, Imai T, Matsushita Y, Fukushima K. 2008. Discriminating the indistinguishable sapwood from heartwood in discolored ancient wood by direct molecular mapping of specific extractives using time-of-flight secondary ion mass spectrometry. Anal. Chem 80:1552-1557. Sakai K, Matsunaga M, Minato K, Nakatsubo F. 1999. Effects of impregnation of simple phenolic and
natural polycyclic compounds on physical properties of wood. J. Wood Sci. 45:227-232. Saren M, Serimaa R, Andersson S, Saranpää P, Keckes J, Fratzl P. 2004. Effect of growth rate on
mean microfibril angle and cross-sectional shape of tracheids of Norway spruce. Trees-Structure and Function 18:354-362.
Suarez SA, Gibson RF, Sun CT, Chaturvedi SK. 1986. The influence of fiber length and fiber
orientation on damping and stiffness of polymer composite materials. Exp. Mech. 26:175-184. Thibaut B, Thibaut A, Beauchêne J, Ruelle J. 2006. Unusual juvenile wood features in Eperua falcata
(Aubl.): an adaptive choice to cope with mechanical instabilities during early growth in tropical rain forest. 5th Plant Biomechanics Conference. Ed. Salmén, L. Stockholm, SE. Yamamoto H, Okuyama T, Yoshida M. 1993. Method of determining the mean microfibril angle of
wood over a wide range by the improved Cave's method. Mokuzai Gakkaishi 39:118-125. Zobel BJ, van Buijtenen JP. 1989. Wood Variation: Its Causes and Control.


![Что такое “воображаемый Север”? [Qu'est-ce que l'imaginaire du Nord?]](data:image/gif;base64,R0lGODlhAQABAIAAAP///wAAACH5BAEAAAAALAAAAAABAAEAAAICRAEAOw==)