Publisher’s version / Version de l'éditeur:
Optics Express, 23, 17, pp. 21761-21770, 2015-08-11
READ THESE TERMS AND CONDITIONS CAREFULLY BEFORE USING THIS WEBSITE. https://nrc-publications.canada.ca/eng/copyright
Vous avez des questions? Nous pouvons vous aider. Pour communiquer directement avec un auteur, consultez la
première page de la revue dans laquelle son article a été publié afin de trouver ses coordonnées. Si vous n’arrivez pas à les repérer, communiquez avec nous à [email protected].
Questions? Contact the NRC Publications Archive team at
[email protected]. If you wish to email the authors directly, please see the first page of the publication for their contact information.
NRC Publications Archive
Archives des publications du CNRC
This publication could be one of several versions: author’s original, accepted manuscript or the publisher’s version. / La version de cette publication peut être l’une des suivantes : la version prépublication de l’auteur, la version acceptée du manuscrit ou la version de l’éditeur.
For the publisher’s version, please access the DOI link below./ Pour consulter la version de l’éditeur, utilisez le lien DOI ci-dessous.
https://doi.org/10.1364/OE.23.021761
Access and use of this website and the material on it are subject to the Terms and Conditions set forth at
Frequency-dependent linewidth enhancement factor of optical
injection-locked quantum dot/dash lasers
Wang, Cheng; Chaibi, Mohamed E.; Huang, Heming; Erasme, Didier; Poole,
Philip; Even, Jacky; Grillot, Frédéric
https://publications-cnrc.canada.ca/fra/droits
L’accès à ce site Web et l’utilisation de son contenu sont assujettis aux conditions présentées dans le site LISEZ CES CONDITIONS ATTENTIVEMENT AVANT D’UTILISER CE SITE WEB.
NRC Publications Record / Notice d'Archives des publications de CNRC:
https://nrc-publications.canada.ca/eng/view/object/?id=970a2249-b10c-465c-8450-b8f93e3e9fa8 https://publications-cnrc.canada.ca/fra/voir/objet/?id=970a2249-b10c-465c-8450-b8f93e3e9fa8Frequency-dependent linewidth enhancement
factor of optical injection-locked quantum
dot/dash lasers
Cheng Wang,1,2,* Mohamed E. Chaibi,1 Heming Huang,1 Didier Erasme,1
Philip Poole,3 Jacky Even,2 and Frédéric Grillot1
1Université Paris-Saclay, Télécom Paristech, CNRS LTCI, 46 rue Barrault, 75013 Paris, France 2Université Européenne de Bretagne, INSA, CNRS FOTON, 20 avenue des buttes de Coësmes, 35708 Rennes, France
3NRC Canada, 1200 Montreal Road, Building M-50, Room 162, Ottawa, Canada
Abstract: Combining theoretical and experimental studies show that
optical injection strongly changes the behavior of the linewidth enhancement factor (αH-factor) and the FM-to-AM indices ratio (FAIR) in
quantum dash/dot semiconductor lasers. In contrast to solitary lasers, both the αH-factor and the FAIR at low-frequency modulation are reduced by
optical injection. At high modulation frequency, however, the phase-amplitude coupling characteristics are little influenced by optical injection.
©2015 Optical Society of America
OCIS codes: (250.5960) Semiconductor lasers; (250.5590) Quantum-well, -wire and -dot devices; (140.3520) Lasers, injection-locked.
References and links
1. H. Saito, K. Nishi, A. Kamei, and S. Sugou, “Low chirp observed in directly modulated quantum dot lasers,” IEEE Photonics Technol. Lett. 12(10), 1298–1300 (2000).
2. A. A. Ukhanov, A. Stintz, P. G. Eliseev, and K. J. Malloy, “Comparison of the carrier induced refractive index, gain, and linewidth enhancement factor in quantum dot and quantum well lasers,” Appl. Phys. Lett. 84(7), 1058– 1060 (2004).
3. M. Gioannini, A. Sevega, and I. Montrosset, “Simulations of differential gain and linewidth enhancement factor of quantum dot semiconductor lasers,” Opt. Quantum Electron. 38(4-6), 381–394 (2006).
4. A. V. Uskov, E. P. O’Reilly, D. McPeake, N. N. Ledentsov, D. Bimberg, and G. Huyet, “Carrier-induced refractive index in quantum dot structures due to transitions from discrete quantum dot levels to continuum states,” Appl. Phys. Lett. 84(2), 272–274 (2004).
5. F. Grillot, C. Wang, N. A. Naderi, and J. Even, “Modulation properties of self-injected quantum-dot semiconductor diode lasers,” IEEE J. Sel. Top. Quantum Electron. 19(4), 1900812 (2013).
6. J.-M. Sarraute, K. Schires, S. LaRochelle, and F. Grillot, “Enhancement of the modulation dynamics of an optically injection-locked semiconductor laser using gain lever,” IEEE J. Sel. Top. Quantum Electron. 21, 1801408 (2015).
7. G. Yabre, “Effect of relatively strong light injection on the chirp-to-power ratio and the 3 dB bandwidth of directly modulated semiconductor lasers,” J. Lightwave Technol. 14(10), 2367–2373 (1996).
8. T. B. Simpson and J. M. Liu, “Enhanced modulation bandwidth in injection-locked semiconductor lasers,” IEEE Photonics Technol. Lett. 9(10), 1322–1324 (1997).
9. T. B. Simpson, J. M. Liu, and A. Gavrielides, “Bandwidth enhancement and broadband noise reduction in injection-locked semiconductor lasers,” IEEE Photonics Technol. Lett. 7(7), 709–711 (1995).
10. X. J. Meng, T. Chau, D. T. K. Tong, and M. C. Wu, “Suppression of second harmonic distortion in directly modulated distributed feedback lasers by external light injection,” Electron. Lett. 34(21), 2040–2041 (1998). 11. H. K. Sung, E. K. Lau, and M. C. Wu, “Optical single sideband modulation using strong optical injection-locked
semiconductor lasers,” IEEE Photonics Technol. Lett. 19(13), 1005–1007 (2007).
12. B. Lingnau, K. Lüdge, W. W. Chow, and E. Schöll, “Failure of the α factor in describing dynamical instabilities and chaos in quantum-dot lasers,” Phys. Rev. E Stat. Nonlin. Soft Matter Phys. 86(6), 065201 (2012).
13. M. Osiński and J. Buus, “Linewidth broadening factor in semiconductor lasers—An overview,” IEEE J. Quantum Electron. 23(1), 9–29 (1987).
14. S. Melnik, G. Huyet, and A. Uskov, “The linewidth enhancement factor alpha of quantum dot semiconductor lasers,” Opt. Express 14(7), 2950–2955 (2006).
15. R. Raghuraman, N. Yu, R. Engelmann, H. Lee, and C. L. Shieh, “Spectral dependence of differential gain, mode shift, and linewidth enhancement factor in a InGaAs-GaAs strained-layer single-quantum-well laser operated under high-injection conditions,” IEEE J. Quantum Electron. 29(1), 69–75 (1993).
16. R. C. Srinivasan and J. C. Cartledge, “On using Fiber transfer functions to characterize laser chirp and fiber dispersion,” IEEE Photonics Technol. Lett. 7(11), 1327–1329 (1995).
17. C. Harder, K. Vahala, and A. Yariv, “Measurement of the linewidth enhancement factor α of semiconductor lasers,” Appl. Phys. Lett. 42(4), 328–330 (1983).
18. L. A. Coldren and S. W. Corzine, Diode Lasers and Photonic Integrated Circuits (Wiley, 1995). 19. Q.-T. Nguyen, P. Besnard, O. Vaudel, A. Shen, and G.-H. Duan, “Strong dependence of the linewidth
enhancement factor onto an externally injected optical signal for locked Fabry-Perot laser diodes,” in European
Conference on Lasers and Electro-Optics 2009 and the European Quantum Electronics Conference. CLEO Europe-EQEC 2009 (IEEE, 2009).
20. N. A. Naderi, M. C. Pochet, F. Grillot, A. Shirkhorshidian, V. Kovanis, and L. F. Lester, “Manipulation of the linewidth enhancement factor in an injection-locked Quantum-Dash Fabry-Perot laser at 1550nm,” in 2010 23rd
Annual Meeting of the IEEE Photonics Society (IEEE, 2010).
21. L. F. Lester, N. A. Naderi, F. Grillot, R. Raghunathan, and V. Kovanis, “Strong optical injection and the differential gain in a quantum dash laser,” Opt. Express 22(6), 7222–7228 (2014).
22. C. Wang, M. Osiński, J. Even, and F. Grillot, “Phase-amplitude coupling characteristics in directly modulated quantum dot lasers,” Appl. Phys. Lett. 105(22), 221114 (2014).
23. M. Gioannini and I. Montrosset, “Numerical analysis of the frequency chirp in quantum-dot semiconductor lasers,” IEEE J. Quantum Electron. 43(10), 941–949 (2007).
24. A. Markus, J. X. Chen, O. Gauthier-Lafaye, J. G. Provost, C. Paranthoen, and A. Foire, “Impact of intraband relaxation on the performance of a quantum-dot laser,” IEEE J. Sel. Top. Quantum Electron. 9(5), 1308–1314 (2003).
25. R. Lang, “Injection locking properties of a semiconductor laser,” IEEE J. Quantum Electron. 18(6), 976–983 (1982).
26. C. Wang, B. Lingnau, K. Lüdge, J. Even, and F. Grillot, “Enhanced dynamic performance of quantum dot semiconductor lasers operating on the excited state,” IEEE J. Quantum Electron. 50(9), 723–731 (2014). 27. Z. Mi and P. Bhattacharya, “Analysis of the linewidth-enhancement factor of long-wavelength tunnel-injection
quantum-dot lasers,” IEEE J. Quantum Electron. 43(5), 363–369 (2007).
28. F. Grillot, B. Dagens, J. G. Provost, H. Su, and L. F. Lester, “Gain compression and above-threshold linewidth enhancement factor in 1.3μm InAs-GaAs quantum dot lasers,” IEEE J. Quantum Electron. 44(10), 946–951 (2008).
29. E. K. Lau, L. J. Wong, and M. C. Wu, “Enhanced modulation characteristics of optical injection-locked lasers: A tutorial,” IEEE J. Sel. Top. Quantum Electron. 15(3), 618–633 (2009).
30. G. Yabre, “Effect of relatively strong light injection on the chirp-to-power ratio and the 3 dB bandwidth of directly modulated semiconductor lasers,” J. Lightwave Tech. 14(10), 2367–2373 (1996).
31. A. Murakami, K. Kawashima, and K. Atsuki, “Cavity resonance shift and bandwidth enhancement in semiconductor lasers with strong light injection,” IEEE J. Quantum Electron. 39(10), 1196–1204 (2003). 32. N. A. Naderi, M. Pochet, F. Grillot, N. B. Terry, V. Kovanis, and L. F. Lester, “Modeling the injection-locked
behavior of a quantum dash semiconductor laser,” IEEE J. Sel. Top. Quantum Electron. 15(3), 563–571 (2009). 33. E. K. Lau, H.-K. Sung, and M. C. Wu, “Frequency response enhancement of optical injection-locked lasers,”
IEEE J. Quantum Electron. 44(1), 90–99 (2008).
34. M. Gioannini, “Numerical modeling of the emission characteristics of semiconductor quantum dash materials for lasers and optical amplifiers,” IEEE J. Quantum Electron. 40(4), 364–373 (2004).
35. H. Dery, E. Benisty, A. Epstein, R. Alizon, V. Mikhelashvili, and G. Eisenstein, “On the nature of quantum dash structures,” J. Appl. Phys. 95(11), 6103–6111 (2004).
36. M. Z. M. Khan, T. K. Ng, U. Schwingenschlogl, P. Bhattacharya, and B. S. Ooi, “Modeling the lasing spectra of InAs/InP quantum dash lasers,” Appl. Phys. Lett. 98(10), 101105 (2011).
37. Z. G. Lu, P. J. Poole, J. R. Liu, P. J. Barrios, Z. J. Jiao, G. Pakulski, D. Poitras, D. Goodchild, B. Rioux, and A. J. SpringThorpe, “High-performance 1.52 μm InAs/InP quantum dot distributed feedback laser,” Electron. Lett. 47, 818–819 (2011).
38. M. E. Chaibi, H. T. Nguyen, C. Gosset, F. Grillot, and D. Erasme, “Time resolved chirp measurement based on a polarization-maintaining fiber,” IEEE Photonics Technol. Lett. 27(14), 1557–1560 (2015).
39. A. Consoli, J. M. G. Tijero, and I. Esquivias, “Time resolved chirp measurements of gain switched semiconductor laser using a polarization based optical differentiator,” Opt. Express 19(11), 10805–10812 (2011).
40. J. G. Provost and F. Grillot, “Measuring the chirp and the linewidth enhancement factor of optoelectronic devices with a Mach-Zehnder Interferometer,” IEEE Photonics J. 3(3), 476–488 (2011).
41. R.-Q. Hui and M. O’Sullivan, Fiber Optic Measurement Techniques (Elsevier, 2009).
1. Introduction
Directly modulated semiconductor lasers are low-cost transmitter sources used for optical telecommunication networks without requiring external modulators. However, this
modulation scheme suffers from the frequency chirping behavior, which interacts with the chromatic dispersion in the optical fiber, leading to the signal degradation throughout the propagation. The frequency chirping level is directly connected to the linewidth enhancement factor (αH-factor), which describes the coupling between the gain and the refractive index in a
semiconductor laser. In early studies, semiconductor lasers consisting of quantum dots (Qdot) were expected to achieve chirp-free modulation owing to the near-zero αH-factor provided by
the delta-like density of states [1]. In practice, however, the reported αH-factors of Qdot lasers
can vary over a wide range due to the inhomogeneous broadening of the density of states [2], the carrier population of electronic excited states [3], as well as the influence of the free-carrier plasma [4]. On the other hand, tremendous efforts have been made to improve the dynamical performance of directly modulated semiconductor lasers by using high-quality materials and optimization of device structure. Moreover, further improvements can be achieved through employment of nonlinear photonic techniques like optical injection, optical feedback, and gain lever configuration [5,6]. In particular, the former relies on the injection of a single-mode master laser’s light into a slave laser. When the frequency and the phase of the slave laser are synchronized to the master one, it is referred as stable injection locking. In this case, the dynamical characteristics of the slave laser can be greatly improved such as reduction of frequency chirping [7], enhancement of modulation bandwidth [8], suppression of relative intensity noise [9] and nonlinear distortion [10]. In addition, optical injection locking also produces single-sideband modulation, which can alleviate the dispersion-induced power penalty in the fiber [11]. Moreover, Lingnau et al. theoretically reported that optical injection could reduce the αH-factor when the laser was operated under steady-state condition
[12].
The determination of the αH-factor has been done through a large variety of experimental
techniques [13,14], including the Hakki-Paoli method (for below-threshold operation) [15], the fiber transfer function method [16], as well as the FM-to-AM technique [17]. The latter is based on the measurement of frequency modulation (FM) index (β) and amplitude modulation (AM) index (m). The relation between the FM-to-AM indices ratio (FAIR) 2β/m and the αH
-factor for a solitary semiconductor laser is given by [18]:
2 ( ) 1 c H m j ω β ω α ω = + (1)
where ω is the modulation frequency, and ωc = Γpv g Sg ξ / (1+ξS) with Γ being the p optical confinement factor, vg the group velocity of light, g the optical gain, ξ the gain compression factor, and S the photon density. The FAIR usually shows diverging high values at low modulation frequencies (due to adiabatic chirp and thermal effect), and the αH
-factor can normally be extracted from the FAIR curve when the modulation frequency is high enough (ω>>ωc). Recent experimental studies of the αH-factor of optically injection-locked
lasers were analyzed based on this classical expression Eq. (1) [19,20]. Reduction of the αH
-factor was indeed pointed out owing to the decrease of the carrier density and thereby the refractive index variation, or directly to the relatively large exaltation of the differential gain [21].
Our recent work has demonstrated that the αH-factor of solitary Qdot lasers is strongly
dependent on the modulation frequency—larger at low-frequency regime and smaller at high-frequency one, which is different to bulk or quantum well lasers [22]. In this work, we investigate for the first time both experimentally and theoretically the phase-amplitude coupling features of quantum dot/dash (nanostructured) semiconductor lasers subjected to external optical injection. It is shown that the injection-locked laser does exhibit a small FAIR value (low adiabatic chirp) under low-frequency modulation instead of a large one like the solitary laser. The relationship between the FAIR and the αH-factor is found to be strongly
altered by optical injection rather than Eq. (1). In addition, the optical injection reduces the αH-factor value mostly at low modulation frequencies, while little variations are predicted at
high modulation tones.
2. Rate equation model and simulations
The rate equation model takes into account carrier dynamics in the 2D carrier reservoir (RS), in the first excited state (ES) and in the ground state (GS) of the dots [22]. The electrons and holes are treated as neutral pairs (excitons), and the laser emission is operated on the GS. Figure 1 shows the carrier dynamics considered in the rate equation model. Charged carriers are firstly pumped into the RS, which is treated as a discrete state with degeneracy
* 2
/ ( )
RS B RS
D =k Tm A π , with *
m being the reduced carrier mass and ARS the area of the RS
[23]. The carriers are then captured into the ES of dots from the RS within a capture time RS
ES
τ , and finally relax into the lasing GS within a relaxation time τGSES . The carrier capture/relaxation times are physically determined by the Auger- and phonon-assisted processes. However, in this work both are treated as constants with (τESRS,
ES GS
τ ) = (12.6 ps, 5.8 ps). On the other hand, the carrier-escape times (τRSES,
GS ES
τ ) are governed by the Fermi distribution in a quasi-thermal equilibrium system [24]. The RS-ES energy separation is 100 meV and the ES-GS separation is 50 meV.
Fig. 1. Electronic structure of the Qdot laser used for rate equation modeling.
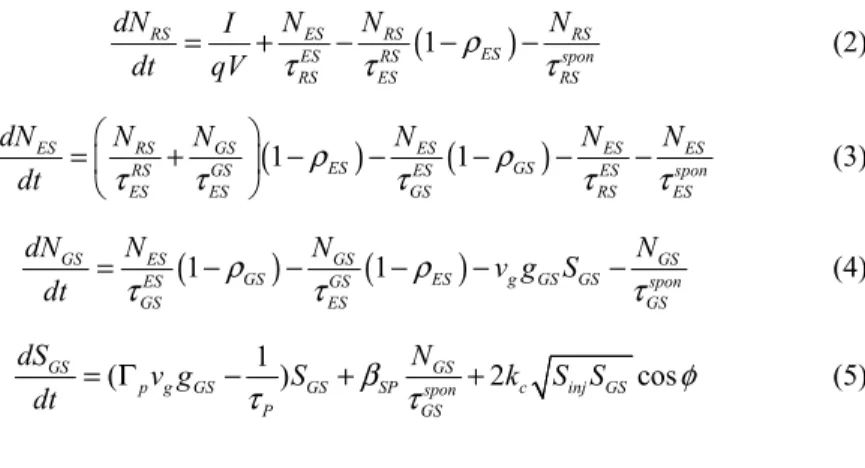
Based on the electronic structure of the Qdot laser in Fig. 1 and taking into account the optical injection field [25], the dynamics of the carrier densities (NRS, NES, NGS), the photon
densities (SGS) and the phase (φ ) of an injection-locked Qdot semiconductor laser are
described by:
(
1)
RS ES RS RS ES ES RS spon RS ES RS dN I N N N dt = qV+τ −τ −ρ −τ (2)(
1)
(
1)
ES RS GS ES ES ES ES GS RS GS ES ES spon ES ES GS RS ES dN N N N N N dt τ τ ρ τ ρ τ τ = + − − − − − (3)(
1)
(
1)
GS ES GS GS GS ES g GS GS ES GS spon GS ES GS dN N N N v g S dt =τ −ρ −τ −ρ − −τ (4) 1 ( ) 2 cos GS GS p g GS GS SP spon c inj GS P GS dS N v g S k S S dt = Γ −τ +β τ + φ (5)sin inj N inj c GS S d k dt S φ ω ω φ = Δ − Δ − (6)
where ρES GS, gives the carrier occupation probability, τ is the photon lifetime, P spon GS
τ is the spontaneous emission time and β is the spontaneous emission factor. Parameter SP kcis the coupling coefficient between the master laser and the slave laser. Sinj is the injected photon,
and the injection ratio is defined as R=Sinj/SGS0 with SGS0 being the photon of the solitary laser. The frequency detuning is given by Δωinj =ωmaster −ωslave . ΔωN describes the frequency shift of the electric field induced by the carrier populations in each state [22]:
1 1 1 2 2 2 GS GS GS N Pv gg GS H Pv g Fg ES ES Pv g Fg RS RS ω α Δ = Γ + Γ + Γ (7)
where the material gain of each state is [26] 2 1 1 2 / 2 1 4 / 2 1 / ( ) GS B GS GS GS B B B ES B ES ES B B B RS RS RS RS RS B RS RS B a N N g S H N H N N g a H N H D N g a A H D A H ξ = − + = − = − (8)
where aGS ES RS, , is the differential gain, NB is the area density of the dots, and HB is the height. The weighting coefficients in Eq. (7) are given by
, , 2 2 , , ( ) 1 ( ) ES RS GS D GS GS ES RS ES RS ES RS GS D T F T ω ω ω ω ω ω − = + − (9)
with ωGS ES RS, , the transition frequency of each state, and TD the polarization dephasing time.
The first term in Eq. (7) is attributed to the carrier contribution of the resonant GS, and is represented by an empirical α-factor value GS
H
α which is fixed as GS H
α = 0.5 in this work [27]. The second term is due to the carrier population in the ES while the third term is to that in the RS.
In the small-signal analysis, a current modulationδ with frequencyI ω leads to the modulations of the carrier densities δNGS ES RS, , , the photon density δSGS and the phase δφ . Based on the differential rate equation of the model [22], the αH-factor of the nanostructured
laser is given by
(
)
2 1 ( ) 2 2 N GS ES ES RS RS H H ES RS P g GS GS GS a N a N F F v g a N a N δ ω δ δ α ω α δ δ δ Δ = ≡ + + Γ (10)with a= ∂gGS /∂NGS being the differential gain. On the other hand, the FAIR of the injection-locked nanostructured laser is derived as:
(
)
(
)
/ 2 ( ) 2 / ( )( 1 / ) / sin ( ) cos / cos ( ) sin inj GS GS H p p g GS c inj GS H c inj GS H j m S S j v g k S S j k S S β ωδφ ω ω δ α ω ω τ φ α ω φ ω φ α ω φ = + − Γ + − ≡ + − (11)where the gain compression effect is not included in the analytical expression for the sake of simplicity. Equation (11) is a good approximation of the FAIR as long as ξSGS <<1. However, in all the following simulations, the gain compression is taken into account numerically with ξ = 2 × 10⁻¹⁶ cm3 [28]. In addition, the above formula shows that the
relationship between the FAIR and the αH-factor is strongly altered by the additional optical
injection terms, which depends on the injection ratio and the frequency detuning, in contrast to the simple case of solitary lasers shown in Eq. (1). In addition, the derived FAIR of the injection-locked laser is consistent with the form of chirp-to-power ratio (CPR) following the relationship CPR=
(
ω/ 2S)
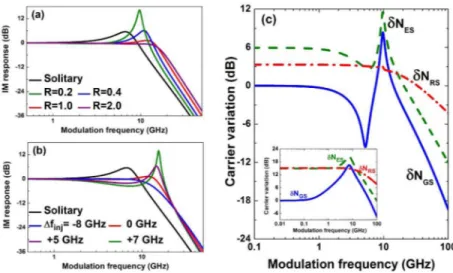
(2 /β m) [29,30].Fig. 2. Intensity modulation (IM) response (a) at various injection ratios with a zero frequency detuning, and (b) at various frequency detuning with an injection ratio of R = 1.0. (c) Carrier density responses of injection-locked laser with R = 0.2 at zero frequency detuning. Inset in (c) is the corresponding carrier responses of the solitary laser, which is normalized to the GS response at the lasing threshold (Ith = 49 mA). The bias current is fixed at 1.2 × Ith.
The semiconductor laser under study is based on an InAs/InP Qdot structure, for which all the numerical parameters used in the simulation are described in [21]. As expected, Fig. 2(a) shows that the optical injection enhances the modulation bandwidth under zero frequency detuning condition [31]. At low injection ratio (R = 0.2), a high resonance peak along with a small pre-resonance dip (not visible due to the large scale) appears in the intensity modulation (IM) response [32]. Figure 2(b) illustrates the frequency detuning effect on the modulation response. At negative detuning (–8 GHz), the injected laser usually exhibits an overdamped response without any resonance peak, while at zero detuning the laser performs a broadband and flat response, which is favored in high-speed application. At positive detuning ( + 5, + 7 GHz), the photon response usually exhibits a high-frequency resonance associated with a pre-resonance dip, especially when the laser is operated near the Hopf bifurcation [32]. Figure 2(c) describes the carrier density modulation as a function of the modulation frequency. For the solitary laser (inset), the carrier variation of the resonant GS is 15-dB weaker than those
of the off-resonant ES and the RS at low modulation frequencies (<0.1 GHz). This phenomenon is attributed to the gain clamping of the GS above threshold, while carriers in the ES and the RS are not clamped. For the injection-locked Qdot laser (R = 0.2), the carrier variations of off-resonant states are reduced down to less than 6 dB by the external light. These characteristics in turn substantially change the phase-amplitude coupling features of the laser, which depend on the carrier variations as shown in Eq. (10). Interestingly, the GS carrier variation δNGS exhibits a pre-resonance dip around 5 GHz. This phenomenon occurs when the optical injection is operated near the Hopf bifurcation, where the photon (IM) response also shows a pre-resonance dip as shown in Figs. 2(a) and (b). The occurrence of such a resonance is attributed to the limited stimulated recombination rate on the order of a few GHz as explained in [33]. Physically, the carrier injection rate in injection-locked lasers is no longer coupled to the relaxation oscillation dynamics, which is dominated by the master’s and slave laser’s electrical field interaction. This is in contrast to the solitary laser, whose carrier injection rate is directly coupled to the relaxation oscillation dynamics, which is created by the energy exchange between carriers and photons [33].
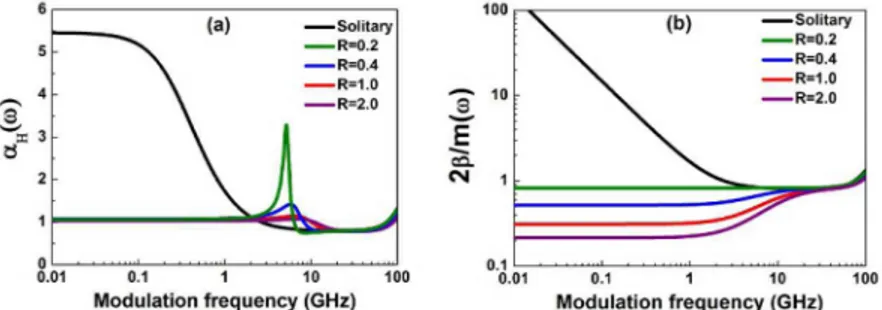
Indeed in Fig. 3(a), the αH-factor calculated at low modulation frequencies (<0.1 GHz) is
reduced from 5.5 down to about 1.0 by the optical injection due to the smaller carrier variations. This reduction behavior is in agreement with the theoretical report in [12], where the laser was operated under DC condition. Interestingly, the αH-factor presents a peak around
5-7 GHz where the carrier variation exhibits a pre-resonance dip. The peak vanishes when the injection ratio is increased. Increasing modulation frequency higher than 50 GHz raises the αH-factor value due to different carrier decay rates in each state as described in Fig. 1(b).
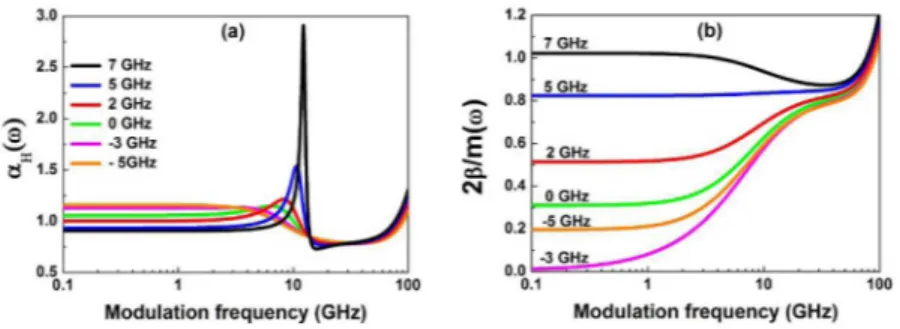
Figure 3(b) shows that the FAIR of the injected laser remains constant at a small value (< 1.0) for modulation frequencies less than to 1.0 GHz, in contrast to the large value in the solitary laser. In addition, high injection ratio reduces this constant level of the FAIR. However, the optical injection has little impact on the FAIR value at high modulation frequency (> 20 GHz). The frequency detuning has similar effects on both the αH-factor and the FAIR as well
as described in Fig. 4. Generally, positive frequency detuning leads to a smaller αH-factor
(Fig. 4a) but a larger FAIR (Fig. 4b) at low modulation frequencies. Besides, it also results in a high peak of the αH-factor around 10 GHz. For even higher frequencies, the behaviors of the
αH-factor and the FAIR are close to those of the free running laser.
Fig. 3. (a) The αH-factor and (b) the FAIR of the Qdot laser subject to optical injection for various injection ratios. The frequency detuning is fixed at 0 GHz.
Fig. 4. (a) The αH-factor of the injected laser for frequency detunings from −5 GHz up to 7 GHz; (b) The FAIR for the corresponding frequency detunings shown in (a). The injection ratio is fixed at R = 1.0.
It is noted that although the rate equation model is primarily developed for Qdot lasers, the above numerical results are also applicable to quantum dash (Qdash) lasers through adjustment of values of differential gain, gain and reduced state-energy separation owing to the moderate in-plane geometric anisotropy in the growth procedure [34–36]. However, the model is not expected to be proper for quantum wire (Qwire) lasers, where the nanostructures exhibit almost 1D electronic density of sates.
3. Experimental demonstration
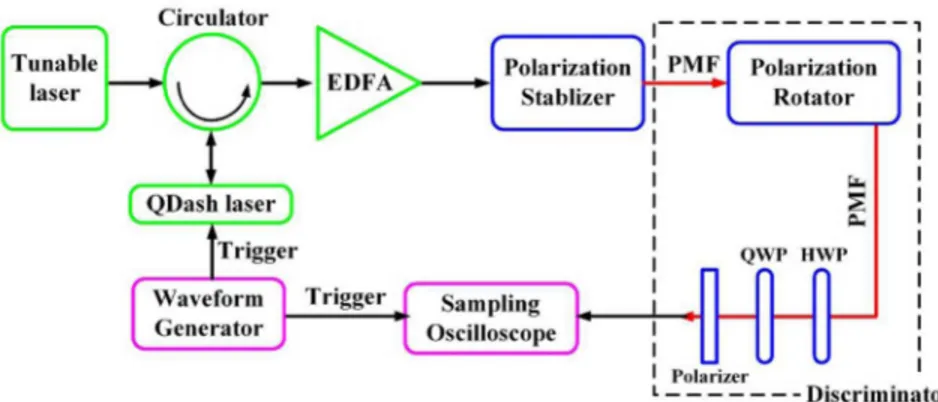
In order to experimentally test the theoretical predictions, we measured the phase-amplitude coupling properties of an InAs/InP Qdash laser, which was grown by chemical beam epitaxy (CBE) method [37]. The active region contains 5 stacked layers of self-assembled Qdashes. The Qdash laser has a 1000 μm long cavity and a 2 μm width ridge. Both facets are as cleaved. Figure 5 illustrates the experimental setup for the time-resolved intensity and chirp measurement of the injection-locked Qdash laser. The optical injection is done with a tunable external cavity laser, and the light is injected into the Qdash laser through an optical circulator. The Qdash laser is modulated by a small-signal sinusoidal wave produced from a waveform generator. The output light is amplified by an erbium doped fiber amplifier (EDFA). Passing through a polarization stabilizer, the optical signal is processed by an optical frequency discriminator. The frequency discriminator is a fibre-based interferometer, which consists of polarization maintaining fibres (PMF) and a phase shifter unit (including a half wave plate, a quarter wave plate and two polarizers) [38,39]. A high-speed sampling oscilloscope is synchronized with the waveform generator, and is used to analyse the data in the time domain. The intensity and the chirp waveforms are extracted in a similar approach as in [40], where a Mach-Zehnder interferometer and a radio-frequency network analyzer was utilized to record the data in the frequency domain. The network analyzer responds to only linear components of the photocurrent at the modulation frequency fm while high-order
harmonics at 2fm, 3fm and nonlinear distortions of the light signal are automatically neglected.
Nevertheless, the time-domain analysis in this work is capable of taking into account all these nonlinear effects [41]. The Qdash laser is biased at 80 mA at room temperature. The lasing power is about 0 dBm and the Fabry-Perot modes peak around 1550 nm. The longitudinal mode under study is at 1550.64 nm measured with a 10-pm resolution optical spectrum analyzer.
Fig. 5. Schematic of the experimental setup. PMF: polarization maintaining fibre; HWP: half-wave plate; QWP: quarter-half-wave plate.
Figure 6(a) shows an illustration of the measured intensity (black) and chirp (blue) profiles. The AM (m) and the FM (β) indices are extracted by fitting the waveforms using the sine function. Figure 6(b) shows that the solitary Qdash laser exhibits a large value of FAIR at low modulation frequencies as the simulation in Fig. 3(b), and it decreases to a minimum of 5.4 around a frequency of fm = 3 GHz, which gives the αH-factor of the Qdash laser through
Eq. (1). Further increasing the modulation frequency slightly raises the value of the FAIR due to the carrier population in the ES and in the RS [22]. When the laser is subjected to the optical injection, the behavior of the FAIR becomes quite different. The injected laser shows a low value instead of a large value at low modulation frequencies, which is even smaller than the αH-factor of the solitary laser. For an injection of R = 2.0, the FAIR increases from 4.0 for
fm = 0.2 GHz up to 7.2 for fm = 5.0 GHz. In contrast, for R = 5.0, the FAIR remains almost
constant around 3.0 for fm = 0.2~5.0 GHz. These preliminary experimental results are
consistent with the observation in [19], and are qualitatively in agreement with the simulations depicted in Fig. 3 and Fig. 4. In addition, further systematical measurements of the FAIR as a function of the injection strength and the frequency detuning will be performed in our future work. On the other hand, because the current experimental techniques used for measuring the αH-factor of solitary lasers are hardly transposable to the injection-locking
configuration, the development of a proper experiment is under investigation.
Fig. 6. (a) An illustration of the measured intensity (black) and chirp (blue) waveforms; (b) FAIR of the solitary laser as well as of the laser subject to optical injection with injection ratios of R = 2.0 and R = 5.0. The frequency detuning of the master laser with respect to the slave laser is fixed at −4.0 GHz. The grey horizontal line indicates the αH-factor of the Qdash laser.
4. Conclusion
In conclusion, this work demonstrates that the optical injection strongly impacts the behaviors of the αH-factor as well as the FAIR of Qdot/Qdash semiconductor laser, and a new
theoretical expression is derived to describe this effect, beyond the classical model. At low modulation frequencies (less than several GHz), optical injection can reduce the αH-factor
value, and removes the large value of the FAIR. In addition, the αH-factor exhibits a peak in
the modulation response at low injection ratio or at positive frequency detuning. However, the phase-amplitude coupling behavior at high modulation frequency (more than 10 GHz) is little changed by optical injection. These combined theoretical and experimental results show that optical injection offers a promising way to manipulate the linewidth enhancement factor of nanostructured lasers. Future work will involve additional experiments on other types of nanostructure lasers with different compositions and/or material substrates, spectral linewidth investigation of the modulation-frequency dependence of the αH-factor as well as comprehensive numerical studies to understand the physical origin of the peak in the αH-factor response.
Acknowledgments
C. Wang’s work is supported by China Scholarship Council. F. Grillot’s work is supported by the the European Office of Aerospace Research and Development (EOARD) under Grant FA9550-15-1-0104 and Partenariat Hubert Curien under Grant 30794RC (Campus France/ DAAD). The authors would like to thank Professor Marek Osiński from the University of New Mexico, USA for helpful discussions.