Version: Accepted Version
Article:
Fillon, A, Beaulieu, K orcid.org/0000-0001-8926-6953, Mathieu, ME et al. (4 more authors) (2020) A systematic review of the use of the Satiety Quotient. British Journal of Nutrition. ISSN 0007-1145
https://doi.org/10.1017/s0007114520002457
© The Authors 2020. This article has been published in a revised form in British Journal of Nutrition: https://doi.org/10.1017/S0007114520002457. This version is free to view and download for private research and study only. Not for re-distribution, re-sale or use in derivative works.
eprints@whiterose.ac.uk https://eprints.whiterose.ac.uk/
Reuse
Items deposited in White Rose Research Online are protected by copyright, with all rights reserved unless indicated otherwise. They may be downloaded and/or printed for private study, or other acts as permitted by national copyright laws. The publisher or other rights holders may allow further reproduction and re-use of the full text version. This is indicated by the licence information on the White Rose Research Online record for the item.
Takedown
If you consider content in White Rose Research Online to be in breach of UK law, please notify us by
This peer-reviewed article has been accepted for publication but not yet copyedited or typeset, and so may be subject to change during the production process. The article is considered published and may be cited using its DOI
10.1017/S0007114520002457
The British Journal of Nutrition is published by Cambridge University Press on behalf of The Nutrition Society
A systematic review of the use of the Satiety Quotient
Fillon A1,2, Beaulieu K3, Mathieu ME4, Tremblay A5, Boirie Y6,7,8,9, Drapeau V5, Thivel D1,6.
1
Clermont Auvergne University, EA 3533, Laboratory of the Metabolic Adaptations to Exercise under Physiological and Pathological Conditions (AME2P), Clermont-Ferrand,
France
2
UGECAM Nutrition Obesity Ambulatory Hospital, Clermont-Ferrand, France
3
School of Psychology, Faculty of Medicine and Health, University of Leeds, Leeds, LS2 9JT, UK
4
School of kinesiology and physical activity sciences, University of Montréal, Montréal, Québec, Canada.
5
Institute of Nutrition and Functional Foods (INAF), University of Laval, Quebec City, Canada
6
CRNH-Auvergne, Clermont-Ferrand, France
7
INRA, UMR 1019, Clermont-Ferrand, France
8
Department of Human Nutrition, Clermont-Ferrand University Hospital, G. Montpied Hospital, Clermont-Ferrand, France
9
University Clermont Auvergne, UFR Medicine, Clermont-Ferrand, France
Key words. Satiety Quotient, Appetite, Hunger, Fullness, Energy Intake, Desire to Eat, Prospective Food Consumption
Running head: Use of the Satiety Quotient
ht tp s://w w w .camb rid ge.or g/cor e . IP ad dr ess: 94 .1 3.1 01 .2 26 , on 2 1 Ju l 2 02 0 at 0 8:3 7:0 2, su bject to th e Camb rid ge Cor e ter ms of u se, av ai lab le at ht tp s://w w w .camb rid ge.or g/cor e/t er ms . ht tp s://d oi .or g/1 0.1 01 7/S 00 07 11 45 20 00 24 57
Corresponding Author: Miss FILLON Alicia
Clermont University, EA 3533, Laboratory of the Metabolic Adaptations to Exercise under Physiological and Pathological Conditions (AME2P), BP 80026, F-63171 Aubière cedex, France
fillonalicia@gmail.com
Phone and fax/ 0033 4 73 40 76 79
Abstract
The satiating efficiency of food has been increasingly quantified using the Satiety Quotient (SQ). The SQ integrates both the energy content of food ingested during a meal and the associated change in appetite sensations. This systematic review examines the available evidence regarding its methodological use and clinical utility. A literature search was conducted in 6 databases considering studies from 1900 to April 2020 that used SQ in adults, adolescents and children. All study designs were included. From the initial 495 references found, 52 were included. Of the studies included, 33 were acute studies (29 in adults and 4 in adolescents) and 19 were longitudinal studies in adults. A high methodological heterogeneity in the application of the SQ was observed between studies. Five main utilizations of the SQ were identified: its association with i) energy intake; ii) anthropometric variables; iii) energy expenditure/physical activity; iv) sleep quality and quantity; as well as v) to classify individuals by their satiety responsiveness (i.e. low and high satiety phenotypes). Altogether, the studies suggest the SQ as an interesting clinical tool regarding the satiety responsiveness to a meal and its changes in responses to weight loss in adults. The SQ might be a reliable clinical indicator in adults when it comes to both obesity prevention and treatment. There is a need for more standardized use of the SQ in addition to further studies to investigate its validity in different contexts and populations, especially among children and adolescents. Prospero number: CRD42019136442. ht tp s://w w w .camb rid ge.or g/cor e . IP ad dr ess: 94 .1 3.1 01 .2 26 , on 2 1 Ju l 2 02 0 at 0 8:3 7:0 2, su bject to th e Camb rid ge Cor e ter ms of u se, av ai lab le at ht tp s://w w w .camb rid ge.or g/cor e/t er ms . ht tp s://d oi .or g/1 0.1 01 7/S 00 07 11 45 20 00 24 57
Ac ce pt ed manusc ript Abb re viation s B F : B re akf ast B W : B od y W eig ht E I: En er g y I ntak e S Q: S ati et y Quotient SQ D T E : S ati et y Quotient f or de sire to e at SQ F : S ati et y Quotient for fullne ss SQ H : S ati et y Q uoti ent for hung er SQ P F C : S ati et y Quotient f or prospe cti ve food cons umpt ion SQ S : S ati et y Quotient for s ati et y T1D : T y p e 1 diabe tes T2D : T y p e 2 diabe tes VA S : Visua l ana lo g ue s ca le
Introduction
According to the World Health Organization, 39% of adults were overweight and 13% had obesity in 2016 (1) with pediatric data being just as concerning with 340 million children from 5 to 19 years old classified with overweight and obesity world-wide (1). This alarming prevalence of overweight, obesity and their associated metabolic complications call for a better understanding of the mechanisms involved to propose innovative and effective weight loss strategies. Among them, the regulation of energy balance (2,3) and the pathways involved in the control of appetite and energy intake (EI) have been of particular interest over the last years (4). Both homeostatic and hedonic mechanisms influence the motivation to eat (hunger), meal size (satiation) and post-meal suppression of hunger (satiety) (5).
Indeed, a number of objective and subjective methods have been developed for the quantification and evaluation of both food intake (e.g. ad libitum test meals, food diaries) and appetite sensations (e.g. visual analogue scales; VAS). These VAS usually comprise of
questions pertaining to hunger “How hungry do you feel?”, fullness “How full do you feel?”, desire to eat “How strong is your desire to eat?”, and prospective food consumption “How much do you think you could eat?”, with “not at all” to “extremely” as labelled end points.
Integrating both the energy content of food ingested during a meal and the associated change in appetite sensations, Green and collaborators developed a Satiety Quotient (SQ) as an indicator of the satiating efficiency of food (6). The SQ is calculated by dividing the change in subjective appetite sensations in response to a meal by the energy content of the meal.
Since its development, there has been an increasing use of the SQ. While initially created as an indicator for the satiating efficiency of a meal or food, the SQ has been associated with food intake (7–10) and body weight (BW) and composition (9,11,12) or used as a tool to classify individuals by their satiety responsiveness (13–15). However, the extent to which the SQ has been applied in research and its scientific and clinical relevance has yet to be examined. Therefore, the aim of this systematic review is to review the available evidence of the different contexts in which the SQ has been utilized in research, the methodologies used to calculate the SQ, and to examine its clinical utility.
Methods
This review is registered in the PROSPERO database as CRD42019136442. The PRISMA guidelines were followed for the preparation of this paper (16).
ht tp s://w w w .camb rid ge.or g/cor e . IP ad dr ess: 94 .1 3.1 01 .2 26 , on 2 1 Ju l 2 02 0 at 0 8:3 7:0 2, su bject to th e Camb rid ge Cor e ter ms of u se, av ai lab le at ht tp s://w w w .camb rid ge.or g/cor e/t er ms . ht tp s://d oi .or g/1 0.1 01 7/S 00 07 11 45 20 00 24 57
Database search
The following electronic bibliographic databases were searched: PubMed, Embase, Scopus, Web of Science, CAB Abstract Core Collection and Google Scholar. The literature search considered studies from year 1900 to April 2020. Keyword searches were performed for
“Satiation", "Satiety response", "Appetite", "Hunger", “Humans”, “Fullness”, "Prospective
Food Consumption", "Desire To Eat", "Motivation To Eat" and “Satiety Quotient”. The search strategy for each of the databases are detailed in Table 1. The search strategies were developed based on an analysis of the literature and were open-ended according to the nature of each database. The reference lists of the articles included were also examined to complete the search.
Study eligibility
Inclusion criteria. To be included in the review, studies had to use SQ. There was no exclusion criterion for the study design (cross-sectional, observational, longitudinal or interventional), population (no limit for age, weight status and associated complications and both genders were included), meal type (standardized or ad libitum). Published peer-reviewed studies, conference proceedings and posters (when data and design properly described), theses and dissertations were eligible.
Exclusion criteria. When data were presented in a graphical form without mean or standard deviation (SD) indicated, the corresponding author of the work was contacted to obtain complementary data. If the corresponding author did not answer or declined the query, studies were excluded. When the full text was not found and the corresponding author was unreachable or did not respond, the article was excluded.
Study selection. Titles and abstracts of potentially relevant studies were screened in duplicate for inclusion in the review and any discrepancies were collectively discussed by the authors. The same procedure was followed for the full texts. Any disagreement regarding eligibility for inclusion was discussed and a consensus made among co-authors.
Data extraction
For every included study, the following data were extracted: sample size and characteristics (sex, age, BMI), study design and aim, VAS characteristics (specific appetite sensations assessed and timing), meal characteristics, SQ equation and main SQ results.
ht tp s://w w w .camb rid ge.or g/cor e . IP ad dr ess: 94 .1 3.1 01 .2 26 , on 2 1 Ju l 2 02 0 at 0 8:3 7:0 2, su bject to th e Camb rid ge Cor e ter ms of u se, av ai lab le at ht tp s://w w w .camb rid ge.or g/cor e/t er ms . ht tp s://d oi .or g/1 0.1 01 7/S 00 07 11 45 20 00 24 57
Risk of Bias
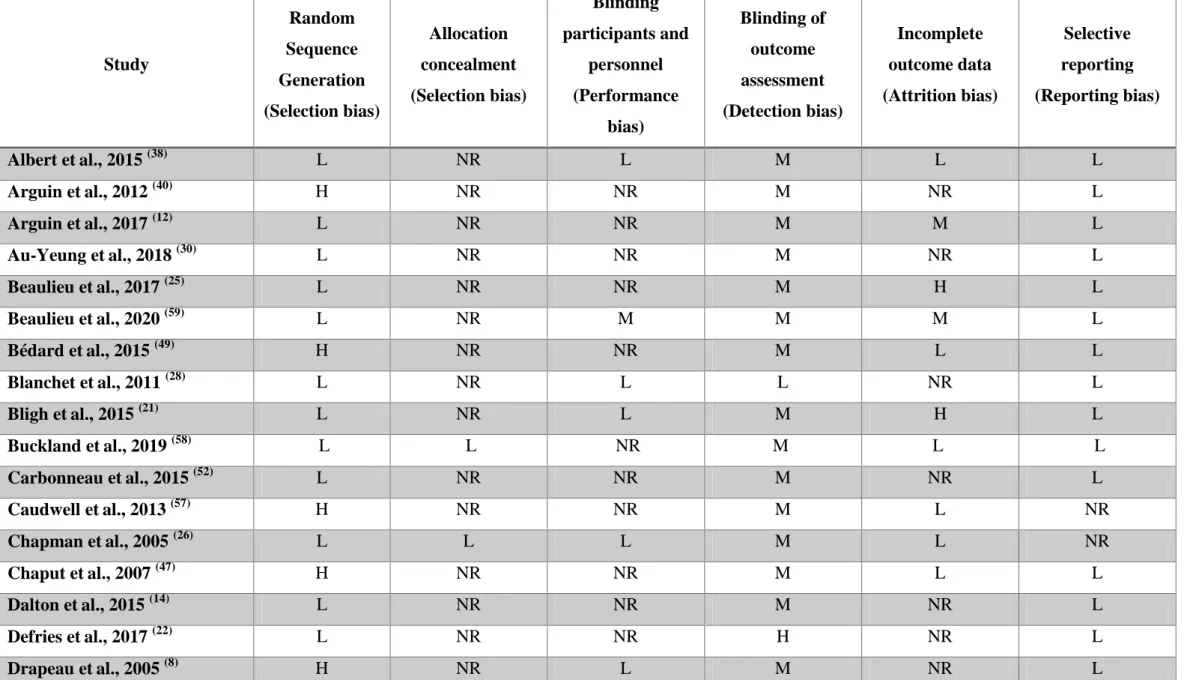
Risk of bias was independently evaluated by two authors (AF, DT) using the Cochrane risk of bias tool (17). Risk of bias was assessed for: selection bias; performance bias; detection bias; attrition bias; reporting bias. Any discrepancies in bias coding were resolved by a third reviewer. Studies were not excluded on the basis of risk of bias.
Results
The flow diagram presented in Figure 1 illustrates the selection/inclusion/exclusion process. The initial database search identified 1281 studies and 9 additional studies were also identified. Following the removal of duplicate studies, 495 studies were identified. After review of titles and abstracts, 162 studies were excluded and 85 full-text were screened, leaving 52 included studies. Table 2 details the risk of bias analysis. Of the 52 studies included, 33 were acute studies (6–8,11,13–15,18–42) and 19 were longitudinal studies (9,10,12,43–59).
……….Figure 1………
Acute studies
Of the 33 acute studies, 29 were conducted in adults (6–8,11,13–15,18–37,40,43) and 4 in adolescents
(38,39,41,42)
.
Adult acute studies (n=29)
Main aim, population and design
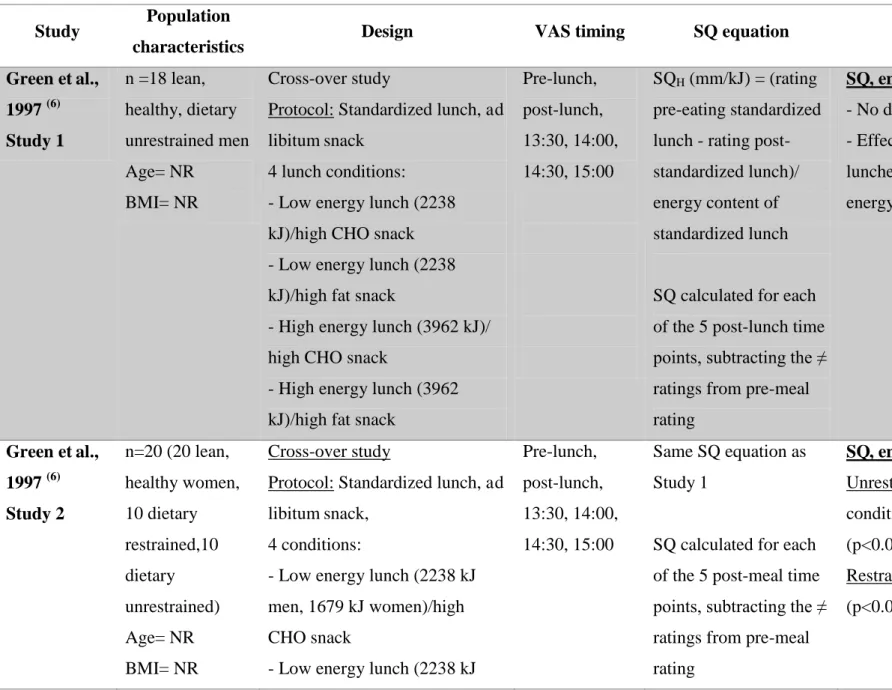
The main aims, populations and used designs are presented in Table 3 and fully detailed in supplementary materials.
Methods Topics
Of the 29 studies, 90% (n=26) compared SQ in response to a stimulus (meal, exercise, sleep), the remaining studies (8,13,14) used SQ to categorize their population (high or low satiety phenotype). Fifty-nine percent of the included studies (n=17) compared the SQ response to meals of different composition. Of these 17 studies, 2 used liquid meals (28,33), 14 solid meals
ht tp s://w w w .camb rid ge.or g/cor e . IP ad dr ess: 94 .1 3.1 01 .2 26 , on 2 1 Ju l 2 02 0 at 0 8:3 7:0 2, su bject to th e Camb rid ge Cor e ter ms of u se, av ai lab le at ht tp s://w w w .camb rid ge.or g/cor e/t er ms . ht tp s://d oi .or g/1 0.1 01 7/S 00 07 11 45 20 00 24 57
(6,14,15,18,19,21,22,25,27,30,34–37,40)
and 1 study compared solid versus liquid meals (32). Of these studies, 3 examined the effect of meals differing in energy content (14,28,33) and 5 studies compared the effect of meals differing in macronutrient composition (6,15,18,19,25). Martini et al.
(27)
compared the effect of meals differing in fiber and protein, and Au-Yeung (30) compared the effect of different amounts protein intake via konjac glucomannan capsules and one study examined the combined effects of a modification in macronutrients, unsaturated fats, fiber and calcium (40). In a slightly different way, Felix et al. (32) compared the effect of different kinds of rice and Finlayson et al. (35) the effect of different tastes on appetite sensations. Defries et al. (22) compared the different satiating effects of meals made from buckwheat flour or rice flour, while Felix et al. (36) compared the different satiating effects of white rice or brown rice using 4 different types of rice and Kendall et al. (34) the effect of different resistant starch compositions using beverages. Finally, in their study, Bligh et al. (21) investigated the satiating effect of two different types of Paleolithic meals compared to a reference meal.
Three of the studies investigated the influence of sleep on SQ (20,29,31): one examined the effect of sleep duration (20), while another examined the timing (31) and a last one assessed the influence of the duration, quality and timing of sleep (29). Two of the 28 studies investigated acute medication interventions (23,26) and 1 assessed the effect of hormone infusions (24). Among the acute studies, 2 included acute exercise in their protocol and compared appetite sensations after the same exercise performed at different blood glucose levels (7) and the other compared different intensities of exercise (37) or different activity related energy expenditure (43). One study investigated the effect of mental work (11), and another compared the appetite sensation response of men and women (8). Finally, Drapeau et al. (13) characterized the biopsychobehavioural profiles of men with low satiety phenotype at the start of a weight loss intervention.
VAS
Regarding the type of VAS used, 79% (n=23) of acute studies used the pen and paper method
(6–8,11,13,14,20,22,24,26–37,40,43)
, 10% (n=3) used electronic VAS (18,21,23) and 3 studies did not specify the type of scale used (15,19,25). Of the 23 studies using pen and paper scales, 15 used 100-mm scales (6,14,20,22,24,26,27,30–36,43), while 8 used 150-mm scales (7,8,11,13,28,29,37,40). For studies that used electronic VAS, 1 used 100-mm scales (18), one used 60-mm scales (21) and one did not specify the length of the scale used (23) . The 3 studies that did not specify the type of scale used also did not specify the length of the scale (15,19,25).
ht tp s://w w w .camb rid ge.or g/cor e . IP ad dr ess: 94 .1 3.1 01 .2 26 , on 2 1 Ju l 2 02 0 at 0 8:3 7:0 2, su bject to th e Camb rid ge Cor e ter ms of u se, av ai lab le at ht tp s://w w w .camb rid ge.or g/cor e/t er ms . ht tp s://d oi .or g/1 0.1 01 7/S 00 07 11 45 20 00 24 57
Out of the 29 studies, 28 assessed “Hunger” (6–8,11,13–15,18–26,28–37,40,43), 24 measured “Fullness”
(7,8,11,13,14,18,20–31,33,34,36,37,40,43)
and 20 investigated “Prospective Food Consumption” (7,8,11,13–
15,18,20,22,24,28–31,33,34,36,37,40,43). “Desire to Eat” was assessed in 20 studies (7,8,11,13–15,18,21–23,27– 31,34,36,37,40,43) and “Satiety” in 4 studies (18,20,24,27)
. However, as described below, all appetite sensations measured were not used for the calculation of SQ.
Calculation of SQ Equations used
Of the 29 acute studies included, 8 used the initial equation proposed by Green et al. (1997)
(6,22,24,30,33–35,43)
: (appetite sensation pre-meal - appetite sensation post meal) / EI of eating episode. This equation was slightly reworked by Drapeau et al. (2007), who used this equation but multiplied the result by 100. Fifteen studies used the equation proposed by Drapeau et al. (7,8,13,14,18–20,25,28,29,31,32,36,37,40). While previous studies have used similar equations, others have calculated the SQ slightly differently. Chapman et al. (26) calculated two SQ: a prandial SQ that considered in its calculation both pre- and post-meal appetite sensations, and a post-prandial SQ only considering post-meal sensations. In their study, Martini et al. (27) calculated three different SQ: 1) the same equation as Drapeau et al. using the pre- and post-lunch appetite sensations and energy content of lunch; 2) (appetite sensation before lunch – appetite sensation before snack) /energy content of lunch * 100; and 3) (appetite sensation before lunch – appetite sensation after snack) / (energy content of lunch + snack) * 100. More specifically, Au Yeung et al. used the Green equation for SQH, SQDTE and
SQPFC. For SQF, they subtracted fullness post-eating from fullness fasting. Salama et al. (11)
also reversed the order of subtraction between appetite sensations contrary to what was done by Drapeau, subtracting pre-meal sensations from post-meal sensations. Two studies did not specify the type of equation used (15,21). Finally, Thomas et al. used an adapted version of the equation proposed by Green and calculated “satiation quotient” per quartile, reflecting the satiety capacity of a food as eaten ((quartile initial hunger – quartile ending hunger rating)/calorie consumed during quartile) (23).
Appetite sensations used
Although we have previously detailed the different appetite sensations assessed in the included studies, SQ was not calculated in each of these studies using all the assessed sensations. Twenty-five studies calculated an SQ for "Hunger" (6–8,11,13,14,19–26,28–32,34–37,40,43) , 16 for "Fullness" (7,8,11,13,20,21,24,27–29,31,34,36,37,40,43) and 15 for "Desire To Eat" (7,8,11,13,21,27–
ht tp s://w w w .camb rid ge.or g/cor e . IP ad dr ess: 94 .1 3.1 01 .2 26 , on 2 1 Ju l 2 02 0 at 0 8:3 7:0 2, su bject to th e Camb rid ge Cor e ter ms of u se, av ai lab le at ht tp s://w w w .camb rid ge.or g/cor e/t er ms . ht tp s://d oi .or g/1 0.1 01 7/S 00 07 11 45 20 00 24 57
31,34,36,37,40,43)
and "Prospective Food Consumption" (7,8,11,13,20,24,28–31,34,36,37,40,43). Drapeau et al. also calculated a mean SQ with the SQ results corresponding to the four previous appetite sensations (13). In 3 of the acute studies, an SQ for "Satiety" was calculated (20,24,27). Hansen et al. (18) calculated what they named an Appetite Quotient (similar to SQ), based on composite appetite scores (with Hunger, Satiety, Fullness, Prospective Food Consumption and Desire To Eat). Gonzalez et al. (33) also produced a composite SQ, whose equation is however not detailed. In their work, Hollingworth et al. (15) did not detail in the publication which appetite sensation was used to calculate the SQ.
Timing of the sensations used
For the SQ calculation, out of the 29 studies, 23 chose to define as "pre-meal sensations" the sensations recorded immediately before the tested meal (7,8,11,13,14,18–20,22,25,27–
34,36,37,40,43)
. The remaining 6 studies assessed pre-lunch sensations 1 hour before the meal (26), 20 minutes before the meal (21) or 5 minutes before the meal (24). Three studies did not specify the timing of the VAS (15,23,35). Two studies also assessed appetite feelings during the meal
(23,24)
. Regarding the use of post-meal appetite sensations for calculating SQ, 8 studies evaluated them up to 60 minutes after the end of food intake (7,8,13,23,28,29,33,37), 5 studies up to 120 minutes after the end of food intake (20,27,32,34,36), 4 up to 180 minutes after the end of food intake (18,22,25,31) and 3 up to 240 minutes after the end of food intake (6,11,40). Hopkins et al. reported appetite sensations every hour after the end of the meal until the next meal (19) while Chapman et al. assessed appetite sensations up to 5 hours after the end of the meal (26). Green et al. measured appetite sensations up to 75 minutes after food intake (6), Schmidt et al. reported post-meal appetite sensations up to 25 minutes after the meal (24) and finally, Harrington et al. reported post-meal appetite sensations immediately after the end of the meal
(43)
. The study from Blight et al. reported appetite sensations up to 175 minutes after the start of food intake, while Dalton et al. reported these sensations up to 90 minutes after the start of the meal. The timing of VAS are summarized in detail in Table 3.
Type of meal
Finally, SQ was also calculated in response to different meals. Among the included acute studies, 13 used a standardized fixed meal to calculate SQ (7,8,13,21,22,28–30,32–34,36,37), while 3 used an individualized meal based on percentage of energy needs (14,31,35) and 6 used an ad libitum meal (20,23–26,43). Six studies calculated the SQ on both types of meals: standardized and
ht tp s://w w w .camb rid ge.or g/cor e . IP ad dr ess: 94 .1 3.1 01 .2 26 , on 2 1 Ju l 2 02 0 at 0 8:3 7:0 2, su bject to th e Camb rid ge Cor e ter ms of u se, av ai lab le at ht tp s://w w w .camb rid ge.or g/cor e/t er ms . ht tp s://d oi .or g/1 0.1 01 7/S 00 07 11 45 20 00 24 57
ad libitum (6,11,18,19,27,40). One study did not specify the type of meal used to calculate the SQ
(15)
. Table 3 details the different meals used in the included studies.
Acute studies conducted in children and adolescents Main aim, population and design
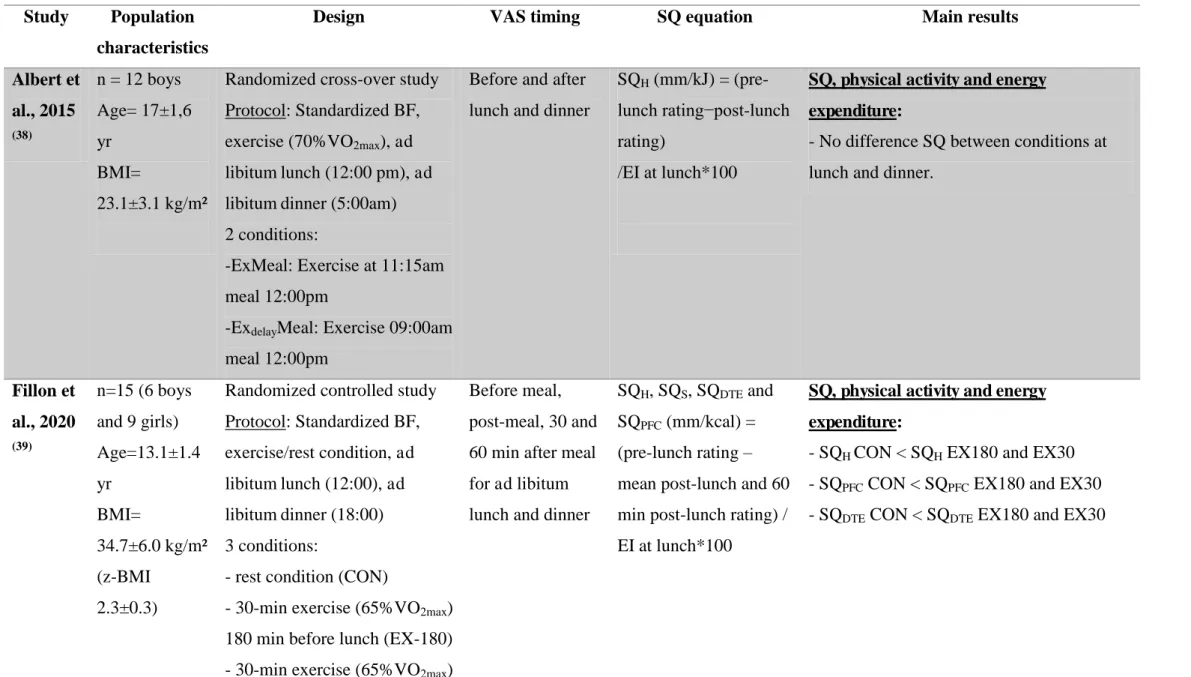
The main aims, populations and used designs are presented in Table 4 and fully detailed in supplementary materials.
Methods
Calculation of SQ
Three of the included studies used pen and paper VAS (38,39,42), and Kral and collaborators did not specify the type of scale used (41). In their studies, Thivel et al. and Fillon et al. used 150-mm scales (39,42) and Albert et al. et Kral et al. used 100-mm scales (38,41). Albert and colleagues (38) assessed “Desire To Eat ”, “Hunger”, “Fullness”, “Anticipated Food Consumption”, “Desire for specific food types”, “Palatability”, “Appreciation” and “Visual
appeal”. The others assessed “Desire To Eat ”, “Hunger”, “Fullness” and “Prospective Food
Consumption” (39,41,42).
Regarding the calculation of SQ, all of the included studies used the equation proposed by Drapeau et al. (2007) (appetite sensation pre-meal - appetite sensation post-meal) / EI of eating episode * 100. While Albert et al. only used the immediate post-meal sensation in the equation (38), the three other studies used a mean of post-meal sensations assessed: immediately post-meal, 30 minutes and 60 minutes post-meal in Thivel et al. et Fillon et al.’s studies (39,42), and immediately post-meal and 15 minutes post-meal in Kral et al. (41).
Although Albert et al. (38) assessed different appetite sensations, they only calculated the SQH while the three other studies calculated the SQ for each of the appetite sensations
assessed: Desire To Eat , Hunger, Fullness and Satiety (39,41,42). All studies calculated their SQ using an ad libitum lunch meal.
ht tp s://w w w .camb rid ge.or g/cor e . IP ad dr ess: 94 .1 3.1 01 .2 26 , on 2 1 Ju l 2 02 0 at 0 8:3 7:0 2, su bject to th e Camb rid ge Cor e ter ms of u se, av ai lab le at ht tp s://w w w .camb rid ge.or g/cor e/t er ms . ht tp s://d oi .or g/1 0.1 01 7/S 00 07 11 45 20 00 24 57
Chronic studies conducted in adults Main aim, population and design
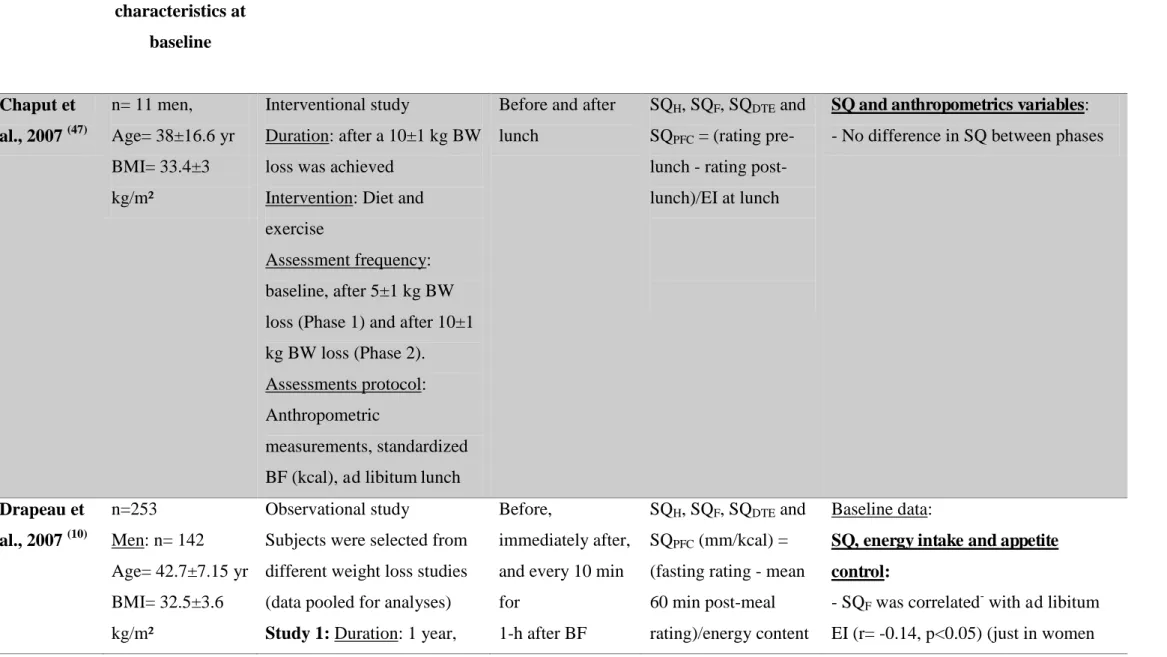
The main aims, populations and used designs are presented in Table 4 and fully detailed in supplementary materials.
Methods Topics
Eighty-four percent of the included chronic studies investigated the SQ in response to lifestyle changes (e.g. changing from inactive to active) or physiological modifications (e.g. pre- vs. post-menopause in women) (9,10,44–52,54–57,59) while 3 of these 19 studies used SQ as a tool to classify the population as low and high satiety phenotype (12,53,58).
Two observational studies were included and examined the association between SQ and the change of EI, BW and body composition over time (9,10).
Among the included interventional studies, 7 assessed the effect of different dietary prescriptions on SQ (12,44–46,55,58,59) while 2 assessed the effect of different physical activity prescriptions on SQ (50,57). One study investigated the effect of a prescription combining physical activity and dietary interventions on SQ (47). One assessed the effect of weight change on SQ (48)
and three others more specifically on the effect of different energy restrictions on SQ change (53,54,59). Bédard and colleagues investigated the effect of sex on SQ
(49)
and Carbonneau et al. the effect of different nutritional labelling (52). Finally, the effect of probiotic (51) or pharmaceutical (56) compounds on the change of SQ was also tested.
VAS
Fifteen studies used pen and paper VAS (9,10,12,45–49,51–54,56,58,59) while the other 4 used electronic VAS. Of the 15 that used the pen and paper method, 6 used 100-mm scales
(45,46,54,56,58,59)
while the others used 150-mm scales (9,10,12,47–49,51–53). With regards to electronic VAS, one study used a 7-point scale (44), another used a scale ranging from -3 to 3 (55) and finally 2 studies did not specify the length of the scales used (50,57).
Sixteen of the 19 studies analyzed "Hunger" (9,10,12,45–54,56,57,59) and 15 assessed "Fullness"
(9,10,12,47–54,56–59)
. Thirteen studies investigated "Desire To Eat" (9,10,12,47–51,53,54,56,57,59) and 12 assessed "Prospective Food Consumption" (9,10,12,47–51,53,54,56,59). Two studies used a single scale with "Hunger" and "Fullness" as extremes (44,55).
ht tp s://w w w .camb rid ge.or g/cor e . IP ad dr ess: 94 .1 3.1 01 .2 26 , on 2 1 Ju l 2 02 0 at 0 8:3 7:0 2, su bject to th e Camb rid ge Cor e ter ms of u se, av ai lab le at ht tp s://w w w .camb rid ge.or g/cor e/t er ms . ht tp s://d oi .or g/1 0.1 01 7/S 00 07 11 45 20 00 24 57
Calculation of SQ Equations used
Seventy-four percent of the included studies used the following equation proposed by Drapeau et al. (10,13): (appetite sensation pre-meal - appetite sensation post-meal) / EI of eating episode * 100 (9,10,12,45,46,48–54,57,59). Buckland et al. used the same equation, but they subtracted post-meal sensation from pre-meal sensation, because they evaluated just “Fullness” (58). Hintze et al. reversed also the order of subtraction between appetite sensations contrary to what was done by Drapeau, subtracting pre-meal sensations from post-meal sensations, for SQF (54). Three studies used the same equation without multiplying the result by 100 (44,47,56)
and one study did not clearly specify the equation used (55). Appetite sensations used
On the 19 chronic studies, 15 calculated SQH(9,10,12,45–48,50–54,56,57,59), 14 SQF(9,10,12,44,47– 49,51–56,58)
and 9 SQDTE(9,10,12,47,48,51,53,54,56) and SQPFC (9,10,12,47,48,51,53,54,56) (see Table 5).
Timing of the sensations used
More specifically, all studies considered as "pre-meal appetite sensation" the sensations given immediately before the meal. With regard to "post-meal appetite sensation", 5 studies used only the sensations immediately after the meal (45,47–49,52) and 2 studies considered the post-meal sensations as the sensations recorded 30 minutes after the start of ingestion (44,55). Others averaged appetite sensations immediately after eating with appetite sensations 1 hour after eating (57), or every 10 minutes for 1 hour (10,51,53), or every 10 minutes for 1 hour plus 90 minutes and 120 minutes after eating (12). Three studies used the average appetite sensation immediately after eating with the sensations reported every 30 minutes for 3 hours (9,54,59) while Halford et al. (56) and Buckland et al. (58) used the same protocol but with appetite sensation evaluations every hour for 3 hours and not every 30 minutes. Finally, Golloso-Gubat and colleagues (46) used the average of appetite sensation at 15, 30, 45, 60, 90, 120, 150, 180, 240 minutes after the meal to calculate "post-meal appetite sensation". One study (50) indicated that it had integrated in the calculation of the post-meal sensations the
ht tp s://w w w .camb rid ge.or g/cor e . IP ad dr ess: 94 .1 3.1 01 .2 26 , on 2 1 Ju l 2 02 0 at 0 8:3 7:0 2, su bject to th e Camb rid ge Cor e ter ms of u se, av ai lab le at ht tp s://w w w .camb rid ge.or g/cor e/t er ms . ht tp s://d oi .or g/1 0.1 01 7/S 00 07 11 45 20 00 24 57
sensations of appetite immediately after the meal as well as sensations assessed periodically between the 2 meals (Table 5).
Type of meal
Out of the 19 included studies, 7 calculated the SQ in response to a standardized fixed meal (9,10,12,46,48,51,53) while 5 used an ad libitum meal (44,45,47,52,55) with one study using both type of meals (56). Six studies (49,50,54,57–59) calculated the SQ on an individualized meal based on a percentage of energy needs.
Main Results
By adopting a systematic overview of all the included studies, a large heterogeneity is observed when it comes to the purpose of using SQ. While all details are presented in Tables 3, 4 and 5, five main methodological uses of the SQ can be identified: i) the association between SQ and energy intake (7–9,12,15,18,19,21,22,25,27,32,36,40,44–46,49,54,55,58,59); ii) the association between the SQ and anthropometric variables (8–11,47,48,53,59); iii) the association between SQ and energy expenditure/physical activity (7,14,37,43,50,57); iv) the association between SQ and sleep quality and quantity (20,29,31); v) SQ to classify individuals into low and high satiety phenotypes (13–15,40,53,58).
The following sections presents and categorizes the main results observed in the included studies. While only the main methodological aspects and results related to the use of the SQ are details in this section, the Tables 3, 4 and 5 presents the full details of the included studies.
Association between SQ and energy and macronutrient intake
First, four of the included studies demonstrate that SQ is a predictor of food intake (7–10). The systematic analysis of these studies shows that SQF (8–10), SQH (7), SQPFC (9) and mean SQ (9)
predict EI and SQF predicts relative EI too (subtracting resting metabolic rate from total
energy intake) (8). A distinction is made in the studies between objectively measured EI and self-reported EI using food diaries, with SQDTE, SQH, SQF(7) and SQPFC(9) predicting reported
EI only. More specifically, according to these studies, macronutrient intake could be predicted by SQF, SQPFC and mean SQ (9) and SQF could also predict CHO intake in food diaries (9). In
ht tp s://w w w .camb rid ge.or g/cor e . IP ad dr ess: 94 .1 3.1 01 .2 26 , on 2 1 Ju l 2 02 0 at 0 8:3 7:0 2, su bject to th e Camb rid ge Cor e ter ms of u se, av ai lab le at ht tp s://w w w .camb rid ge.or g/cor e/t er ms . ht tp s://d oi .or g/1 0.1 01 7/S 00 07 11 45 20 00 24 57
children, Kral et al. suggest that energy density may influence satiety responsiveness and that SQ may predict IE (41) .
Association between SQ and anthropometric variables
Five of the included studies show associations between the SQ and anthropometric or body composition variables (8,9,11,53,58,59). Concerning BW, we observe that individuals with high satiety phenotype lost more BW than those with a low satiety phenotype (12,53,58) and we find the same conclusions regarding waist circumference in women with obesity (58). In fact, individuals with a high waist circumference had lower satiating effect determined by the SQF (11)
and McNeil et al. showed in their 5-year study that changes in SQ was negatively correlated with the change in waist circumference (9). With regards to the relationship between SQ and fat mass, Salama et al. found a positive relationship between % fat mass and SQF(11).
In their longitudinal study, McNeil et al. found a positive correlation between the SQ and fat mass changes (delta) over the entire study, although they found a negative correlation between year 4 and year 5 (9).
Association between SQ and energy expenditure/physical activity
Three of the included studies show contradictory associations between SQ and exercise or the level of physical activity (25,43,50,57). Some cross-sectional results suggest a decrease in SQ, indicating a lower satiety responsiveness, in lean individuals with high activity-related energy expenditure (43) while others show no effect of habitual physical activity level on SQ in non-obese individuals (25). In individuals with overweight and obesity, a 12-week exercise intervention led to increased satiety responsiveness to a fixed meal (50,57).
With regard to studies in children, it can be observed that the timing between exercise and a meal (37,43) or the use of an energy replacement strategy (9) have no effect on SQ and that no particular association was found with SQ. However, a better satiety responsiveness (higher SQ) was observed when exercise is performed just before a meal vs. a rest condition (43). SQ to classify individuals into low and high satiety phenotypes
Six of the included studies support the SQ as a reliable tool to phenotype individuals based on their satiety responsiveness (12–15,53,58). Indeed, compared to individuals with a high satiety phenotype, individuals with a low satiety phenotype have higher EI, greater cravings for sweet foods, lower craving control, higher disinhibition and fasting Hunger, Desire To Eat and Prospective Food Consumption and exhibit a higher wanting for high-fat food (14,15,58).
ht tp s://w w w .camb rid ge.or g/cor e . IP ad dr ess: 94 .1 3.1 01 .2 26 , on 2 1 Ju l 2 02 0 at 0 8:3 7:0 2, su bject to th e Camb rid ge Cor e ter ms of u se, av ai lab le at ht tp s://w w w .camb rid ge.or g/cor e/t er ms . ht tp s://d oi .or g/1 0.1 01 7/S 00 07 11 45 20 00 24 57
The behavioral and psychological characteristics of the low satiety phenotype are associated with a greater susceptibility to overconsumption (14,15). These results are also corroborated by another study, where Drapeau et al. indicate that the higher increase in cognitive restraint and a lower decrease in disinhibition in response to a weight loss intervention could increase the susceptibility of these individuals to weight gain (53), these results being in agreement with another work from Drapeau et al. showing that SQ negatively correlated with the external locus for Hunger measured by the Three-Factor Eating Questionnaire (13). Moreover, Buckland et al. found a weaker control over eating and weight loss program adherence in people with a low satiety phenotype, as well as a lower weight loss compared with people with a high satiety phenotypes(58).
Discussion
While there has been a growing use of the SQ in clinical studies since its development by Green and colleagues in 1997 (6), little attention has been paid regarding its use since then and a high methodological heterogeneity can be observed between studies. A better understanding of the SQ and its clinical implication is of particular interest since, as shown by several studies, by including both pre-meal sensation and the energy content of the meal in its calculation, it seems to provide different information than appetite sensations alone. Indeed, some studies have observed different results for appetite sensations and SQ in response to various stimuli (such as exercise or sleep for instance) (31,37) . In that context, the present review aimed to systematically analyze the available evidence regarding the scientific and clinical use of the SQ. Fifty-two studies were included after our database search, 33 of them being cross-sectional/acute (6–8,11,13–15,18–42) and 19 being longitudinal (9,10,12,43–59). The large majority of the included studies enrolled adults participants with only 4 enrolling children and adolescents (38,39,41,42).
According to our analysis, acute studies mainly used the SQ to compare the satiating effect of different kinds of meals varying in texture (liquid and solid)
(6,14,15,18,19,21,22,25,27,28,30,32–36,40)
, energy content (14,28,33,41) or composition
(6,15,18,19,21,25,27,30,34,36,40)
. Some of these acute investigations also assessed the effect of sleep characteristics (i.e. timing, quality or duration) (20,29,31), exercise (7,37), mental work (11), gender
(8)
or pharmaceuticals (23,24,26) on the SQ. Regarding the interventional studies included in our analysis, they mainly used the SQ to evaluate the effect of different dietary and/or exercise interventions (12,44–47,50,51,53–55,57,59) on the SQ. Finally, some studies (acute and chronic) used the SQ to classify individuals as low or high satiety phenotypes (13–15,40,53,58).
ht tp s://w w w .camb rid ge.or g/cor e . IP ad dr ess: 94 .1 3.1 01 .2 26 , on 2 1 Ju l 2 02 0 at 0 8:3 7:0 2, su bject to th e Camb rid ge Cor e ter ms of u se, av ai lab le at ht tp s://w w w .camb rid ge.or g/cor e/t er ms . ht tp s://d oi .or g/1 0.1 01 7/S 00 07 11 45 20 00 24 57
Clinical utility and reliability of the SQ
According to the present systematic approach, the use of the SQ might be a reliable predictor of both measured (7–10,58) and reported (7,9,10) energy intake, as well as macronutrient intake (9). Studies effectively highlight higher food consumption with lower satiety responsiveness to a meal (lower SQ) in T1D (7), healthy women (15), men and women with overweight (8), premenopausal women (9) and women with obesity (54,58). This is reinforced by other results demonstrating negative associations between SQ and BW, waist circumference as well as fat mass (9,11,53,58). Importantly, Drapeau et al. (53) found a positive association between SQ and weight loss in response to an energy restriction intervention in men and women with obesity, like Buckland et al. in women with obesity (58). The SQ has been used as a clinical tool to categorize people depending on their level of satiety responsiveness to a standardized fixed meal; a low phenotype characterizing people who report difficulties in appropriately recognizing their appetite sensations before or after a meal (8). These results are supplemented by those of Buckland et al., which have shown that people with low satiety phenotype have a weaker control over eating and weight loss program adherence compared to people with high satiety phenotype (58). Moreover, people with low satiety phenotype prefer and consume more of high energy density food than people with high satiety phenotype (58). While most studies use a median split to categorize low and high satiety phenotypes, in a clinical context, a low satiety phenotype might be observed in about 10% of patients with obesity who declare themselves as unable to detect changes in their appetite, report a weak satiety response to a meal and even show an increase in appetite after a meal for some of them
(60)
. Altogether these results suggest that the SQ is an interesting clinical indicator to identify adults at risk of overeating and thus could be used in preventive strategies and weight loss interventions. Moreover, while the literature seems to suggest the SQ and the SQ phenotype as complementary tools to already existing subjective methods (such as the evaluation of disinhibition using the TFEQ), providing additional information regarding the risk of overeating for instance, comparison studies are still missing and should be conducted.
Interestingly, while the SQ has been studied in the context of nutritional manipulations, some studies also examined its relationship and response to physical activity and exercise. According to these studies, moderate physical activity levels in lean individuals and exercise training in individuals with overweight and obesity are associated with a higher SQ, suggesting an improved satiety responsiveness (43,50,57). However, this was not the case in studies measuring SQ at an ad libitum meal in lean individuals with very high physical
ht tp s://w w w .camb rid ge.or g/cor e . IP ad dr ess: 94 .1 3.1 01 .2 26 , on 2 1 Ju l 2 02 0 at 0 8:3 7:0 2, su bject to th e Camb rid ge Cor e ter ms of u se, av ai lab le at ht tp s://w w w .camb rid ge.or g/cor e/t er ms . ht tp s://d oi .or g/1 0.1 01 7/S 00 07 11 45 20 00 24 57
activity levels, one of which showing lower SQ (43) and another showing similar SQ (25) than their less active counterparts. Using a different methodology to assess the satiety response to food (preload-test meal protocol), other studies have shown that physically active individuals have better ability to adjust subsequent energy intake following preloads differing in energy content (61,62). These results, whether using the SQ or energy compensation following a preload as an indicator of satiety responsiveness, illustrate a relationship between physical activity, food intake and appetite control (63). Here again, it suggests the clinical interest of the SQ as part of multidisciplinary approaches developed to prevent and treat obesity in adults. According to our systematic approach, only few (n=4 out of 52) studies very recently used the SQ among children and adolescents. Three of them investigated the effect of acute exercise on the subsequent satiating effect of a meal (38,39,42) and the last, the effect of different preload energy density on satiety responsiveness. While two of these studies did not observe any effect of an acute exercise bout on the SQ calculated on the following ad libitum meal
(38,42)
, Fillon et al. found increased SQ for Hunger, Prospective Food Consumption and Desire To Eat after acute moderate intensity exercise in adolescents with obesity (39). Kral and coworkers suggested a beneficial effect of a low energy density preload on satiety responsiveness in children (41). In addition to the lack of available evidence regarding the use of the SQ in youth, the absence of any validation study in his population must be highlighted. Indeed, it remains unknown whether the SQ is a clinically valid and reliable tool to be used in children and adolescents. Based on the increasing interest in the appetite control of children and adolescents, particularly in those with obesity, our research group recently conducted a methodological study assessing the reproducibility of SQ and its validity as an indicator of body corpulence and composition as well as of EI in adolescents with obesity (64). Although SQH showed a relatively modest reproducibility, none of the other SQ variables were found
reproducible and no association were found with anthropometric variables, body composition or EI (64). This clearly calls for caution when interpreting existing results and for further studies developing reliable tools to measure the satiating effect of food in this population. Methodological considerations
Our systematic analysis reveals a high level of heterogeneity regarding the methods used (equation used, type of meal, timing of the measurements of appetite sensations, etc.). While the SQ has been suggested as reliable and reproducible in adults, especially men with obesity (ICC for the SQ mean of 0.67) (13,14), more studies are needed to assess its validity and reproducibility in various contexts and populations.
ht tp s://w w w .camb rid ge.or g/cor e . IP ad dr ess: 94 .1 3.1 01 .2 26 , on 2 1 Ju l 2 02 0 at 0 8:3 7:0 2, su bject to th e Camb rid ge Cor e ter ms of u se, av ai lab le at ht tp s://w w w .camb rid ge.or g/cor e/t er ms . ht tp s://d oi .or g/1 0.1 01 7/S 00 07 11 45 20 00 24 57
While 43 out of the 48 adults studies included (6–14,18–20,22–37,40,43–54,56–59) used the equation initially developed by Green and colleagues (6), others used derived equations
(11,23,26,27)
or did not specify the equation used (15,21,55). Similarly, as detailed in the tables and results section, the VAS used (e.g. 100 vs. 150 mm) and the timing of the measurements of appetite sensations, with some studies only using the post-meal appetite sensation while others using the mean of the appetite sensations for up to several hours post-meal, vary between studies making any comparisons difficult. Since appetite sensations are dynamic, and postprandial effects might be detected and integrated by individuals at different post-meal intervals, it would be of interest to better examine the best postprandial timing to use when calculating SQ. Importantly, while the SQ has been validated under standardized conditions and mainly using a fixed meal (8,14), 37,5% (n=18) of the included studies used an ad libitum meal to calculate the SQ (6,11,18–20,23–27,30,40,43,44,47,52,55,56). Gonzalez and collaborators examined the accuracy of the SQ depending on the energy content of the ingested meal and observed a better reproducibility and reliability of SQ (mean SQ as well as SQH, SQF, SQPFC, SQS) in
response to higher energy content compared to meals of lower energy content (33). Finally, while the validity of the SQ among men (13) and women (14) was suggested, it has been widely used among specific populations such as individuals with diabetes (7,26), premenopausal women (9,28), people with different levels of physical activity (25), people with overweight and obesity (8,10,12,13,19,24,26,29,45,47,57,59), and shows a highly variable degree of correlations between studies (as detailed in tables 3 and 5). Once more, this must lead us to interpret these results with caution and calls for more methodological validations.
Conclusion
While the current systematic review suggests the reliability of the SQ in adults and encourages its use as an interesting clinical tool regarding the satiety responsiveness to a meal and its changes in responses to weight loss; we also encourage the adoption of a more standardized use of the SQ as well as the development of additional studies assessing its validity in several contexts and populations, especially among children and adolescents. Further studies should also be conducted to identify the potential biological markers associated with this SQ. Based on the present systematic analysis, we encourage future studies to assess SQ for Hunger, Fullness, Desire To Eat and Prospective Food Consumption after an overnight fast in response to a standardized fixed meal, without intense physical activity, and to consistently use a validated equation (such as the one initially proposed by Drapeau et al.
(10,13)
). This would allow for more reliable outcomes and better comparisons across studies.
ht tp s://w w w .camb rid ge.or g/cor e . IP ad dr ess: 94 .1 3.1 01 .2 26 , on 2 1 Ju l 2 02 0 at 0 8:3 7:0 2, su bject to th e Camb rid ge Cor e ter ms of u se, av ai lab le at ht tp s://w w w .camb rid ge.or g/cor e/t er ms . ht tp s://d oi .or g/1 0.1 01 7/S 00 07 11 45 20 00 24 57
Funding
This research received no specific grant from any funding agency, commercial or not-for-profit sectors.
Acknowledgements
We would particularly like to thank Mr Denis Arvisais, documentalist at the University of Montreal, who helped us during the collection of the studies. We also thank the Mitacs Globalink grant, who supported this work.
Conflict of Interest
The authors have no conflicts of interest to disclose. The authors have no financial relationships relevant to this article to disclose.
Authorship
AF, DT, VD and AT conceived the idea and conceptualized the review. AF and DT conducted the study selection, data extraction, and methodological quality assessment. AF drafted the initial manuscript. AF, DT, KB and VD contributed to writing the manuscript. All authors read and approved the final manuscript.
ht tp s://w w w .camb rid ge.or g/cor e . IP ad dr ess: 94 .1 3.1 01 .2 26 , on 2 1 Ju l 2 02 0 at 0 8:3 7:0 2, su bject to th e Camb rid ge Cor e ter ms of u se, av ai lab le at ht tp s://w w w .camb rid ge.or g/cor e/t er ms . ht tp s://d oi .or g/1 0.1 01 7/S 00 07 11 45 20 00 24 57
References
1. Obésité et surpoids. https://www.who.int/fr/news-room/fact-sheets/detail/obesity-and-overweight (accessed March 2019).
2. Blundell JE, Gibbons C, Caudwell P, et al. (2015) Appetite control and energy balance: impact of exercise. Obes. Rev. 16, 67 76.
3. Hopkins M, Duarte C, Beaulieu K, et al. (2019) Activity energy expenditure is an independent predictor of energy intake in humans. Int. J. Obes. 2005.
4. Harris RBS (editor) (2017) Appetite and Food Intake: Central Control. 2nd ed. Boca Raton (FL): CRC Press/Taylor & Francis.
5. Blundell J & Finlayson G Mechanisms and biomarkers of appetite control. In Food Texture Food
Intake Role Oral Sens. Expo., vol. 19(5 Suppl.), Agro Food Industry Hi-Tech, pp. 18 20.
6. Green SM, Delargy HJ, Joanes D, et al. (1997) A satiety quotient: a formulation to assess the satiating effect of food. Appetite 29, 291 304.
7. Dubé M-C, Tremblay A, Lavoie C, et al. (2013) Effect of exercise on food consumption and appetite sensations in subjects with diabetes. Appetite 71, 403 410.
8. Drapeau V, Blundell J, Therrien F, et al. (2005) Appetite sensations as a marker of overall intake.
Br. J. Nutr. 93, 273 280.
9. M N J P D S I (2014) Satiety quotient linked to food intake and changes in anthropometry during menopause: a MONET Study. Climacteric J. Int. Menopause
Soc. 17, 449 455.
10. Drapeau V, King N, Hetherington M, et al. (2007) Appetite sensations and satiety quotient: predictors of energy intake and weight loss. Appetite 48, 159 166.
11. Salama M, Drapeau V, Tremblay A, et al. (2016) The impact of a mental work on food preferences, eating behavior traits and satiety efficiency. Physiol. Behav. 154, 191 195.
12. Arguin H, Tremblay A, Blundell JE, et al. (2017) Impact of a non-restrictive satiating diet on anthropometrics, satiety responsiveness and eating behaviour traits in obese men displaying a high or a low satiety phenotype. Br. J. Nutr. 118, 750 760.
ht tp s://w w w .camb rid ge.or g/cor e . IP ad dr ess: 94 .1 3.1 01 .2 26 , on 2 1 Ju l 2 02 0 at 0 8:3 7:0 2, su bject to th e Camb rid ge Cor e ter ms of u se, av ai lab le at ht tp s://w w w .camb rid ge.or g/cor e/t er ms . ht tp s://d oi .or g/1 0.1 01 7/S 00 07 11 45 20 00 24 57
13. Drapeau V, Blundell J, Gallant AR, et al. (2013) Behavioural and metabolic characterisation of the low satiety phenotype. Appetite 70, 67 72.
14. Dalton M, Hollingworth S, Blundell J, et al. (2015) Weak Satiety Responsiveness Is a Reliable Trait Associated with Hedonic Risk Factors for Overeating among Women. Nutrients 7, 7421 7436.
15. Hollingworth S, Dalton M, Blundell J, et al. (2018) Evaluation of the influence of different snack foods on appetite control in the low satiety phenotype. Appetite 123, 458.
16. Liberati A, Altman DG, Tetzlaff J, et al. (2009) The PRISMA statement for reporting systematic reviews and meta-analyses of studies that evaluate health care interventions: explanation and elaboration. J. Clin. Epidemiol. 62, e1 e34.
17. Higgins J & Green S (2008) Cochrane handbook for systematic reviews of interventions. .
18. Hansen TT, Sjodin A, Ritz C, et al. (2018) Macronutrient manipulations of cheese resulted in lower energy content without compromising its satiating capacity. J Nutr Sci 7, e7.
19. Hopkins M, Gibbons C, Caudwell P, et al. (2016) Differing effects of fat or high-carbohydrate meals on food hedonics in overweight and obese individuals. Br J Nutr 115, 1875 84.
20. Polugrudov A, Popov S, Smirnov V, et al. (2017) Association of social jetlag experienced by young northerners with their appetite after having breakfast. Biol. Rhythm Res. 48, 917 929. 21. Bligh HF, Godsland IF, Frost G, et al. (2015) Plant-rich mixed meals based on Palaeolithic diet
principles have a dramatic impact on incretin, peptide YY and satiety response, but show little effect on glucose and insulin homeostasis: an acute-effects randomised study. Br J Nutr 113, 574 84.
22. Defries DM, Petkau JC, Gregor T, et al. (2017) A randomized, controlled, crossover study of appetite-related sensations after consuming snacks made from buckwheat. Appl. Physiol. Nutr.
Metab. 43, 194 202.
23. Thomas JM, Dourish CT, Tomlinson JW, et al. (2014) Effects of the 5-HT2C receptor agonist meta- chlorophenylpiperazine on appetite, food intake and emotional processing in healthy volunteers. Psychopharmacology (Berl.) 231, 2449 2459.
ht tp s://w w w .camb rid ge.or g/cor e . IP ad dr ess: 94 .1 3.1 01 .2 26 , on 2 1 Ju l 2 02 0 at 0 8:3 7:0 2, su bject to th e Camb rid ge Cor e ter ms of u se, av ai lab le at ht tp s://w w w .camb rid ge.or g/cor e/t er ms . ht tp s://d oi .or g/1 0.1 01 7/S 00 07 11 45 20 00 24 57
24. Schmidt JB, Gregersen NT, Pedersen SD, et al. (2014) Effects of PYY3-36 and GLP-1 on energy intake, energy expenditure, and appetite in overweight men. Am. J. Physiol. - Endocrinol.
Metab. 306, E1248 E1256.
25. Beaulieu K, Hopkins M, Blundell J, et al. (2017) Impact of physical activity level and dietary fat content on passive overconsumption of energy in non-obese adults. Int. J. Behav. Nutr. Phys.
Act. 14, 14.
26. Chapman I, Parker B, Doran S, et al. (2005) Effect of pramlintide on satiety and food intake in obese subjects and subjects with type 2 diabetes. Diabetologia 48, 838 848.
27. Martini D, Brusamolino A, Del Bo C, et al. (2018) Effect of fiber and protein-enriched pasta formulations on satiety-related sensations and afternoon snacking in Italian healthy female subjects. Physiol. Behav. 185, 61 69.
28. Blanchet R, Lemieux S, Couture P, et al. (2011) Effects of neuromedin- on caloric compensation, eating behaviours and habitual food intake. Appetite 57, 21 27.
29. McNeil J, Drapeau V, Gallant AR, et al. (2013) Short sleep duration is associated with a lower mean satiety quotient in overweight and obese men. Eur. J. Clin. Nutr. 67, 1328 1330.
30. Au-Yeung F, Jovanovski E, Jenkins AL, et al. (2018) The effects of gelled konjac glucomannan fibre on appetite and energy intake in healthy individuals: a randomised cross-over trial. Br. J.
Nutr. 119, 109 116.
31. McNeil J, Forest G, Hintze LJ, et al. (2017) The effects of partial sleep restriction and altered sleep timing on appetite and food reward. Appetite 109, 48 56.
32. Felix AD, Trinidad TP, Tuano APP, et al. (2013) Short-Term Satiety of Cooked Philippine Rices of Varying Apparent Amy lose Content and Glycemic Index. Philipp. Agric. Sci. 96, 179 186.
33. Gonzalez JT, Frampton J & Deighton K (2017) Postprandial suppression of appetite is more reproducible at a group than an individual level: Implications for assessing inter-individual variability. Appetite 108, 375 382.
34. Kendall CW, Esfahani A, Sanders LM, et al. (2010) The effect of a pre-load meal containing resistant starch on spontaneousfood intake and glucose and insulin responses. J. Food Technol. 8, 67 73. ht tp s://w w w .camb rid ge.or g/cor e . IP ad dr ess: 94 .1 3.1 01 .2 26 , on 2 1 Ju l 2 02 0 at 0 8:3 7:0 2, su bject to th e Camb rid ge Cor e ter ms of u se, av ai lab le at ht tp s://w w w .camb rid ge.or g/cor e/t er ms . ht tp s://d oi .or g/1 0.1 01 7/S 00 07 11 45 20 00 24 57
35. Finlayson G, Bordes I, Griffioen-Roose S, et al. (2011) Susceptibility to Overeating Affects the Impact of Savory or Sweet Drinks on Satiation, Reward, and Food Intake in Nonobese Women 3. J. Nutr. 142, 125 130.
36. Felix AD, Tuano APP, Mallillin AC, et al. (2016) Short-term Satiety of Brown Rice and Milled Rice.
Philipp. J. Crop Sci. 41, 52 59.
37. Thivel D, Fillon A, Genin PM, et al. (2020) Satiety Responsiveness but not Food Reward is modified in response to an acute bout of low versus high intensity exercise in healthy adults.
Appetite 145, 104500.
38. Albert M-H, Drapeau V & Mathieu M-E (2015) Timing of moderate-to-vigorous exercise and its impact on subsequent energy intake in young males. Physiol. Behav. 151, 557 562.
39. Fillon A, Mathieu M-E, Masurier J, et al. (2020) Effect of exercise-meal timing on energy intake, appetite and food reward in adolescents with obesity: the TIMEX study. Appetite 146, 104506.
40. Arguin H, Gagnon-Sweeney M, Pigeon É, et al. (2012) Functional food and satiety. Impact of a satiating context effect on appetite control of non-obese men. Appetite 58, 354 363.
41. Kral TVE, Moore RH, Chittams J, et al. (2020) Caloric compensation and appetite control in children of different weight status and predisposition to obesity. Appetite 36, 42 55.
42. Thivel D, Roche J, Miguet M, et al. (2020) Post-moderate-intensity exercise energy replacement does not reduce subsequent appetite and energy intake in adolescents with obesity. Br. J. Nutr. 123, 592 600.
43. Harrington DM, Martin CK, Ravussin E, et al. (2013) Activity related energy expenditure, appetite and energy intake. Potential implications for weight management. Appetite 67, 1 7. 44. Jönsson T, Granfeldt Y, Erlanson-Albertsson C, et al. (2010) A paleolithic diet is more satiating
per calorie than a mediterranean-like diet in individuals with ischemic heart disease. Nutr.
Metab. 7, 85.
45. Rodríguez-Rodríguez E, Aparicio A, Bermejo LM, et al. (2009) Changes in the sensation of hunger and well-being before and after meals in overweight/obese women following two types of hypoenergetic diet. Public Health Nutr. 12, 44 50.
ht tp s://w w w .camb rid ge.or g/cor e . IP ad dr ess: 94 .1 3.1 01 .2 26 , on 2 1 Ju l 2 02 0 at 0 8:3 7:0 2, su bject to th e Camb rid ge Cor e ter ms of u se, av ai lab le at ht tp s://w w w .camb rid ge.or g/cor e/t er ms . ht tp s://d oi .or g/1 0.1 01 7/S 00 07 11 45 20 00 24 57
46. Golloso-Gubat MJ, Magtibay EVJ, Nacis JS, et al. (2016) Differences in Satiating Effects of White Rice and Brown Rice in Selected Filipino Adults. Philipp. J. Crop Sci. 41, 55 60.
47. Chaput JP, Pelletier C, Despres JP, et al. (2007) Metabolic and behavioral vulnerability related to weight regain in reduced-obese men might be prevented by an adequate diet-exercise intervention. Appetite 49, 691 695.
48. Gilbert JA, Drapeau V, Astrup A, et al. (2009) Relationship between diet-induced changes in body fat and appetite sensations in women. Appetite 52, 809 812.
49. Bédard A, Hudon A-M, Drapeau V, et al. (2015) Gender differences in the appetite response to a satiating diet. J. Obes. 2015.
50. King NA, Caudwell PP, Hopkins M, et al. (2009) Dual-process action of exercise on appetite control: increase in orexigenic drive but improvement in meal-induced satiety. Am. J. Clin. Nutr. 90, 921 927.
51. Sanchez M, Darimont C, Panahi S, et al. (2017) Effects of a Diet-Based Weight-Reducing Program with Probiotic Supplementation on Satiety Efficiency, Eating Behaviour Traits, and Psychosocial Behaviours in Obese Individuals. Nutrients 9.
52. Carbonneau E, Perron J, Drapeau V, et al. (2015) Impact of nutritional labelling on 10-d energy intake, appetite perceptions and attitudes towards food. Br. J. Nutr. 114, 2138 2147.
53. Drapeau V, Jacob R, Panahi S, et al. (2019) Effect of Energy Restriction on Eating Behavior Traits and Psychobehavioral Factors in the Low Satiety Phenotype. Nutrients 11.
54. Hintze LJ, Goldfield G, Seguin R, et al. (2019) The rate of weight loss does not affect resting energy expenditure and appetite sensations differently in women living with overweight and obesity. Physiol. Behav. 199, 314 321.
55. Jönsson T, Granfeldt Y, Lindeberg S, et al. (2013) Subjective satiety and other experiences of a Paleolithic diet compared to a diabetes diet in patients with type 2 diabetes. Nutr. J. 12, 105. 56. Halford J, Boyland E, Cooper S, et al. (2010) The effects of sibutramine on the microstructure of
eating behaviour and energy expenditure in obese women. J. Psychopharmacol. (Oxf.) 24, 99 109. ht tp s://w w w .camb rid ge.or g/cor e . IP ad dr ess: 94 .1 3.1 01 .2 26 , on 2 1 Ju l 2 02 0 at 0 8:3 7:0 2, su bject to th e Camb rid ge Cor e ter ms of u se, av ai lab le at ht tp s://w w w .camb rid ge.or g/cor e/t er ms . ht tp s://d oi .or g/1 0.1 01 7/S 00 07 11 45 20 00 24 57
57. Caudwell P, Gibbons C, Hopkins M, et al. (2013) No sex difference in body fat in response to supervised and measured exercise. Med Sci Sports Exerc 45, 351 8.
58. Buckland NJ, Camidge D, Croden F, et al. (2019) Women with a low-satiety phenotype show impaired appetite control and greater resistance to weight loss. Br. J. Nutr. 122, 951 959. 59. Beaulieu K, Casanova N, Oustric P, et al. (2020) Matched Weight Loss Through Intermittent or
Continuous Energy Restriction Does Not Lead To Compensatory Increases in Appetite and Eating Behavior in a Randomized Controlled Trial in Women with Overweight and Obesity. J.
Nutr. 150, 623 633.
60. Drapeau V, Hetherington M & Tremblay A (2011) Impact of Eating and Lifestyle Behaviors on Body Weight: Beyond Energy Value. In Handb. Behav. Food Nutr., pp. 693 706 [Preedy VR, Watson RR, Martin CR, editors]. New York, NY: Springer New York.
61. Beaulieu K, Hopkins M, Blundell J, et al. (2016) Does Habitual Physical Activity Increase the Sensitivity of the Appetite Control System? A Systematic Review. Sports Med. Auckl. NZ 46, 1897 1919.
62. Beaulieu K, Hopkins M, Long C, et al. (2017) High Habitual Physical Activity Improves Acute Energy Compensation in Nonobese Adults: Med. Sci. Sports Exerc. 49, 2268 2275.
63. Beaulieu K, Hopkins M, Blundell J, et al. (2018) Homeostatic and non-homeostatic appetite control along the spectrum of physical activity levels: An updated perspective. Physiol. Behav. 192, 23 29.
64. Fillon A, Masurier J, Pereira B, et al. (in press) Usefulness of Satiety Quotient in a clinical pediatric obesity context. .
ht tp s://w w w .camb rid ge.or g/cor e . IP ad dr ess: 94 .1 3.1 01 .2 26 , on 2 1 Ju l 2 02 0 at 0 8:3 7:0 2, su bject to th e Camb rid ge Cor e ter ms of u se, av ai lab le at ht tp s://w w w .camb rid ge.or g/cor e/t er ms . ht tp s://d oi .or g/1 0.1 01 7/S 00 07 11 45 20 00 24 57
Ac ce pt ed manusc ript F igu re L eg en d s F ig u re 1 : F low c ha rt ... ... . E rr or ! Book m ar k n ot d ef in ed .
Table 1: Database search strategy details Mp = title, abstr act, head ing word , drug trade nam e, origi nal title, device manufacturer, drug manufacturer, device trade name, keyword, floating subheading word, candidate term word
Data Base Equation Filters
Pubmed
((((((((("Satiation"[Majr]) OR "Satiety Response"[Majr]) OR "Appetite"[Majr:NoExp]) OR "Hunger"[Majr:NoExp]) AND Humans[Mesh])) OR (((satiety[Title/Abstract] OR satiation*[Title/Abstract] OR appetite[Title/Abstract] OR fullness[Title/Abstract] OR hunger[Title/Abstract] OR "Prospective food consumption"[Title/Abstract] OR "desire to eat"[Title/Abstract] OR "motivation to eat"[Title/Abstract])) AND Humans[Mesh])) AND Humans[Mesh])) AND quotient[Title/Abstract]
Humans
Embase
(*satiety OR *satiety response OR *appetite OR *hunger OR fullness.mp OR "desire to eat".mp OR "Prospective food consumption".mp OR "motivation to eat".mp OR satiety.mp. OR satiation*.mp. OR hunger.mp. OR appetite.mp. AND (quotient.mp.
Humans
Scopus
( TITLE-ABS-KEY ( satiety OR satiation OR appetite OR fullness OR hunger OR "Prospective food consumption" OR "desire to eat" OR "motivation to eat" ) AND TITLE-ABS-KEY ( quotient ) )
Humans
Web of Science
((Satiety OR satiation OR appetite OR fullness OR hunger OR "Prospective food consumption" OR "desire to eat" OR "motivation to eat") AND (quotient))
Humans
CAB Abstract
Core Collection
((Satiety OR satiation OR appetite OR fullness OR hunger OR "Prospective food consumption" OR "desire to eat" OR "motivation to eat") OR ("hunger" OR "satiety" OR "appetite")) AND (Quotient)
Humans Google Scholar « Satiety Quotient » 01 7/S 00 07 11 45 20 00 24 57 ht tp s://w w w .camb rid ge.or g/cor e . IP ad dr ess: 94 .1 3.1 01 .2 26 , on 2 1 Ju l 2 02 0 at 0 8:3 7:0 2, su bject to th e Camb rid ge Cor e ter ms of u se, av ai lab le at ht tp s://w w w .camb rid ge.or g/cor e/t er ms .
Table 2: Risk of bias Study Random Sequence Generation (Selection bias) Allocation concealment (Selection bias) Blinding participants and personnel (Performance bias) Blinding of outcome assessment (Detection bias) Incomplete outcome data (Attrition bias) Selective reporting (Reporting bias) Albert et al., 2015 (38) L NR L M L L Arguin et al., 2012 (40) H NR NR M NR L Arguin et al., 2017 (12) L NR NR M M L Au-Yeung et al., 2018 (30) L NR NR M NR L Beaulieu et al., 2017 (25) L NR NR M H L Beaulieu et al., 2020 (59) L NR M M M L Bédard et al., 2015 (49) H NR NR M L L Blanchet et al., 2011 (28) L NR L L NR L Bligh et al., 2015 (21) L NR L M H L Buckland et al., 2019 (58) L L NR M L L Carbonneau et al., 2015 (52) L NR NR M NR L Caudwell et al., 2013 (57) H NR NR M L NR Chapman et al., 2005 (26) L L L M L NR Chaput et al., 2007 (47) H NR NR M L L Dalton et al., 2015 (14) L NR NR M NR L Defries et al., 2017 (22) L NR NR H NR L Drapeau et al., 2005 (8) H NR L M NR L 01 7/S 00 07 11 45 20 00 24 57 ht tp s://w w w .camb rid ge.or g/cor e . IP ad dr ess: 94 .1 3.1 01 .2 26 , on 2 1 Ju l 2 02 0 at 0 8:3 7:0 2, su bject to th e Camb rid ge Cor e ter ms of u se, av ai lab le at ht tp s://w w w .camb rid ge.or g/cor e/t er ms .
Drapeau et al., 2007 H NR M M L L Drapeau et al., 2013 (13) H NR NR L H NR Drapeau et al., 2019 (53) H NR NR M H L Dubé et al., 2013 (7) L NR NR M NR L Felix et al., 2013 (32) L NR NR M NR NR Felix et al., 2016 (36) L NR NR M NR NR Fillon et al., 2020 (39) L NR NR M L L Finlayson et al., 2011 (35) L NR M M M L Gilbert et al., 2009 (48) H NR M M L L Golloso-Gubat et al., 2016 (46) L NR NR M L NR Gonzalez et al., 2017 (33) M NR NR M NR NR Green et al., 1997 (6) H NR NR M NR NR Halford et al., 2010 (56) M L L M M L Hansen et al., 2018 (18) L NR M M NR L Harrington et al., 2013 (43) H NR NR M L NR Hintze et al., 2019 (54) L NR NR M H L Hollingworth et al., 2018 (15) L NR NR NR NR NR Hopkins et al., 2016 (19) L NR NR M NR NR Jönsson et al., 2010 (44) L NR NR H H NR Jönsson et al., 2013 (55) L NR NR H L L Kral et al., 2020 (41) L L M L L L Kendall et al., 2010 (34) L L L M M NR King et al., 2009 (50) H NR NR M L NR 01 7/S 00 07 11 45 20 00 24 57 ht tp s://w w w .camb rid ge.or g/cor e . IP ad dr ess: 94 .1 3.1 01 .2 26 , on 2 1 Ju l 2 02 0 at 0 8:3 7:0 2, su bject to th e Camb rid ge Cor e ter ms of u se, av ai lab le at ht tp s://w w w .camb rid ge.or g/cor e/t er ms .