HAL Id: cea-02435106
https://hal-cea.archives-ouvertes.fr/cea-02435106
Submitted on 10 Jan 2020
HAL is a multi-disciplinary open access
archive for the deposit and dissemination of
sci-entific research documents, whether they are
pub-lished or not. The documents may come from
teaching and research institutions in France or
abroad, or from public or private research centers.
L’archive ouverte pluridisciplinaire HAL, est
destinée au dépôt et à la diffusion de documents
scientifiques de niveau recherche, publiés ou non,
émanant des établissements d’enseignement et de
recherche français ou étrangers, des laboratoires
publics ou privés.
energy domain for ZEPHYR, a future multipurpose
ZPR for CEA
P. Ros, P. Blaise, P. Leconte
To cite this version:
P. Ros, P. Blaise, P. Leconte. Spectral adaptation to emphasize the 10 eV to 10 keV energy domain
for ZEPHYR, a future multipurpose ZPR for CEA. ICAPP 2017, Apr 2017, Fukui and Kyoto, Japan.
�cea-02435106�
Spectral adaptation to emphasize the 10 eV to 10 keV energy domain for ZEPHYR, a future multipurpose ZPR for CEA
Paul Ros a,b, Patrick Blaise a, Pierre Leconte b
a CEA, DEN, DER, SPEx, Experimental Programs Laboratory, Cadarache, Saint-Paul-Lez-Durance, F-13108, France b CEA, DEN, DER, SPRC, Physics Studies Laboratory, Cadarache, Saint-Paul-Lez-Durance, F-13108, France
Zero Power Reactors bring significant results in experimental validation of neutronics calculation tools and knowledge of nuclear data through integral experiments. In order to preserve such experimental capabilities after the closure of both MINERVE and EOLE French ZPRs at the end of 2017, the CEA has decided to go into the design of a new multipurpose facility called ZEPHYR (Zero power Experimental PHYsics Reactor). ZEPHYR should compile the capacities of the two actual mock ups and improve them in several ways. Then, spectral flexibility is one of the most important parameters in order to cover the whole range of needs in terms of experiments. For instance, fast-thermal coupled cores have been recently revisited to perform fast experiments thanks to a thermal driver spectrum.
In this paper, another kind of spectral adaptation is presented. It aims at increase the effects of the 10 eV to 10 keV energy range, called epi-thermal zone. This energy zone is particularly crucial for safety/criticality applications. Indeed, the manufacturing of current MOx and future FBR fuels involves wet MOx powders, which are particularly sensitive to such energies. A better knowledge of plutonium isotopes cross sections in this energy range would improve the safety, and hence the profitability of the whole manufacturing process.
Following the principles of fast-thermal coupled cores regarding the design of the adaptation zone, epi-thermal neutronics characteristics can be obtained in the center of an experimental core. Calculations are made with the ERANOS deterministic code, and validated thanks to the TRIPOLI-4 Monte-Carlo code. The performances of such configurations are evaluated in connection with standard oscillation and activation experimental techniques.
The paper deals with a complete description of the core design as well as its spectral characteristics.
I. INTRODUCTION
Zero power reactors have enabled experiments in a wide range of neutron spectra in order to cover the needs of nuclear industry, for both operation of reactors and the cycle. For instance, thermal spectra for UOx and MOx fuels, surthermal and fast spectra have been realized in the French MINERVE ZPR [Ref 1] for improving ND using small sample oscillation technique.
In this paper, another kind of spectral adaptation is presented in order to emphasize the reactivity effects in the 10 eV to 10 keV energy range, called the epi-thermal zone here after. The first section presents the numerical methods used to calculate the configurations and the
indicators to evaluate the pertinence of such
configurations in terms of practical future measurements are also detailed. The “optimal” configuration designed thanks to simple physics considerations is presented in the second part as well as the forward and adjoint fluxes obtained in the core center. The third part analyzes the neutronics characteristics through the indicators previously detailed to demonstrate that the epi-thermal energy range predominates. Finally, perspectives related to the application on wet MOx powders and MOx fuels in Light Water Reactors (LWRs) are presented.
II. METHODOLOGY
This section describes the methods used. On the one hand, calculation tools are described in order to obtain a pertinent configuration. On the other hand, several indicators based on experimental techniques are presented to evaluate the performances in the center of the core.
II.A. Calculation tools
The calculations are performed following two steps: firstly, parametric studies to determine optimal materials and the associated dimensions, and then, a validation of the geometry thanks to Monte-Carlo calculation.
Simplified calculations are performed using the fast-lattice deterministic ECCO/ERANOS system of codes [Ref 2]. Cell calculations are based on subgroups and
probability table methods for self-shielding with a 1968 groups energy mesh. Core calculations are performed in (R-Z) geometry using the BISTRO transport code in S4
-P1 and 33 energy-groups.
Monte-Carlo calculations are realized with TRIPOLI-4 [Ref 3]. The 3D-geometry descriptions and the continuous energy and angle cross-sections lead to a validation of the configuration. More precise spectral characteristics are also available with such calculations. Moreover, adjoint calculations and small reactivity effects are now available in a development version of TRIPOLI-4 since the IFP technique has been implemented [Ref 4].
II.B. Performance indicators
Obviously, the energy profile of the forward flux is the first indicator to perform measurement in the epi-thermal energy range. Nonetheless, the experimental techniques are based on linear and bilinear integrals:
- Reaction rates: in activation experiments,
reaction rates stand as the key element. With ∑ the macroscopic cross-section of the targeted reaction, reaction rates are based on linear integrals:
∫
Σ Φ( )
=∫
Φ( )
E
E (E) E dE N
σ
(E) EdE- Reactivity effects: in oscillation experiments, a
material induces a perturbation of the reactivity Δρ. Thanks to the standard perturbation theory :
( )
PERT REF PERT REF P H Φ Φ Φ ∆ Φ = ∆ + + ; ; ρThe integration is performed on the whole phase space (entire core, energy and geometry). REF refers to the unperturbed core (without sample) whereas PERT refers to the perturbed core with the inserted sample.
In MINERVE, an automatic pilot rod instantaneously compensates the reactivity effect in order to keep the core in its critical state. The measurement of the reactivity effect comes from the shifting of the pilot rod.
Such reactivity effects are calculated with ERANOS thanks to the dedicated procedure called ‘EXACT_SPT’ [Ref 5]. It can also be calculated with TRIPOLI thanks to the IFP technique [Ref 4].
For both reaction rates and reactivity effects, the following ratios give the proportion of reactions and reactivity effects in the epi-thermal energy range:
( ) ( ) ( )
( ) ( ) ( )
E E EdE dE E E E MeV eV keV eV Φ Σ Φ Φ Σ Φ∫
∫
+ + 20 0 10 10 and( )
( )
Tot keV eV ρ ρ ∆ ∆ 10 −10The isotopes and the reactions are chosen to evaluate the contributions of several energy domains:
- Fission of 239Pu and 235U to get a sensibility over
the entire energy domain.
- Absorption of 103Rh for the thermal energy range
is evaluated through the through 1eV resonance. - Capture of 238U is used to evaluate the sensitivity
between 1 eV and 10 eV.
- Absorption of 56Fe is used for the epithermal
range.
Moreover, those reactions and isotopes stand as important element in the Nuclear Data improvement strategy because they are part of main fissile isotopes, structure materials and fission products.
III. PRESENTATION OF THE EPI-THERMAL CONFIGURATION
This section is dedicated to the conception of the configuration, from parametric studies to Monte-Carlo validation. As ZEPHYR will be a multipurpose facility, a thermal driver zone is necessary to safely operate the core. Then, the epi-thermal configuration presented here is based on such a zone with a LWR-like spectrum.
III.A. Principles of conception
Fast-thermal coupled cores have been recently revisited [Ref 6]. The optimization of the adaptation zone relies on a spectral conversion from the peripheral thermal zone to the fast center zone thanks to fissions on enriched fuels. Following this option to minimize the loss of neutrons, a similar adaptation zone is proposed, made by three layers:
1. A conversion zone in high enriched metallic uranium in order to transform the main part of thermal neutrons in fission neutrons.
2. The majority of neutrons is slowed-down from a fission-like spectrum to the epi-thermal energy range thanks to elastic and inelastic scattering material. Several options have been studied (light and heavy waters, graphite, steel) and heavy water D2O appears to be the best candidate.
Indeed, light water has a too important slowing-down power, and a non negligible capture cross-section whereas graphite and steel do not get sufficient slowing-down powers.
3. A combination of thermal absorbers is used to cancel the influence of the neutrons whose energy is below 10 eV. Indeed, due to the energy
profiles of cross sections, such neutrons have a strong impact on reaction rates and reactivity effects even though the flux is weak at such energies. Then, as the main goal is to emphasize the 10 eV - 10 keV, the influence of thermal neutrons has to be cut off. A combination of "linear" absorber (boron nitride) and "threshold" absorber (Gadolinium) is used in the vicinity of the central oscillation channel.
III.B. Presentation of the configuration
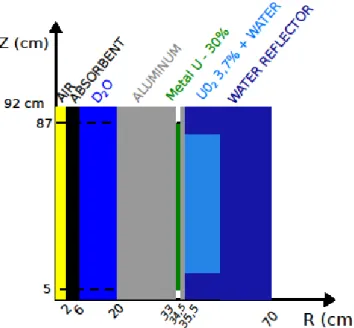
The principles described in part III.A. led to the following configuration, illustrated in Fig 1. as it is simulated in the deterministic code ERANOS :
Fig. 1. Illustration of the epi-thermal configuration.
The radius of 35.5 cm for the central zone is taken from the characteristics of the MINERVE reactor. An entire D2O central zone would lead to an excessive
slowing-down, and then it is coupled to a large aluminum ring. For the second step, validation by TRIPOLI-4, the 3D detailed geometry of the core is described. It is represented in the two following illustrations (Fig. 2 and 3). The legend used for both illustrations is the following:
- Light blue : light water; - Navy blue : heavy water; - Green : 3.7% enriched UO2;
- Red : 30% enriched metal uranium; - Grey : aluminium;
- Black : boron nitride;
- Yellow : « Void » for the measurement zone (oscillation and activation)
Fig. 2. TRIPOLI-4 modelisation in plane X-Y of the epi-thermal configuration
Fig. 3. TRIPOLI-4 modelisation in plane X-Z of the epi-thermal configuration
III.C. Spectral characterization
III.C.1. ERANOS forward flux
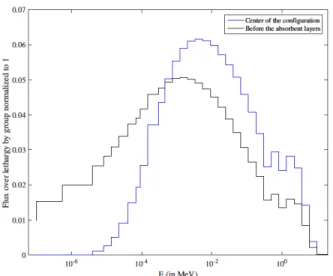
The following figure (Fig.4) illustrates the forward flux in the center and before the absorbent layers.
This figure confirms the emphasis on the targeted energy zone. Moreover, it illustrates the influence of the absorbent layer to cut the residual thermal neutrons. In the next paragraph, this shape is validated thanks to a TRIPOLI-4 calculation.
Fig. 4. ERANOS normalized forward fluxes – core center
III.C.2. TRIPOLI-4 forward flux
The forward flux obtained in the center cell (r=2cm; H=20cm) is illustrated in Fig.5 :
Fig. 5. TRIPOLI -4 normalized forward flux – center cell
The forward flux shape is then confirmed. In this configuration, the absolute flux value at 1W is:
1.451E+06 neutrons.cm-2.s-1
As a power extension to 3kW is planned for ZEPHYR, the same flux level as in MINERVE and EOLE configurations would be obtained i.e. in the order of 109
n.cm-2.s-1. This result ends the feasibility study of such
configuration.
IV. EXPERIMENTAL INDICATORS: RESULTS
Thanks to the TRIPOLI-4 options, the experimental indicators mentioned in part II.B. are calculated in the central measurement cell.
IV.A. Energy profiles on reaction rates
In this section, the energy profiles of reaction rates are presented.
IV.A.1. Reaction rates on actinides
Fig. 6. Energy profiles of reaction rates on actinides These energy distributions correspond to the following proportion of reaction in large macrogroups (Table 1):
Table 1: Reaction rate on actinides energy repartition REACTION 10 eV - 1 keV 1 keV – 10 keV 10 eV – 10 keV Fission 239Pu 69.3 % 16.5 % 85.8 % Fission 235U 62.8 % 23.0 % 85.8 % Capture 238U 75.4 % 11.7 % 87.1 %
Therefore, for reactions sensitive to the whole energies such as fission of 239Pu, the reaction rates are mainly due
IV.A.2. Absorption rates on 103Rh and 56Fe
In Fig.7, the axial axis is zoomed because the 1 keV resonance of 56Fe implies a huge absorption rate.
Fig. 7. Energy profiles of reaction rates on 103Rh and 56Fe
Then, the energy proportion of reaction rates in large macrogroups is presented in the following Table 2:
Table 2: Energy repartition absorption rate 103Rh & 56Fe
REACTION 10 eV – 1 keV 1 keV – 10 keV 10 eV – 10 keV Absorption 103Rh 59.8 % 27.5 % 87.3 % Absorption 56Fe 18.4 % 69.2 % 87.6 %
Even for the thermal resonant isotope 103Rh, the 1 eV
resonance is no longer observed and the absorption rates are largely due to the 10 eV – 10 keV energy domain.
IV.B. Adjoint weighted energy profiles of reaction rates
As detailed by the standard perturbation theory in paragraph 2, the adjoint flux is also an important element to evaluate reactivity effects. After a description of the energy profile of the adjoint flux, adjoint weighted reaction rates are presented to evaluate energy profiles of reactivity effects.
IV.B.1. Adjoint flux energy profile
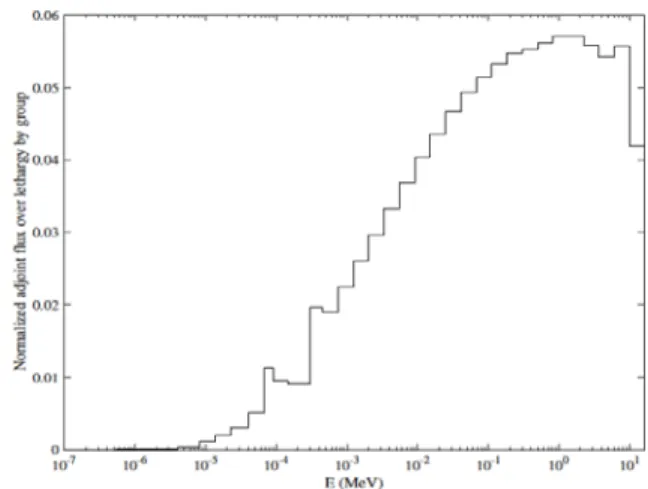
Here below is presented the ERANOS 33G adjoint flux (Fig. 8):
Fig. 8. Adjoint flux in the center – ERANOS calculation
As depicted, the adjoint profile exhibits a steep behavior. The slope is due to two main factors:
- thermal absorbent that quasi vanish the
importance of neutrons below 10 eV;
- distance from the center to fissile materials that induces an increasing slope with energy, related to scattering materials.
IV.B.2. Adjoint weighted energy profiles of reaction rates
Using the ERANOS adjoint flux and the reaction rates calculated thanks to TRIPOLI, the ratios
( ) ( ) ( )
( ) ( ) ( )
E E E dE dE E E E MeV eV keV eV Φ Σ Φ Φ Σ Φ∫
∫
+ + 20 0 10 10 can be calculated.For the three reactions on actinides previously used, the following energy profiles are obtained (Fig. 9):
Fig. 9. Adjoint weighted reaction rates on actinides
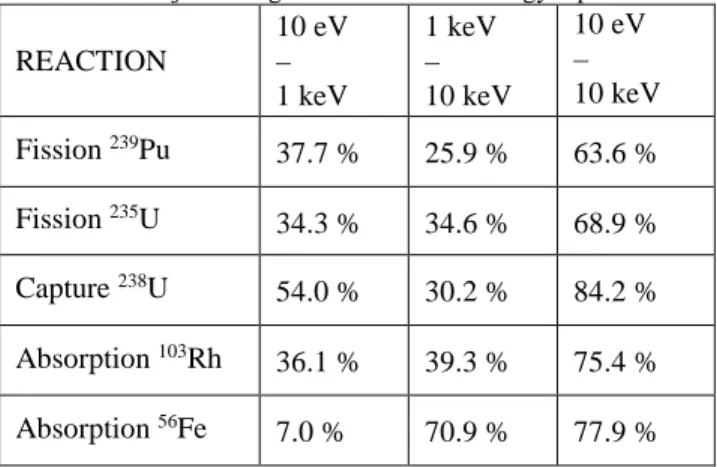
Such energy distributions correspond to the following proportion of adjoint weighted reaction rates in large macrogroups (Table 3):
Table 3: Adjoint weighted reaction rate energy repartition
REACTION 10 eV – 1 keV 1 keV – 10 keV 10 eV – 10 keV Fission 239Pu 37.7 % 25.9 % 63.6 % Fission 235U 34.3 % 34.6 % 68.9 % Capture 238U 54.0 % 30.2 % 84.2 % Absorption 103Rh 36.1 % 39.3 % 75.4 % Absorption 56Fe 7.0 % 70.9 % 77.9 %
Even if the results are the proportions in the 10 eV – 10 keV targeted energy zone, they represent a large majority of the total.
IV.C. Decomposition of exact perturbations on reactivity effect
The standard perturbation theory gives the variation of reactivity between two configurations, referred as REF and PERT using the following expression:
( )
PERT REF PERT REF P H Φ Φ Φ ∆ Φ = ∆ + + ; ; ρIn ERANOS, a dedicated procedure called EXACT_SPT (for Exact Standard Perturbation Theory), gives a decomposition of this reactivity effect on the present isotopes, reactions and on a 33 groups energy division. Table 4 here below, such decomposition is presented for the insertion of a sample of 239Pu.
Table 4: Δρ repartition by isotopes due to a 239Pu sample
Isotope Total contribution to Δρ (in pcm)
235U -3.21E-11 238U -1.52E-11 238Pu 2.96E-10 239Pu 3.31E+00 240Pu 4.43E-11 241Pu -9.94E-10 242Pu 2.35E-12 241Am 2.19E-11 16O 4.99E-05 1H 2.82E-11 2H 4.84E-12 14N 4.55E-04 10B 4.01E-11 27Al 1.90E-12 56Fe 2.76E-12 103Rh 2.07E-12 PART >0 3.61E+00 PART <0 -2.91E-01 Total 3.31E+00
Then, the reactivity effect is largely due to the inserted 239Pu sample, by more than 4 orders of
magnitude. Similar results occur with other samples (different Pu isotopes, U isotopes, 10B, 103Rh). Therefore,
peripheral isotopes do not contribute to the reactivity effects. It implies that the reactivity effect measurements are not sensitive to cross-sections of peripheral isotopes.
As far as the energy repartition is concerned, the following illustration is presented (Fig. 10):
Fig. 10. Δρ energy distribution due to a 239Pu sample (in
pcm)
Similar graphs are presented for 238Pu and 10B
samples (a fertile isotope and a thermal absorber used as a reference calibration sample in MINERVE) in Fig.11 and 12:
Fig. 12. Δρ energy distribution due to a 10B sample (in pcm)
The proportion of reactivity effects that occur in the targeted energy range is presented in the following Table 5:
Table 5: Δρ energy proportions
Isotopes 8.32 eV – 9.12 keV
239Pu sample 76 % 238Pu sample
46.6 %
10B sample 77 %
Such results demonstrate that oscillation experiment would raise the goal to target only the influence of inserted samples mainly in the 10 eV – 10 keV energy zone, except for the fertile isotopes.
Those primary results can be applied to improvement of Nuclear Data for MOx powders fabrication and MOx fuels in LWRs thanks to the shared energy domain sensitivities.
V. POTENTIAL APPLICATIONS
This configuration could bring crucial information to improve knowledge on Nuclear Data in the epi-thermal energy range, and then reduce uncertainties for MOx powders and MOx fuels in LWRs.
V.A. MOx powders
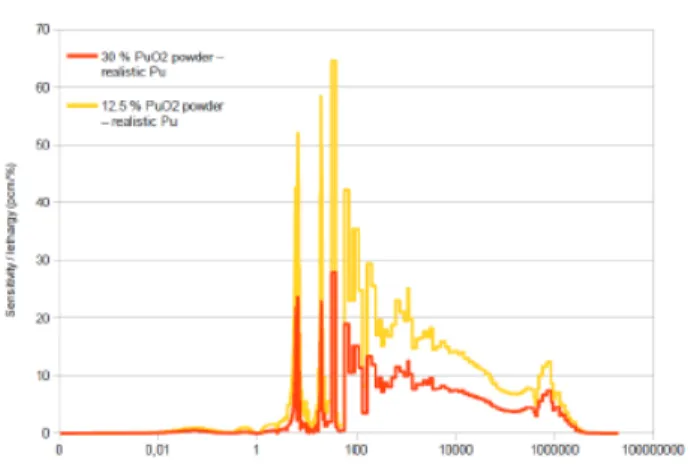
The fabrication of MOx fuels and future GEN-IV FBRs’ fuels are currently constrained by large uncertainties on the multiplication factors (~2000 pcm). Such uncertainties are mainly propagated from the epi-thermal energy range. Here below are presented sensitivity profiles of the multiplication factor to the 239Pu
fission cross-section in some cases from the blind benchmark on wet powders (Ref. 7):
Fig. 13. Sensitivity profile by lethargy by group of keff to 238U capture reaction in PuO2 powders from UACSA Phase V benchmark.
Thanks to the analog sensitivity profiles in the epi-thermal range from oscillations of plutonium samples (see IV), the total uncertainty for MOx powders applications should be significantly reduced.
V.B. MOx fuels in LWRs, improvement from EOLE’s experiment
Even in thermal lattices, the epi-thermal energy range has a strong contribution, especially in MOx cores. In Ref 8, significant sensitivities of the multiplication factor to
the microscopic cross sections of 241Pu in MOx
configurations are presented.
In ZEPHYR, versatility would make possible to perform EOLE-like configurations dedicated to MOx fuels but also coupled core configurations. The configuration presented in this paper is a new type one. Thanks to a central air area, various moderation ratios and harder MOx spectrum would be possible to realize (Ref 9). New experiments of this type will enrich the existing available data for experimental validation of MOx fuels in LWRs.
VI. CONCLUSIONS
An experimental configuration has been designed to emphasize neutronics effects in the 10 eV – 10 keV energy range. This work takes part in the mainframe of ZEPHYR R&D studies, a future experimental critical facility to be built in Cadarache.
It has been demonstrated that more than 70% of reaction rates and reactivity effects (for oscillation experiments) would happen in the epi-thermal range at the center core. Moreover, the use of the exact standard
perturbation theory through a dedicated module in the ERANOS deterministic code showed that more than 99.9% of the reactivity effects are due to the inserted isotope during the oscillation technique. Therefore, this configuration reaches the goals in terms of targeted sensitivity profiles. Those studies are planned to be enriched by a TRIPOLI validation of the reactivity effect decomposition using the newly implemented exact perturbation theory.
As mentioned in subsection V, further work will deal with representativity and transposition studies in order to quantify the possible information that can be brought to Nuclear Data involved in MOx powders and fuels. Then, a multiplication factor uncertainty reduction would be achieved.
ACKNOWLEDGMENTS
The authors would like to thank C. Carmouze, J. Huyghe and R. Eschbach from the Cycle Studies Laboratories at CEA Cadarache, for their collaboration about the application of this study to MOx powders, especially through the international Benchmark Phase-V.
REFERENCES
1. S. CATHALAU et al. “More than forty years of neutronics experiments in critical facilities of Cadarache center: from EOLE and MINERVE to the future ZEPHYR reactor” IGORR conference, Bariloche (2014).
2. G. RIMPAULT et al. “The ERANOS code and data system for fast reactor neutronic analyses” PHYSOR
Conference, Seoul, Korea (2002).
3. E. BRUN et al. “TRIPOLI-4®, CEA, EDF and AREVA reference Monte Carlo code” Annals of
Nuclear Energy, N°82, pp.151-160 (2015)
4. G. TRUCHET et al., “Continuous-Energy Adjoint Flux and Perturbation Calculation using the Iterated Fission Probability Method in Monte Carlo Code TRIPOLI-4 and Underlying Applications” SNA +
MC 2013, 03504 (2014).
5. J.M. RUGGIERI et al., “ERANOS 2.1 : International Code system for GEN IV Fast reactor analysis” ICAPP, Reno, NV USA (2006).
6. P. ROS et al., “Fast-thermal coupled cores in ZPR revisited, physical specificities and potentialities for ZEPHYR” PHYSOR Conference, Idaho, USA (2016).
7. A. SANTAMARINA, “Benchmark Phase-V. Blind benchmark on MOx wet powders” Working party on Nuclear Criticality Safety, NEA (2015).
8. T. YAMAMOTO et al., “Neutronics analysis of full MOX BWR core simulation experiments FUBILA”
Journal of Nuclear Science and Technology, Vol. 48,
No. 3, pp. 398 – 420 (2011).
9. P. BLAISE et al., “Experimental R&D innovation for GEN II, III & IV neutronics studies in ZPRs: a path to the future ZEPHYR facility in Cadarache” IGORR Conference, Berlin (2016).