HAL Id: halsde-00324005
https://hal.archives-ouvertes.fr/halsde-00324005
Submitted on 26 May 2021
HAL is a multi-disciplinary open access
archive for the deposit and dissemination of
sci-entific research documents, whether they are
pub-lished or not. The documents may come from
teaching and research institutions in France or
abroad, or from public or private research centers.
L’archive ouverte pluridisciplinaire HAL, est
destinée au dépôt et à la diffusion de documents
scientifiques de niveau recherche, publiés ou non,
émanant des établissements d’enseignement et de
recherche français ou étrangers, des laboratoires
publics ou privés.
mitochondrial DNA phylogenies
Thomas Galewski, Marie-Ka Tilak, Sophie Sanchez, Pascale Chevret,
Emmanuel Paradis, Emmanuel Douzery
To cite this version:
Thomas Galewski, Marie-Ka Tilak, Sophie Sanchez, Pascale Chevret, Emmanuel Paradis, et al.. The
evolutionary radiation of Arvicolinae rodents (voles and lemmings): relative contribution of nuclear
and mitochondrial DNA phylogenies. BMC Evolutionary Biology, BioMed Central, 2006, 6, pp.80.
�10.1186/1471-2148-6-80�. �halsde-00324005�
Open Access
Research article
The evolutionary radiation of Arvicolinae rodents (voles and
lemmings): relative contribution of nuclear and mitochondrial DNA
phylogenies
Thomas Galewski*
1, Marie-ka Tilak
1, Sophie Sanchez
2, Pascale Chevret
1,
Emmanuel Paradis
1,3and Emmanuel JP Douzery
1Address: 1Laboratoire de Paléontologie, Phylogénie et Paléobiologie – CC064, Institut des Sciences de l'Evolution UMR 5554/CNRS, Université
Montpellier II; Place E. Bataillon, 34 095 Montpellier Cedex 05 –, France, 2Ecophysiologie : évolution et adaptation moléculaires, Station
Biologique, Place Georges Teissier – BP 7429 680 Roscoff –, France and 3Institut de Recherche pour le Développement, UR175 CAVIAR, GAMET
– BP 5095, 361 rue Jean François Breton, 34196 Montpellier Cedex 5 –, France
Email: Thomas Galewski* - galewski@isem.univ-montp2.fr; Marie-ka Tilak - marika@isem.univ-montp2.fr; Sophie Sanchez - sanchez@sb-roscoff.fr; Pascale Chevret - chevret@isem.univ-montp2.fr; Emmanuel Paradis - Emmanuel.Paradis@mpl.ird.fr;
Emmanuel JP Douzery - douzery@isem.univ-montp2.fr * Corresponding author
Abstract
Background: Mitochondrial and nuclear genes have generally been employed for different purposes in molecular
systematics, the former to resolve relationships within recently evolved groups and the latter to investigate phylogenies at a deeper level. In the case of rapid and recent evolutionary radiations, mitochondrial genes like cytochrome b (CYB) are often inefficient for resolving phylogenetic relationships. One of the best examples is illustrated by Arvicolinae rodents (Rodentia; Muridae), the most impressive mammalian radiation of the Northern Hemisphere which produced voles, lemmings and muskrats. Here, we compare the relative contribution of a nuclear marker – the exon 10 of the growth hormone receptor (GHR) gene – to the one of the mitochondrial CYB for inferring phylogenetic relationships among the major lineages of arvicoline rodents.
Results: The analysis of GHR sequences improves the overall resolution of the Arvicolinae phylogeny. Our results show
that the Caucasian long-clawed vole (Prometheomys schaposnikowi) is one of the basalmost arvicolines, and confirm that true lemmings (Lemmus) and collared lemmings (Dicrostonyx) are not closely related as suggested by morphology. Red-backed voles (Myodini) are found as the sister-group of a clade encompassing water vole (Arvicola), snow vole (Chionomys), and meadow voles (Microtus and allies). Within the latter, no support is recovered for the generic recognition of Blanfordimys, Lasiopodomys, Neodon, and Phaiomys as suggested by morphology. Comparisons of parameter estimates for branch lengths, base composition, among sites rate heterogeneity, and GTR relative substitution rates indicate that CYB sequences consistently exhibit more heterogeneity among codon positions than GHR. By analyzing the contribution of each codon position to node resolution, we show that the apparent higher efficiency of GHR is due to their third positions. Although we focus on speciation events spanning the last 10 million years (Myr), CYB sequences display highly saturated codon positions contrary to the nuclear exon. Lastly, variable length bootstrap predicts a significant increase in resolution of arvicoline phylogeny through the sequencing of nuclear data in an order of magnitude three to five times greater than the size of GHR exon 10.
Conclusion: Our survey provides a first resolved gene tree for Arvicolinae. The comparison of CYB and GHR
phylogenetic efficiency supports recent assertions that nuclear genes are useful for resolving relationships of recently evolved animals. The superiority of nuclear exons may reside both in (i) less heterogeneity among sites, and (ii) the
Published: 09 October 2006
BMC Evolutionary Biology 2006, 6:80 doi:10.1186/1471-2148-6-80
Received: 19 May 2006 Accepted: 09 October 2006 This article is available from: http://www.biomedcentral.com/1471-2148/6/80
© 2006 Galewski et al; licensee BioMed Central Ltd.
This is an Open Access article distributed under the terms of the Creative Commons Attribution License (http://creativecommons.org/licenses/by/2.0), which permits unrestricted use, distribution, and reproduction in any medium, provided the original work is properly cited.
presence of highly informative sites in third codon positions, that evolve rapidly enough to accumulate synapomorphies, but slow enough to avoid substitutional saturation.
Background
During the last decade, molecular phylogenetics based on the comparative analysis of markers from mitochondrial and nuclear genomes allowed for the revision of mamma-lian systematics [1,2]. Sequencing efforts initially focused on mitochondrial DNA (mtDNA) due to the availability of conserved primers, the presence of rapidly evolving sites, and a reduced effective population size inducing the rapid fixation of variants between subsequent speciation events. Some protein-coding genes such as cytochrome b [CYB] have emerged as central tools in investigating intraspecific [e.g. [3-6]] to ordinal-level [e.g. [7-9,6]] evo-lutionary relationships. To date (January 2006), ca. 5,000 complete CYB entries are available for mammals in public data bases, and furthermore, another mitochondrial gene – the cytochrome c oxidase I – has been proposed as the marker for animal DNA barcoding [10]. However, the strong nucleotide saturation encountered at third codon positions as well as a high sensitivity to taxon sampling soon caused the questioning of the utility of mitochon-drial protein-coding genes in general, and CYB in particu-lar for resolving deep phylogenies [11,12]. Owing to their different evolutionary patterns – a less biased base com-position and lower saturation than mitochondrial genes [13,14] – nuclear genes have represented a reasonable alternative to mtDNA for reconstructing deep-level mam-malian phylogenies [[15-21]; but see [22]]. By providing complementary information, mitochondrial and nuclear genes are thus generally employed at different levels, low-level phylogeny and taxonomy for the former, and deeper-level for the latter.
Several mtDNA-based studies of mammalian systematics have shed light on the difficulties experienced in using CYB to resolve phylogenies at lower taxonomic levels. Several works at the family level recovered multifurcations among genera or even species, which led to the conclu-sion of rapid, near-simultaneous divergences of multiple lineages (= star-phylogeny), without any time left for synapomorphies to accumulate in mtDNA. This interpre-tation has been put forward for some speciose clades of rodents, such as Ctenomyidae [23], Echimyidae [24], or Sigmodontinae [25]. The star-phylogeny hypothesis was also supported by the lack of resolution for relationships among genera, contrasting with well-defined nodes above and below multifurcations [23,24,26]. However, an alter-native hypothesis suggests that CYB sequences have undergone substitution saturation throughout the course of speciation events, leading to a loss of the original phy-logenetic signal, and producing a soft-polytomy [27]. In
this case, the use of slower-evolving nuclear DNA (nuDNA) might represent a better choice for resolving such recent radiations. Supporting this hypothesis, sequences from such markers, either exons or introns, have recently improved among-families [28-30], or even among-genera [31,32] phylogenetics of spiny rats, squir-rels, whales, weasels, and spiral-horn antelopes.
In the present study, we focused on the evolutionary his-tory of voles, lemmings, and muskrats. These animals belong to the Arvicolinae, one of the six Cricetidae sub-families of the highly-diverse Muroidea, which encom-passes one third of all rodent species. The Arvicolinae represent themselves one of the most impressive placental radiations in the Northern Hemisphere, consisting of 151 species and 28 genera [33]. As stated by [33], the explo-siveness and recency of arvicoline evolution can be dra-matically highlighted by the more than 60 species of
Microtus and the inconsistency of their systematic
treat-ment. Phylogenetic reconstructions based on mitochon-drial sequences (CYB and NADH-dehydrogenase 4 [ND4]) provided unresolved topologies at two different levels: (1) among arvicoline genera, and (2) among spe-cies of Microtus [34-36]. These results reinforced observa-tions previously made by paleontologists [37,38] who concluded that two successive pulses of speciation occurred during the evolutionary course of arvicoline rodents over the last 10 million years (Myr).
Following the encouraging results from recent studies [28-32], we thus compared the relative contribution of a nuclear marker – exon 10 of the growth hormone receptor (GHR) gene – to one of the mitochondrial CYB for infer-ring phylogenetic relationships among major Arvicolinae lineages. We performed analyses in a probability frame-work because (i) maximum likelihood (ML) and Bayesian methods are indeed based upon explicit models of sequence evolution, (ii) they allow the definition of inde-pendent models to reflect the contrasting substitution pat-terns among the three codon positions of GHR and CYB, and (iii) they have proven to be robust to a number of sys-tematic biases during phylogenetic reconstruction [39-41]. In addition to such inter-sites comparisons, we eval-uated the amount of saturation at each codon position. Using the variable-length bootstrap method, we also esti-mated the amount of sites required by mitochondrial, CYB-like, and nuclear, GHR-like data to resolve recent and deeper nodes of the evolution of voles and lemmings.
Results and discussion
1. Mitochondrial and nuclear phylogenies of the Arvicolinae
(i) Contribution of CYB
Both Bayesian and ML DNA analyses provide poorly resolved phylogenies, with most of arvicoline genera and most of Microtus species arising from a polytomy (Figure 1A). Only three nodes benefit from strong support (BPML > 70 and PP > 0.95), four are moderately supported (BPML > 50 or PP > 0.95), whereas the 18 remaining nodes do not receive significant support. The three clades unambig-uously identified (Figure 1A) involve: (i) both Myodes spe-cies included in our analysis: M. glareolus and M.
andersoni; (ii) Neodon irene + Phaiomys leucurus; and (iii) Microtus (Microtus) arvalis + M. (Microtus) guentheri. At the
amino acids level, only 12 % of the CYB sites are parsi-mony informative among arvicolines, and, as already observed by [34], the corresponding topology is not resolved (a single node is supported by BPML > 70).
(ii) Contribution of GHR exon 10
Branching patterns recovered with ML and Bayesian methods are identical. GHR sequences provide much more resolved topologies (Figure 1B) than those based upon CYB sequences, with eight strongly and four moder-ately supported nodes. All clades previously identified in the CYB tree are recovered with higher support, excepted for the sister-clade relationship between Microtus arvalis and M. guentheri not found in GHR trees. A better resolu-tion involves all taxonomic levels from internal suprage-neric relationships to intra-Microtus nodes (Figure 1B). New, well-supported clades include: (i) the monophyly of the subgenus Alexandromys (Microtus kikuchii, M.
oeconomus, and M. middendorffi); (ii) the monophyly of a Microtus sensu lato clade (Neodon, Phaiomys, Blanfordimys, Lasiopodomys, and Microtus) but excluding Chionomys; (iii)
the grouping of Arvicola + Chionomys + Microtus s.l.; (iv) the association of Eothenomys with Myodes (= Myodini); and (v) a sister-clade relationship between Myodini and Arvicolini. At the amino acids level, 16 % of the GHR sites are parsimony informative among arvicolines, and the
Maximum posterior probability trees reconstructed from the mitochondrial CYB (left, A) and nuclear GHR (right, B) sequences
Figure 1
Maximum posterior probability trees reconstructed from the mitochondrial CYB (left, A) and nuclear GHR (right, B) sequences. Two reliability indices are given on nodes: the Bayesian posterior probabilities/the maximum likelihood
bootstrap percentages. Note the difference of scale (expressed as substitutions per sites [s.p.s.]).
Lasiopodomys mandarinus 0.1 s.p.s. Meriones Rattus Mesocricetus Phyllotis Phenacomys intermedius Lemmus sibiricus Dicrostonyx torquatus Arvicola terrestris Ondatra zibethicus Eothenomys melanogaster Myodes glareolus Myodes andersoni Prometheomys schaposnikovi Chionomys nivalis Neodon irene Phaiomys leucurus M. duodecimcostatus M. arvalis M. guentheri M. kikuchii M. oeconomus M. middendorffi Blanfordimys bucharicus M. ochrogaster M. chrotorrhinus M. richardsoni M. pennsylvanicus M. longicaudus 1.00 / 70 0.91 / 16 0.98 / 93 0.74 / 74 0.52 / 6 0.93 / 50 0.51 / 17 1.00 / 43 1.00 / 92 0.59 / 21 0.99 / 79 0.99 / 23 0.68 / 20 0.68 / 25 0.62 / 14 0.50 / 12 0.70 / 19 0.72 / 41 A CYB TREE B GHR TREE 0.01 s.p.s. Meriones Rattus Mesocricetus Phyllotis Prometheomys schaposnikovi Phenacomys intermedius Dicrostonyx torquatus 0.89 / 43 Ondatra zibethicus Lemmus sibiricus Eothenomys melanogaster Myodes glareolus Myodes andersoni 1.00 / 97 1.00 / 92 Chionomys nivalis Arvicola terrestris Neodon irene Phaiomys leucurus 1.00 / 93 M. arvalis M. duodecimcostatus 0.82 / 27 M. guentheri Blanfordimys bucharicus Lasiopodomys mandarinus 0.58 / 50 0.66 / 6 M. middendorffi M. kikuchii M. oeconomus 0.89 / 68 1.00 / 92 M. richardsoni M. pennsylvanicus M. longicaudus M. chrotorrhinus M. ochrogaster 0.56 / 32 0.59 / 20 0.77 / 28 0.97 / 49 1.00 / 74 1.00 / 86 1.00 / 100 0.69 / 31 0.77 / 23 0.95 / 51 1.00 / 100 1.00 / 100
corresponding topology is poorly resolved (three nodes are supported by BPML > 70).
We also scanned the GHR alignment for potential indel signatures. A 3-bp deletion at position 1,925 of the GHR sequence of Rattus norvegicus (Accession number NM_017094) is diagnostic for the monophyly of Arvicol-inae. A 3-bp in-frame insertion – a direct AGC repeat – at position 1,778 of Rattus norvegicus (Accession number NM_017094) is shared by Neodon + Phaiomys, and inde-pendently by Blanfordimys + Lasiopodomys.
Independent paleontological and molecular studies respectively estimated that divergence times among some arvicoline genera occurred 3–5 Myr ago (Mya) [37] to 5– 9 Mya [30,34,42]. The adaptive radiation of Microtus has been dated to approximately 2 Myr by most paleontolo-gists [37,43] but there is molecular evidence for splits between 2.6 to 4.4 Mya [34]. The GHR topology is here more resolved than the CYB one for intergeneric
specia-tion events, corresponding to mean uncorrected pairwise divergences of 3.8 % ± 0.9 (GHR) versus 14.2 % ± 1.6 (CYB). For the 2–5 Myr old Microtus radiation, corre-sponding to divergences of 2.2% ± 0.6 (GHR) and 11.7 % ± 1.2 (CYB), the GHR topology is at least as resolved as the CYB one. These results emphasize previous conclusions [44] that highlighted the superiority of nuclear genes over mitochondrial genes even for divergences spanning the last 5–10 Myr.
(iii) Combination of CYB and GHR genes
Bayesian and ML analyses of the concatenation of mito-chondrial and nuclear data sets provide highly congruent and globally well-resolved topologies, very similar to the ones based upon GHR alone. Nevertheless, increased sup-port values are generally recorded. Thus, nine nodes are strongly supported and six are moderately supported. The newly recovered associations involve nodes labeled H, B, C, P, and Q (Figure 2): (i) Chionomys sister-group of
Micro-tus s.l. with Arvicola placed at the base of Arvicolini; (ii) Maximum posterior probability tree reconstructed from the combination of the mitochondrial CYB and nuclear GHR sequences
Figure 2
Maximum posterior probability tree reconstructed from the combination of the mitochondrial CYB and nuclear GHR sequences. Three reliability indices are given on nodes: the Bayesian posterior probabilities/the bootstrapped
Bayesian posterior probabilities/the maximum likelihood percentages. Letters (from A to Q) refer to nodes recovered both in ML and Bayesian inferences (see Table 2).
0.1 s.p.s. Meriones Rattus Phyllotis Mesocricetus Prometheomys schaposnikowi Phenacomys intermedius Dicrostonyx torquatus 0.92 / 0.46 / 67 Ondatra zibethicus Lemmus sibiricus Eothenomys melanogaster Myodes glareolus Myodes andersoni 1.00 / 1.00 / 100 1.00 / 0.96 / 99 Arvicola terrestris Chionomys nivalis Neodon irene Phaiomys leucurus 1.00 / 1.00 / 99
Microtus ( Alexandromys ) middendorffi Microtus ( Alexandromys ) kikuchii
Microtus ( Alexandromys ) oeconomus
0.95 / 0.61 / 71 1.00 / 0.89 / 92
Microtus ( Terricola ) duodecimcostatus Microtus ( Microtus ) arvalis
Microtus ( Microtus) guentheri
1.00 / 0.62 / 72
0.88 / 0.48 / 29
Blanfordimys bucharicus Lasiopodomys mandarinus
0.84 / 0.32 / 39
Microtus ( Pedomys ) ochrogaster Microtus (Aulacomys) richardsoni Microtus chrotorrhinus
Microtus ( Mynomes ) pennsylvanicus Microtus longicaudus 0.78/ 0.52 / 55 0.67 / 0.30 / 0.64 / 0.31 / -0.98 / 0.60 / 32 0.91 / 0.31 / 18 0.90 / 0.25 / 34 0.97 / 0.50 / 50 1.00 / 0.84 / 78 1.00 / 0.78 / 76 1.00 / 0.85 / 87 1.00 / 0.79 / 85 0.76 / 40 / 49 0.96 / 0.67 / 56 1.00 / 1.00 / 100 0.50 / 0.52 / 47 1.00 / 0.99 / 98 A R V I C O L I N I MYODINI LEMMINI ONDATRINI DICROSTONYICHI PHENACOMYINI PROMETHEOMYINI A C B E F D G H J I L M K N O P Q
Prometheomys emerging first within Arvicolinae; (iii) Dicrostonyx + Phenacomys; (iv) a clade, only supported in
the Bayesian analysis (PP = 0.97; BPbay = 0.60), and unit-ing five Microtus species: M. (Pedomys) ochrogaster, M.
(Aulacomys) richardsoni, M. chrotorrhinus, M. (Mynomes) pennsylvanicus, and M. longicaudus; (v) Microtus (Mynomes) pennsylvanicus sister-group of Microtus longicaudus.
Clades moderately to strongly supported in the GHR tree data benefit from similar support values after the combi-nation of GHR and CYB sequences. Actually, a substantial increase of support is found for nodes defining the basal position of Prometheomys, and the monophyly of Microtus
s.l. is reinforced. On the opposite, the sister-clade
relation-ship recovered between Myodini and Arvicolini is less supported in the combined tree than in the GHR one. Expectedly, the M. arvalis + M. guentheri clade, recovered by CYB data, is similarly supported in the combination. To summarize, the combination of CYB and GHR sequences provides a phylogeny where two-third of the nodes benefit from a medium to high support (Figure 2). The addition of nuclear sequences also allows the division of a single, multi-taxa polytomy into two noticeably smaller multifurcations. The first includes Arvicolini,
Ondatra, Lemmus, Dicrostonyx, and Phenacomys, although
the latter two genera are consistently found as sister-group across the different reconstructions performed. The sec-ond multifurcation includes phylogenetic relationships among Microtus s.l. subclades with evidence for a deeper divergence of the Neodon + Phaiomys lineage.
2. Systematics of voles, lemmings, and muskrats
(i) Interrelationships of major genera
For the first time, and contrary to phylogenies based on mitochondrial data alone [34], the use of a nuclear DNA exon sheds light on the systematics of arvicoline rodents. The validation of the Arvicolini tribe is one of the most striking results. The molecular evidence for a clade includ-ing Arvicola, Chionomys, and Microtus s.l. (Figure 2) – with the water vole emerging at first – agrees with paleontol-ogy. Actually, the genera Microtus and Chionomys are sup-posed to be linked to Allophaiomys which represents an early split from the lineage Mimomys that led to Arvicola [37]. Our results concur with other research [45,46] that red-backed voles form a complex of closely related species as suggested by the strong support recovered for the grouping of Myodes, (i.e., Clethrionomys and Phaulomys
sensu [47]) with Eothenomys.
In addition, a first molecular evidence is here provided for the phylogenetic position of enigmatic genera suspected to have differentiated early within the arvicoline radia-tion. The long-clawed mole-vole, Prometheomys, currently localised in the Caucasus Mountains, was considered as a
relic of an archaic lineage formerly widespread through-out most of Eurasia [33,48-51]. This view is corroborated by its first emergence in the GHR and combined phyloge-netic trees (Figures 1B and 2). The collared lemming,
Dicrostonyx as well as the heather vole, Phenacomys, exhibit
plesiomorphic morphological traits which have compro-mised their systematic affiliation to other arvicolines.
Dicrostonyx was initially grouped with true lemmings
whereas Phenacomys was included in either Arvicolini or Myodini [33]. By obtaining a moderately supported sister-taxa relationship between Dicrostonyx and Phenacomys, our study is in accordance with previous result from the anal-ysis of highly repetitive DNA (LINE-1) elements [52]. Although unexpected, this clade might find a biogeo-graphical explanation as these two taxa are primarily known – from a palaeontological viewpoint – in the Arctic region of Eurasia and North America [37,53,54].
To summarize our results from a taxonomic standpoint, the phylogenetic relationships discussed above agree with the tribal recognition of Lemmini (Lemmus), Ondatrini (Ondatra), Dicrostonychini (Dicrostonyx), Phenacomyini (Phenacomys), Prometheomyini (Prometheomys), Myodini (Myodes and Eothenomys) and Arvicolini (Arvicola,
Chiono-mys, Microtus, Neodon, PhaioChiono-mys, BlanfordiChiono-mys, and Lasiopo-domys) [33].
(ii) Systematics of Microtus
Thanks to the sampling of new taxa and nuclear DNA data, our phylograms helped to test the accuracy of sys-tematic treatment of Microtus taxa and close genera. Some taxa – Blanfordimys, Chionomys, Lasiopodomys, Neodon,
Phaiomys – have indeed been split from Microtus because
they retain distinctive and plesiomorphic morphological/ caryological traits [33]. However, except for Chionomys (snow voles), other taxa are interspersed among "true"
Microtus lineages in our nuclear or combined topologies,
giving no support to their generic recognition.
Actually, three lineages are clearly identified within
Micro-tus. Firstly, strong evidence is provided for a Neodon + Phaiomys subgenera clade, contradicting former studies
[33] which, using molar and other external and cranial contrasts, rejected any close phylogenetic affinity between them. Secondly, Microtus kikuchii, M. oeconomus, and M.
middendorffi form a well-supported association.
Inde-pendent source of phylogenetic data – here nuclear GHR sequences – thus confirm the "Asian lineage" recently identified on the basis of mitochondrial phylogenies and chromosomal data [35,36,55], as well as the monophyly of the subgenus Alexandromys, as redefined in [33]. The five nearctic species included in our analysis and repre-sentatives of various subgenera (Aulacomys, Mynomes,
Pedomys, as well as Microtus longicaudus and M. chrotorrhi-nus whose systematic status is unclear) are associated with
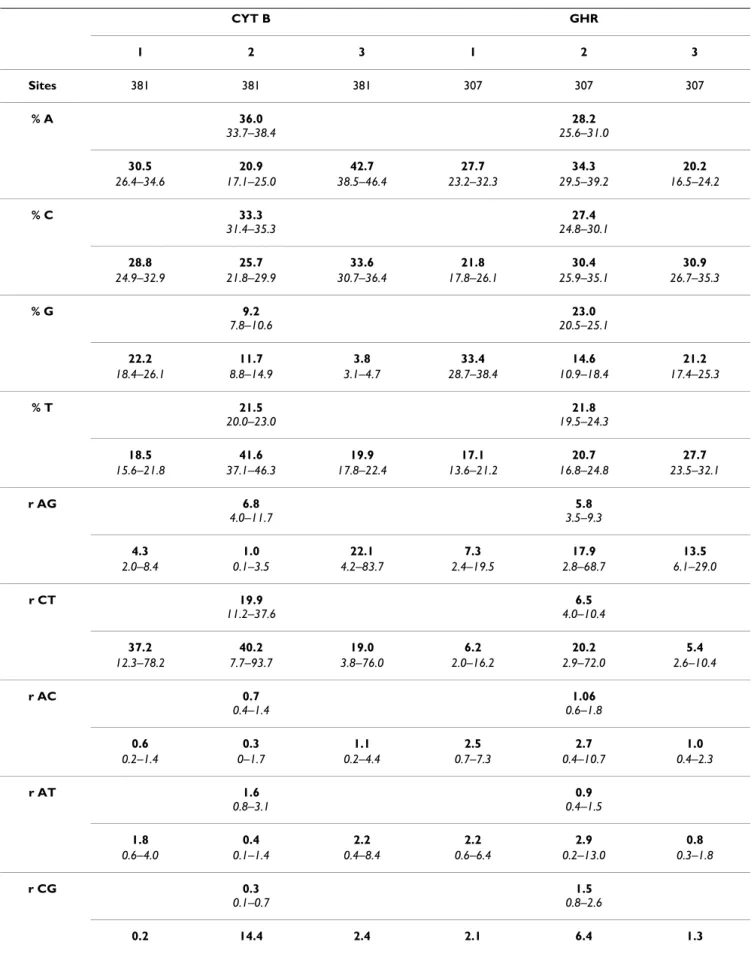
Table 1: Bayesian estimates of DNA substitution model parameters for CYB, GHR, and their codon positions. CYT B GHR 1 2 3 1 2 3 Sites 381 381 381 307 307 307 % A 36.0 33.7–38.4 28.2 25.6–31.0 30.5 20.9 42.7 27.7 34.3 20.2 26.4–34.6 17.1–25.0 38.5–46.4 23.2–32.3 29.5–39.2 16.5–24.2 % C 33.3 31.4–35.3 27.4 24.8–30.1 28.8 25.7 33.6 21.8 30.4 30.9 24.9–32.9 21.8–29.9 30.7–36.4 17.8–26.1 25.9–35.1 26.7–35.3 % G 9.2 7.8–10.6 23.0 20.5–25.1 22.2 11.7 3.8 33.4 14.6 21.2 18.4–26.1 8.8–14.9 3.1–4.7 28.7–38.4 10.9–18.4 17.4–25.3 % T 21.5 20.0–23.0 21.8 19.5–24.3 18.5 41.6 19.9 17.1 20.7 27.7 15.6–21.8 37.1–46.3 17.8–22.4 13.6–21.2 16.8–24.8 23.5–32.1 r AG 6.8 4.0–11.7 5.8 3.5–9.3 4.3 1.0 22.1 7.3 17.9 13.5 2.0–8.4 0.1–3.5 4.2–83.7 2.4–19.5 2.8–68.7 6.1–29.0 r CT 19.9 11.2–37.6 6.5 4.0–10.4 37.2 40.2 19.0 6.2 20.2 5.4 12.3–78.2 7.7–93.7 3.8–76.0 2.0–16.2 2.9–72.0 2.6–10.4 r AC 0.7 0.4–1.4 1.06 0.6–1.8 0.6 0.3 1.1 2.5 2.7 1.0 0.2–1.4 0–1.7 0.2–4.4 0.7–7.3 0.4–10.7 0.4–2.3 r AT 1.6 0.8–3.1 0.9 0.4–1.5 1.8 0.4 2.2 2.2 2.9 0.8 0.6–4.0 0.1–1.4 0.4–8.4 0.6–6.4 0.2–13.0 0.3–1.8 r CG 0.3 0.1–0.7 1.5 0.8–2.6 0.2 14.4 2.4 2.1 6.4 1.3
some support in the combined analysis. The recognition of an American clade within Microtus strengthens previous results from biochemical analyses [37] and mitochondrial phylogenies [35,36]. Third, some support for a Terricola +
Microtus clade is recovered, suggesting close phylogenetic
affinities among Western Palaearctic taxa, and reinforcing the conclusions of [36].
3. Compared molecular evolution of CYB and GHR in arvicolines
(i) Characteristics of substitution patterns
Nucleotide substitutions appear to accumulate in CYB and GHR according to contrasted patterns. CYB evolves at a high rate, 11.6 times faster than GHR does as indicated by the total branch length of ML phylograms. Moreover, as expected for a mitochondrial protein-coding gene [7], Table 1 indicates that CYB: (i) has a base composition that greatly deviates from uniformity due to an important def-icit of G (< 10%) and an excess of C and A (ca. 35%) ; (ii) is characterized by strong biases in relative substitution rates, with an excess of transitions over transversions, notably due to a higher frequency of C-T changes ; (iii) shows a stronger rate heterogeneity among sites, with a Γ shape parameter (α = 0.17) lower than the one of GHR (α = 0.48). These patterns reflect the fact that most of CYB substitutions occur on third codon positions and are gen-erally synonymous.
(ii) Contrasted substitution patterns among codon positions
As generally pointed out for nuclear genes relative to mitochondrial ones, GHR exhibited a less contrasted sub-stitution pattern during its evolutionary course. For instance, more heterogeneity among codon partitions is observed for CYB relative to GHR for two parameter sets. (i) Evolutionary rates – as measured by total branch lengths (TBL) on ML phylograms – are highly heterogene-ous among CYB codon positions, with CYB3 (TBL = 58.20) evolving respectively about 24 and 166 times faster than CYB1 (TBL = 2.39), and CYB2 (TBL = 0.35). On the contrary, evolutionary rates are moderately contrasted among GHR codon positions, with GHR3 (TBL = 1.17) evolving three times faster than GHR1 (TBL = 0.41) and GHR2 (TBL = 0.34). (ii) Base composition also appears more heterogeneous among CYB codon positions (Table
1), with 11.7% and 3.8% of G for CYB2 and CYB3 respec-tively. By contrast, only GHR2 shows such a low value of G (14.6%). An excess of T in CYB2 (41.4%) and A in CYB3 (43.2%) is also noticed. Moreover, all GHR codon posi-tions pass the 1% chi-square test that compares the nucle-otide composition of each sequence to the frequency distribution assumed in the ML model, whereas Microtus
oeconomus and M.middendorffi CYB third codon positions
violate it.
(iii) Partitioned likelihood analyses
The marked differences of base composition and evolu-tionary dynamics observed among CYB and GHR codon positions led us to apply the partitioned likelihood approach [56] in order to evaluate their impact on model fit (Table 2). For both CYB and GHR, the AICs for parti-tioned models are the lowest, confirming a gain in log-likelihood when an independent set of parameters is attributed to each codon position. Actually, AICs indicate that all sets of parameters for CYB are contrasted enough among codon positions to have an impact on model fit (Table 2). More precisely, the greater increase of log-like-lihood values is due, in decreasing order of impact, to var-iable rates between sites (Γ), to varvar-iable evolutionary rates along branches (BL), to variable base compositions (BC), and to variable GTR substitution rates (GTR). By contrast, for GHR sequences, AICs indicate that only BC and Γ have a significant impact on model fit, whereas the incorpora-tion of free GTR and BL parameters for each of the three codon positions induces the over-parametrization of such models (Table 2). These analyses confirm that there is more heterogeneity among CYB codon partitions than among GHR partitions.
4. Identification of promising nucleotide sites for arvicoline phylogenetics
Although some studies have elucidated the limited phylo-genetic utility of individual nuclear genes at low taxo-nomic level because of their low variability [29,32,57], we provide here a well-resolved GHR tree among Arvicolinae. We will now explore why GHR performs better than CYB for deeper nodes – the inter-generic arvicoline radiation – , and also provides increased support to more recent nodes – the Microtus sublineages.
0–0.7 1.6–49.5 0.1–10.9 0.6–5.6 1.0–24.3 0.5–2.7 α (Γ 8) 0.17 0.16–0.19 0.48 0.41–0.53 0.14 0.05 1.22 0.05 0.05 0.22 0.12–0.17 0.05–0.06 0.96–1.54 0.05–0.05 0.05–0.06 0.18–0.27
Number of sites, base composition (%A, C, G, and T), relative GTR substitution rate parameters (r AG, CT, AC, AT, CG, standardized to r GT = 1.0), and Gamma shape parameter (Γ) are given, with mean values on first sublines, and 95% credibility intervals, italicized on second sublines. Parameter estimates are also measured for each codon position, and are recapitulated in columns 1 (first), 2 (second), and 3 (third positions).
(i) Localization of the phylogenetic signal among codon positions
The analysis of the contribution of each codon partition to node resolution reveals that GHR3 holds the most informative sites (Table 3). GHR3 sites recover most of the nodes with strong support, especially within the interge-neric radiation. Although its phylogenetic signal generally appears slightly lower for the last 2 Myr divergences (e.g., intra-Microtus nodes), globally, GHR3 remains the most informative partition. GHR1 and CYB3 contribute much less than GHR3 to overall resolution but hold some sup-port (BP > 40) for ca. one-third of the nodes. On the con-trary, other partitions – CYB1 and, especially, CYB2 and GHR2 – are not informative for intra-Arvicolinae relation-ships as reflected by exceedingly low bootstrap scores (BP < 28: Table 2). With respect to nodes that are revealed or are more strongly supported by the combination of CYB and GHR (e.g. nodes H and P), we notice that no partition is superior in resolution ability with a weak signal being shared by all codon positions.
(ii) Substitution saturation through time
The lack of phylogenetic signal at high taxon level often recorded by mitochondrial sequences has been consid-ered as a direct consequence of substitution saturation [e.g. [27,58]]. We thus evaluated the saturation level of each codon partition by plotting the pairwise observed substitutions between the 28 sequences as a function of the pairwise number of substitutions inferred on the ML tree (Figure 3). Under this graphical representation, CYB3 appears extremely saturated (slope S = 0.02), suggesting that high levels of nucleotidic saturation may be reached for speciation events more recent than 5–10 Ma. This trend is perhaps here exaggerated by the fast evolutionary rate of muroid rodent sequences [44]. Multiple substitu-tions also occur at CYB1 (S = 0.17) whereas analyses for CYB2 (S = 0.47) and all GHR codon positions (0.69 < S < 0.99) do not reveal significant saturation as detected by ML. Codon partitions can thus be categorized into three classes corresponding to (i) highly saturated and weakly informative sites (CYB1 and CYB3); (ii) less saturated and
weakly informative sites (CYB2, GHR1, and GHR2); (iii) less saturated and strongly informative sites (GHR3).
(iii) The efficiency of GHR third codon positions
By comparing contribution to node resolution, saturation level, and evolutionary patterns inherent to each codon partition, it becomes possible to determine the character-istics of informative versus uninformative molecular sites. We thus realize that GHR3 differed from uninformative CYB2, GHR1, and GHR2 partitions by a faster evolution rate (see above, section 3). In contrast, CYB3 and CYB1 partitions are much less informative than GHR3 despite higher evolutionary rates that would have allowed the accumulation of a larger number of synapomorphies. A high substitution rate thus appears detrimental too, hav-ing been more likely to have led to saturation (Figure 3). Moreover, strong biases in base composition and GTR substitutions could also favour substitutional saturation. For instance, although CYB1 and GHR3 share similar evo-lutionary properties (GC levels, Γ shape, GTR rates: Table 1) – CYB1 is more affected by multiple substitutions because of either a slightly higher evolutionary rate or an excess of C-T over A-G transitions. Our study therefore suggests that third codon positions of GHR are the most suitable sites for resolving the recent evolutionary radia-tion of arvicoline rodents. The higher efficiency of GHR3 is a result of the trade-off in evolutionary rate, rapid enough to accumulate synapomorphies, yet slow enough to remain unaffected by saturation.
5. Perspectives: Which markers to be used for resolving the arvicoline radiation?
The resolved GHR tree is perhaps a first step in challeng-ing the hypothesis of a hard-polytomy for Arvicolinae genera. As shown for other placental taxa – spiral-horn antelopes [32], hares [57], or bears [59] – our results sug-gest that phylogenetic signal has been progressively oblit-erated by higher mtDNA rates whereas it has persisted in at least one slower-evolving nuclear gene. However, the
Table 2: Akaike Information Criterion (AIC) sensitivity analyses about the effect of model parameters on log-likelihood gains provided by codon partitions.
Model of DNA evolution
No codon partition BC effect GTR effect Γ effect BL effect BC + GTR + Γ + BL effect
CYB 23,021.0 22,742.4 22,954.8 22,509.1 22,689.3 21,901.9 GHR 8,352.0 8,306.1 8,347.7 8,346.2 8,434.3 8,388.3
In the simplest model – without codon partition–, a single set of base composition (BC), substitution rate (GTR), among-sites rate heterogeneity (Γ), and branch length (BL) parameters is used, irrespective of the CYB and GHR codon positions. In the most complex model, one independent set of BC, GTR, Γ, and BL parameters is attributed to each codon position of either CYB or GHR. For intermediate models, the effect of giving a set of either BC, GTR, Γ, or BL parameters to each codon partition is measured through the AIC (= -2 × log-likelihood of the reference topology [Figure 2] + 2 × number of free parameters). The best, i.e., lowest, AIC are in bold for each gene.
GHR gene tree is based on a single nuclear locus (GHR), and it does not necessarily reflect the organismal history of arvicoline rodents. Actually, the resolution of the poly-tomy is further complicated by the eventual incongruence of individual gene trees with species trees due to incom-plete lineage sorting [60]. Consequently, the comparison of multiple gene trees is the only way to get a central ten-dency which could be interpreted as the species tree [61-63]. If multiple gene trees agree on a phylogenetic struc-ture, we could then definitively dismiss the star-phylog-eny hypothesis for the Arvicolinae. In addition to allowing us to make predictions on the amount of CYB/ GHR data required to decipher the phylogeny of the Arvi-colinae, variable length bootstrap analyses help us to identify which kind of markers should be considered for further sequencing.
(i) The not-so-evil mitochondrial DNA
Four examples of VLB curves are provided on Figure 4: two represent deeper (intergeneric) nodes, moderately (node C) to strongly (node G) supported in the GHR + CYB tree, and two others correspond to more recent (intra Microtus) nodes, moderately (node P) to strongly (node L) sup-ported in the combined topology. For most nodes (including nodes C, G, L, P; Figure 4), the resampling of more CYB sites does not induce an increase of bootstrap support. Despite using a ML model for VLB analyses which better accommodates base composition bias and among-site rate heterogeneity, CYB sequences do not
appear more efficient than in other studies focusing on comparable taxonomic levels [29]. Thus, the analysis of more data holding the same evolutionary properties as CYB might not bring more overall resolution.
The lack of phylogenetic signal as well as strong saturation and large among-sites heterogeneity questions the utility of CYB sequences for investigating phylogenetic relation-ships among taxa, like voles and lemmings, which have experienced relatively recent and rapid radiations. Actu-ally, we concur with others [64,65] on the usefulness of CYB sequences – including third codon positions – when they are combined with less saturated sequences. Firstly, we have shown that CYB sometimes holds phylogenetic signal for specific nodes where GHR is non-informative (node O, see Results & Discussion, paragraph 1). Although our study mainly focuses on intergeneric phylo-genetic relationships, we could expect that CYB contribu-tion would increase with nodes younger than 2 Myr. Secondly, VLB curves clearly indicate that data combina-tion (CYB + GHR) provides slightly higher bootstrap sup-port than does GHR alone, especially when the number of resampled sites is higher than 2,000 (e.g., nodes L and P: Figure 4). Results of VLB analysis and comparisons of GHR and combined topologies show that the CYB signal does not contradict the GHR one. Moreover, the incorpo-ration of CYB data to nuclear data does not lead to the degradation of phylogenetic signal but slightly improves it, revealing the existence of weak and initially hidden
Table 3: Maximum likelihood bootstrap support for a selection of nodes, computed according to codon positions 1, 2, or 3 of CYB and GHR.
Nodes CYB 1 CYB 2 CYB 3 GHR 1 GHR 2 GHR 3
Intergeneric relationships
Phyllotis + Mesocricetus + Arvicolinae 70 32 * 63 40 66
A * 63 * 88 35 99 B * * * 44 * 21 C 28 * 11 * 28 34 D * * * * 14 90 E * * 45 * * 91 F 55 * 50 43 * 98 G * * * 20 * 87 H * 20 33 20 * * I * 22 33 * * 81 Intra-"Microtus" relationships J 14 18 79 52 22 92 K * * * * * 41 L 8 * 47 55 * 82 M 40 10 14 * 28 34 N * * 11 * * 15 O 26 * 42 * * 31 P * * * * * 27 Q 44 * * * * 29
Node lettering refers to Figure 2. Stars correspond to bootstrap scores inferior to 5% for the corresponding node under the codon partition analyzed.
information within CYB. Because complete mitochon-drial genomes include sequences undergoing various evo-lutionary pressures (e.g. CYB, but also COX1, or rRNAs), and are available for an increasing number of taxa, partic-ularly among mammals, we suggest the evaluation of their ability to resolve rapid radiations at low taxonomic level [66], and a comparison of their efficiency to that of nuclear loci.
(ii) The virtues of nuclear DNA
As exemplified in Figure 4, GHR performs better than CYB for most nodes, irrespective of the age of the node. More generally, VLB curves indicate a higher efficiency of GHR relative to CYB sequences for nearly all nodes, i.e., they recover nodes with higher bootstrap support with a lower
number of resampled sites. Even for weakly supported nodes in our initial analyses of ca. 1000 GHR sites, only 2,000 to 4,000 GHR additional sites are needed to increase BP values up to 70% or more. We may thus expect a significant improvement in nodal support through the sequencing of nuclear data in an order of magnitude three to five times greater than the size of GHR exon 10. As VLB applies the resampling of sites holding the same phylogenetic signal as GHR, this method may provide conservative predictions on the impact of further sequencing on the overall resolution of the arvicoline phylogenetic tree. By adding nuclear data sampled from different loci, we could expect an improvement in node resolution [67], in particular for nodes not well-supported by GHR data alone (e.g. nodes P, G). Since genetically
Saturation plots of the number of observed differences as a function of the numbers of inferred substitutions for each pair of sequences at each codon position of CYB and GHR genes
Figure 3
Saturation plots of the number of observed differences as a function of the numbers of inferred substitutions for each pair of sequences at each codon position of CYB and GHR genes. The Y = X straight line corresponds to
the situation where there is no homoplasy detected in the data. Note that the scale of the X-axis is four-fold the scale of the other partitions for CYB1, and 60-fold for CYB3. The scale of the Y-axis is 10-fold the scale of the other partitions for CYB3.
0 20 40 60 80 100 0 20 40 60 80 100 0 20 40 60 80 100 0 20 40 60 80 100 0 20 40 60 80 100 0 20 40 60 80 100 0 20 40 60 80 100 0 100 200 300 400 y = x 0 20 40 60 80 100 0 20 40 60 80 100 y = x 0 200 400 600 800 1000 0 2000 4000 6000
ML inferred number of substitutions
Observ ed differen c e s CYB 1 CYB 2 CYB 3 GHR 1 GHR 2 GHR 3 y = x y = x y = x y = x
independent loci have undergone different substitutional pressures, they may provide complementary resolution of the species tree, and increase the chance of finding molec-ular synapomorphies that resolve every node [13,29,57,64]. Furthermore, we predict that introns might be equally as efficient for retracing the phylogeny of voles and lemmings – as recently shown for similar recent evo-lutionary radiations [14,29,59] – because of their relaxed substitution constraints and their potentially greater number of informative sites.
Conclusion
The nuclear exon 10 of the GHR performs better than the mitochondrial CYB for resolving Arvicolinae phylogenetic relationships. Support is found for a sister-group relation-ship between red-backed voles (Myodini) and a clade including water (Arvicola), snow (Chionomys), and meadow voles (Microtus and allies). Lemmings (Lemmus and Dicrostonyx) are found polyphyletic while the
Cauca-sian long-clawed vole (Prometheomys) is among the basal-most arvicoline genera. Contrary to recent taxonomic suggestions, we do not obtain support for splitting
Blan-fordimys, Lasiopodomys, Neodon, and Phaiomys from Micro-tus. We concur with others [68-70] that the higher quality
of nuclear genes resides in higher values of gamma param-eter, uniform and stationary base compositions, and more uniform nucleotide substitution probabilities. The useful-ness of nuclear exons for investigating 2–10 Myr old evo-lutionary histories is probably due to highly informative third codon positions, which keep a good compromise in their evolutionary rate: rapid enough to accumulate synapomorphies, yet slow enough to be not affected by substitutional saturation. The sequencing of nuclear DNA data in an order of magnitude three to five times greater than the size of GHR exon 10 might resolve most nodes of the Arvicolinae phylogeny provided that multiple geneti-cally independent gene trees agree on the phylogenetic structure.
Plots of the variable-length bootstrap percentages for CYB (filled circles), GHR (filled triangles), and combined data (open squares) for four nodes recovered in Bayesian and ML analyses (see Fig. 2)
Figure 4
Plots of the variable-length bootstrap percentages for CYB (filled circles), GHR (filled triangles), and com-bined data (open squares) for four nodes recovered in Bayesian and ML analyses (see Fig. 2). The X-axis is the
number of sites resampled (in 250-bp increments from 0 to 5000-bp), and the Y-axis is the maximum likelihhod BP percentage (out of 100 pseudoreplicates). 0 10 20 30 40 50 60 70 80 90 100 100 250 500 750 1000 1250 1500 1750 2000 2250 2500 2750 3000 3250 3500 3750 4000 4250 4500 4750 5000 0 10 20 30 40 50 60 70 80 90 100 100 250 500 750 1000 1250 1500 1750 2000 2250 2500 2750 3000 3250 3500 3750 4000 4250 4500 4750 5000 0 10 20 30 40 50 60 70 80 90 100 100 250 500 750 1000 1250 1500 1750 2000 2250 2500 2750 3000 3250 3500 3750 4000 4250 4500 4750 5000 0 10 20 30 40 50 60 70 80 90 100 100 250 500 750 1000 1250 1500 1750 2000 2250 2500 2750 3000 3250 3500 3750 4000 4250 4500 4750 5000
Number of bases resampled
Number of bases resampled
Number of bases resampled
Number of bases resampled
% b ootstrap s upport % b ootstrap s upport % b ootstrap s upport % b o otstrap s upport Node G Node L Node C Node P
Methods
Taxonomic sampling and molecular biological methods
Our study is based on a total of 25 arvicoline species rep-resenting 14 of the 28 genera and 7 of the 10 tribes
accord-ing to [33]. For the genus Microtus, we included 12 specimens belonging to different subgenera or species whose taxonomic status is questionable [35,36] (see Table 1). We used as outgroups, representatives of two lineages
Table 4: Genera and species of Arvicolinae, with cytochrome b (CYB) and Growth Hormon Receptor (GHR) accession numbers and references.
Subfamily (Genus)
(Subgenus) Species
Common name CYB CYB GHR GHR Source
Accession Reference Accession Reference
Gerbillinae Meriones shawi Shaw's jird - - AF332021 [90]
Meriones unguiculatus
Mongolian jird AF159405 [91] - -Murinae Rattus norvegicus Brown Rat VO1556 [92] X16726 [93] Sigmodontinae Phyllotis darwini Darwin's leaf-eared mouse U86819 [94] AF332023 [90] Cricetinae Mesocricetus
auratus
Golden Hamster AF119265 [34] AF540632 [95] Arvicolinae
Arvicola A. terrestris European water vole AF119269 [34] AM392380 This study ISEM T-3054
Blanfordimys B. bucharicus Bucharian vole AM392369 This study AM392392 This study ISEM T-1060
Chionomys C. nivalis European snow vole AM392367 This study AM392378 This study ISEM T-523
Dicrostonyx D. torquatus Arctic Lemming AF119275 [34] AM392381 This study ISEM T-1337
Eothenomys E. melanogaster Père David's vole AM392374 This study AM392399 This study ISEM T-4338
Lasiopodomys L. mandarinus Mandarin vole AM392373 This study AM392396 This study ISEM T-1066
Lemmus L. sibiricus Brown Lemming AJ012671 [96] AM392398 This study ISEM T-1336
Microtus M. (Microtus) arvalis
Common vole U54488 [97] AM392386 This study ISEM T-3047
M. (Aulacomys) chrotorrhinus
Rock vole AF163893 [98] AM392383 This study ISEM T-603
M. (Aulacomys) richardsoni
Water vole AF163905 [98] AM392387 This study ISEM T-598
M. (Terricola) duodecimcostatu s
Mediterranean pine vole AM392375 This study AM392400 This study ISEM T-4456
M. (Microtus) guentheri
Gunther's vole AY513804 [36] AM392397 This study ISEM T-4179
M.
(Alexandromys) kikuchii
Taiwan vole AF163896 [98] AM392385 This study ISEM T-276
M. (?) longicaudus
Long-tailed vole AF119267 [34] AM392379 This study ISEM T-136
M.
(Alexandromys) middendorffi
Middendorf's vole AF163898 [98] AM392390 This study ISEM T-3509
M. (Pedomys) ochrogaster
Prairie vole AF163901 [98] AM392389 This study ISEM T-130
M.
(Alexandromys) oeconomus
Tundra vole AF163902 [98] AM392388 This study J.R. Michaux
M. (Mynomes) pennsylvanicus
Meadow vole AF119279 [34] AM392376 This study ISEM T-140
Myodes M. andersoni Japanese red-backed vole AB037281 [99] AM392391 This study ISEM T-1341
M. glareolus Bank vole AM392368 This study AM392384 This study ISEM T-1389
Neodon N. irene Chinese scrub vole AM392370 This study AM392393 This study P. Giraudoux & J.-P. Quéré
Ondatra O. zibethicus Muskrat AF119277 [34] AM392382 This study P.-A. Crochet
Phaiomys P. leucurus Blyth's vole AM392371 This study AM392394 This study P. Giraudoux & J.-P. Quéré
Phenacomys P. intermedius Western heather vole AF119260 [34] AM392377 This study ISEM T-672
Prometheomys P.
schaposchnikowi
Long-clawed mole-vole AM392372 This study AM392395 This study ISEM T-377
phylogenetically close to the Arvicolinae, Mesocricetus
auratus (Cricetinae), and Phyllotis darwinii
(Sigmodonti-nae) [42,71,30]. Two other taxa belonging to different subfamilies of Muridae, Rattus norvegicus (Murinae) and
Meriones sp. (M. shawi + M. unguiculatus; Gerbillinae),
were chosen as more distant outgroups.
All ethanol-preserved arvicoline samples were stored in the mammalian tissue collection of the Institut des Sci-ences de l'Evolution de Montpellier [72]. Total DNA was extracted using the QIAamp DNA mini kit (Qiagen). Part of the GHR exon 10 was amplified and sequenced using the primers GHR5 forward (5' GGCRTTCATGAYAACTA-CAAACCTGACYTC 3') and GHR6 reverse (5' GAGGA-GAGGAACCTTCTTTTTWTCAGGC 3'), and GHR3 forward (5' GACTTTATGCYCARGTRAG 3') and GHR4 reverse (5'-CTYACYTGRGCATAAAAGTC 3'). PCR condi-tions were 95°C 5 min, followed by 95°C 30 sec, 61°C 30 sec, 72°C 1 min (5 times), then 95°C 30 sec, 59°C 30 sec, 72°C 1 min (5 times), followed by 95°C 30 sec, 57°C 30 sec, 72°C 1 min (5 times), then 95°C 30 sec, 55°C 30 sec, 72°C 1 min (5 times), and then 95°C 30 sec, 53°C 30 sec, 72°C 1 min (20 times), with a final extension at 72°C 5 min.
The amplification and sequencing of the CYB were con-ducted using primers MVZ05 and MVZ14 [73] and addi-tional internal ones MVZ16 [73] and H8 [74]. PCR products for GHR and CYB were purified from 1% agarose gels using Amicon Ultrafree-DNA columns (Millipore) and sequenced on both strands using automatic sequenc-ing (Big Dye Terminator cycle kit) on an ABI 310 (PE Applied Biosystems).
All taxa included in our study were represented by both CYB and GHR sequences. A 921 bp segment of the exon 10 of GHR was sequenced for 22 specimens and the com-plete CYB (1140 bp) for 7 specimens. The arvicoline sequences new to this study have been deposited in the EMBL data bank, and we also used previously published sequences when available (see Table 1).
Sequence alignment and phylogenetic analyses
Sequences were manually aligned with the ED editor of the MUST package [75]. Non-sequenced positions as well as introduced gaps were treated as missing data in subse-quent analyses. Heterozygotic bases found in GHR sequences were coded following the IUPAC nucleotide ambiguity code.
Phylogenetic analyses of CYB and GHR alignments were conducted under the maximum likelihood (ML) and Bayesian methods, using PAUP* [76] version 4b10, PHYML [77] version 2.4.4, and MrBayes version 3.04 [78]. Moreover, MrBayes provided the opportunity to run
analyses assuming different models of sequence evolution for each predefined partition, thus permitting the param-eters estimated for each model of sequence evolution to be directly compared among codon positions and between genes. When CYB and GHR sequences were com-bined, sequences from different specimens of the same species were sometimes used. We assumed that the phyl-ogeographic structure detected in some arvicoline species [45,79] was negligible as compared to the level of genetic divergence between the distinct Microtus subgenera and even arvicoline tribes here compared.
The program Modeltest [80] version 3.06, was used to determine the sequence evolution model that best fits our data using the Akaike Information Criterion (AIC). This program examined the fit of 56 models, with either a pro-portion of invariable sites (I), a gamma distribution of among-sites variation of substitution rates (Γ), or both (I + Γ). The best-fitting substitution models were TrN93 + Γ + I [81] for the GHR data set, and GTR + Γ + I [82] for the CYB data set. However, to run the same model of sequence evolution under PHYML and MrBayes, GTR was chosen for all phylogenetic analyses (the optimal GHR topology was not model-dependent, as it appeared that both GTR and TrN93 topologies were identical). To allow a fair comparison of α estimates of Γ-shape among genes and partitions, we did not use a proportion of invariable sites, but rather assigned eight discrete Γ categories (Γ8). The Γ distribution allows some sites to evolve at a very low rate, and the incorporation of a fraction of invariable sites does not necessarily lead to a significant increase in likeli-hood [83].
To avoid excessive calculation times, our PAUP* ML anal-yses were conducted in two steps. First, we estimated ML parameters on a neighbor-joining (NJ) starting tree. Sec-ond, a ML heuristic search was conducted by Tree Bisec-tion ReconnecBisec-tion (TBR) branch swapping to identify the optimal tree under these constrained GTR + Γ8 parameter
estimates. This tree was re-used for a new round of param-eter estimation/branch swapping, and the procedure was repeated until there was a stabilization of both topologies and parameters. The stability of nodes was estimated by ML bootstrap percentages (BPML) [84], computed by
PHYML after 100 replicates of site resampling, with BioNJ starting trees. Because of its rapidity, PHYML was pre-ferred over PAUP* for bootstrap analyses. To assess the amount of phylogenetic signal contained within an indi-vidual partition (each codon position of each gene), 500 replications of ML bootstrapping were also independently performed for each partition.
Bayesian analyses were performed with one distinct GTR + Γ8 model per gene and codon position, with unlinking base frequencies, GTR, and Γ parameters.
Metropolis-Coupled Markov chain Monte Carlo (MCMCMC) sam-pling was conducted during 10,000,000 generations with five incrementally heated chains. We used Dirichlet priors for base frequencies (1,1,1,1) and for GTR parameters (1,1,1,1,1) scaled to the G-T rate, a Uniform(0.05,50.00) prior for the Γ shape, and an Exponential(10.0) prior for branch lengths. Bayesian posterior probabilities (PP) were computed from trees sampled every 100 generations, after removing the 50,000 first trees as the "burn-in" stage. In order to discriminate between moderately and strongly supported nodes – for which initial PP were superior to 0.95 – we also calculated bootstrapped Bayesian posterior probabilities (BPbay) as suggested by [85] and [86]. Due to computing time limitations, BPbay were only computed for the combined data set (GHR + CYB). First, 100 boot-strap pseudo-replicates were independently generated from each of the six partitions (the three CYB and the three GHR codon positions) using the SEQBOOT pro-gram 3.6a2.1 [87] of the PHYLIP package. Second, for each of the 100 concatenated bootstrap data sets, MCM-CMC sampling of trees was performed as previously described for the original data under the six GTR + Γ8 par-titioned model, except that trees were sampled every 100 generations for only 500,000 generations. To maximize the probability that the chains reached stationarity in each bootstrap replicate, one-half of the 5,000 trees sampled from the posterior probability distribution was systemati-cally removed as the burnin [86]. BPbay resulted from the overall 50% majority rule consensus of the 500,000 saved trees.
Following [34], sequences were also analyzed at the amino-acid level. We respectively used the JTT + Γ + I and mtREV + Γ + I ML models of protein evolution for GHR and CYB sequences as implemented in PHYML.
Sensitivity analyses
We performed sensitivity analyses using PAUP* to assess the relative contribution of the various model parameters to the log-likelihood increase when more complex mod-els are considered. To take the evolutionary properties of each codon position into account, nucleotide sites were categorized into each of the three codon positions. The procedure was conducted separately for CYB and GHR sequences. All sets of parameters – base composition (BC), substitution rate matrix (GTR), heterogeneity of substitution rate among sites (Γ), and branch lengths (BL) – were estimated independently for each codon partition. AIC values were compared to assess the significance of likelihood variation between global and partitioned mod-els. For instance, to test the contribution of BC, only BC parameters were computed for each partition whereas other parameter values (GTR, Γ, BL) were fixed for the whole gene.
Evaluation of the saturation of nucleotide substitutions
The nucleotide saturation of the phylogenetic markers was assessed graphically according to the procedure of [88], by plotting the number of observed differences as a function of the ML inferred number of substitutions for all 351 pairwise comparisons for 27 sequences (the partial CYB sequence of Lasiopodomys mandarinus was removed). The inferred number of substitutions was estimated from the ML tree as the sum of the branch lengths linking two terminals. The level of saturation was estimated by the slope (S) of the linear regression between the observed and inferred substitutions. Substitutions saturation is evi-denced when the number of inferred substitutions increased, whereas the number of observed differences remained constant. We performed saturation analyses independently for each phylogenetic marker and for each codon position. ML branch lengths were obtained for each partition using PAUP* and by enforcing the topol-ogy as identical to the combined CYB + GHR tree.
Variable Length Bootstrap
To compare the phylogenetic resolving power of GHR and CYB at varying taxonomic levels, we used the variable-length bootstrap (VLB). In this method, bootstrap support is estimated as a function of a variable number of resam-pled characters [89]. For each data set, nucleotide sites were resampled to generate bootstrap pseudomatrices of 100, 250, and until 5000 characters with increasing steps of 250 sites. All bootstrap searches were then performed using ML analyses with PAUP*.
Authors' contributions
TG and EJPD initiated the study, assembled the data, designed and ran the calculations. TG contributed to col-lect specimens in the field, obtained DNA sequences, and wrote the manuscript under the supervision of EJPD. MKT intensively helped TG in DNA sequencing and sequence alignment. EP initiated the project on arvicoline phyloge-netics and obtained financial support. He contributed with TG to collect specimens and assisted with drafting. PC and SS provided CYB sequences and helped to improve the manuscript. All authors read and approved the final manuscript.
Acknowledgements
The authors wish to thank Francois Catzeflis who provided most of tissue samples for this study, Pierre-André Crochet, David Duneau and Johan R. Michaux who also contributed to increase our taxa set, Patrick Giraudoux, Jean-Pierre Quéré, and the European "Human cystic and alveolar echinoc-occosis in northwest China" STD TS3-CT94-0270 and National Institute of Health and National Science Fondation (USA) "Parasitic zoonosis transmis-sion in China"IR01TW01565-01 programs for some precious samples of Chinese voles. TG acknowledges the financial support of a MENRT Doc-toral grant. This work has also been supported by the "Institut Français de la Biodiversité", the "ACI Informatique-Mathématique-Physique en Biologie Moléculaire [ACI IMP-Bio]", the IFR119 "Biodiversité Continentale Médi-terranéenne et Tropicale" (Montpellier), and benefited from discussions
around the European Marie Curie project HOTSPOTS "Understanding and Conserving Earth Biodiversity" (contract MEST-CT-2005-020561). The authors wish to thank Andrew Rodrigues for his help, and two anonymous reviewers whose comments and suggestions greatly improved the paper. This publication is the contribution N° 2006-057 of the Institut des Sciences de l'Evolution de Montpellier (UMR 5554 – CNRS).
References
1. de Jong WW: Molecules remodel the mammalian tree. Trends
Ecol Evol 1998, 13:270-275.
2. Springer MS, Stanhope MJ, Madsen O, de Jong WW: Molecules
con-solidate the placental mammal tree. Trends Ecol Evol 2004, 19:430-438.
3. Da Silva MNF, Patton JL: Molecular phylogeography and the
evolution and conservation of Amazonian mammals. Mol Ecol
1998, 7:475-486.
4. Fleischer RC, Perry EA, Muralidharan K, Stevens EE, Wemmer CM:
Phylogeography of the Asian elephant (Elephas maximus) based on mitochondrial DNA. Evolution 2001, 55:1882-1892.
5. Michaux JR, Libois R, Paradis E, Filippucii MG: Phylogeographic
his-tory of the yellow-necked fieldmouse (Apodemus flavicollis) in Europe and in the Near and Middle East. Mol Phylogenet Evol
2004, 32:788-798.
6. Steiner C, Catzeflis F: Genetic variation and geographical
struc-ture of five mouse-sized opposums (Marsupialia, Didelphi-dae) thoughout the Guiana region. J Biogeogr 2004, 31:959-973.
7. Irwin DM, Kocher TD, Wilson AC: Evolution of the cytochrome
b gene of mammals. J Mol Evol 1991, 32:128-144.
8. Matthee CA, Robinson TJ: Molecular phylogeny of the
spring-hare, Pedetes capensis, based on mitochondrial DNA sequences. Mol Biol Evol 1997, 14:20-29.
9. Ozawa T, Hayashi S, Mikhelson VM: Phylogenetic position of
mammoth and Steller's sea cow within Tethytheria demon-strated by mitochondrial DNA sequences. J Mol Evol 1997, 44:406-413.
10. Hebert PDN, Ratnasingham S, deWaard JR: Barcoding animal life:
cytochrome c oxidase subunit 1 divergences among closely related species. Proc R Soc Lond B 2003, 270(Suppl 1):S96-S99.
11. Ma DP, Zharkikh A, Graur D, VandeBerg JL, Li WH: Structure and
evolution of opposum, guinea pig, and porcupine cyto-chrome b genes. J Mol Evol 1993, 36:327-334.
12. Matthee CA, Burzlaff JD, Taylor JF, Davis SK: Mining the
mamma-lian genome for Artiodactyl systematics. Syst Biol 2001, 50(3):367-390.
13. Springer MS, DeBry RW, Douady C, Amrine HM, Madsen O, de Jong
WW, Stanhope MJ: Mitochondrial versus nuclear gene
sequences in deep-level mammalian phylogeny reconstruc-tion. Mol Biol Evol 2001, 18:132-143.
14. Steiner C, Tilak M, Douzery EJP, Catzeflis FM: New DNA data
from a transthyretin nuclear intron suggest an Oligocene to Miocene diversification of living South America opposums (Marsupialia: Didelphidae). Mol Phylogenet Evol 2005, 35:363-379.
15. DeBry RW, Sagel RM: Phylogeny of Rodentia (Mammalia)
inferred from the nuclear-encoded gene IRBP. Mol Phylogenet Evol 2001, 19:290-301.
16. Huchon D, Catzeflis F, Douzery EJP: Variance of molecular
dat-ings, evolution of rodents, and the phylogenetic affinities between Ctenodactylidae and Hystricognathi. Proc R Soc Lond B 2000, 267:393-402.
17. Madsen O, Scally M, Douady CJ, Kao DJ, DeBry RW, Adkins R,
Amrine H, Stanhope MJ, de Jong WW, Springer MS: Parallel
adap-tative radiations in two major clades of placental mammals. Nature 2001, 409:610-614.
18. Murphy WJ, Eizirik E, Johnson WE, Zhang YP, Ryder OA, O'Brien S:
Molecular phylogenetics and the origins of placental mam-mals. Nature 2001, 409:614-618.
19. Porter AP, Goodman M, Stanhope MJ: Evidence on mammalian
phylogeny from sequences of exon 28 of the von Willebrand Factor gene. Mol Phylogenet Evol 1996, 5:89-101.
20. Springer MS, Burk A, Kavanagh JR, Waddell VG, Stanhope MJ: The
interphotoreceptor retinoid binding protein gene in therian mammals: Implications for higher level relationships and evi-dence for loss of function in the marsupial mole. P Natl Acad Sci USA 1997, 94:13754-13759.
21. Stanhope MJ, Smith MR, Waddell VG, Porter CA, Shivji MS, Goodman
M: Mammalian evolution and the interphotoreceptor
retin-oid binding protein (IRBP) gene: convincing evidence for sev-eral supraordinal clades. J Mol Evol 1996, 43:83-92.
22. Reyes A, Gissi C, Catzeflis F, Nevo E, Pesole G, Saccone C:
Congru-ent mammalian trees from mitochondrial and nuclear genes using Bayesian methods. Mol Biol Evol 2004, 21:397-403.
23. Lessa EP, Cook JA: The molecular phylogenetics of Tuco-tucos
(genus Ctenomys, Rodentia: Octodontidae) suggests an early burst of speciation. Mol Phylogenet Evol 1998, 9:88-99.
24. Lara MC, Patton JL, Da Silva MNF: The simultaneous
diversifica-tion of south american Echimyid rodents (Hystricognathi) based on complete cytochrome b sequences. Mol Phylogenet Evol 1996, 5:403-413.
25. Engel SR, Hogan KM, Taylor JF, Davis SK: Molecular systematics
and paleobiogeography of the South American sigmodon-tine rodents. Mol Biol Evol 1998, 15:35-49.
26. Leite YLR, Patton JL: Evolution of South American spiny rats
(Rodentia, Echimyidae): the star-phylogeny hypothesis revis-ited. Mol Phylogenet Evol 2002, 25:455-464.
27. Halanych KM, Robinson TJ: Multiple substitutions affect the
phy-logenetic utility of cytochrome b and 12S rDNA data: Exam-ining a rapid radiation in leporid (Lagomorpha) evolution. J Mol Evol 1999, 48:369-379.
28. Galewski T, Mauffrey J-F, Leite YLR, Patton JL, Douzery EJP:
Eco-morphological diversification among South American spiny rats (Rodentia; Echimyidae): a phylogenetic and chronologi-cal approach. Mol Phylogenet Evol 2005, 34:601-615.
29. Koepfli K-P, Wayne RK: Type I STS markers are more
inform-ative than cytochrome b in phylogenetic reconstruction of the Mustelidae (Mammalia: Carnivora). Syst Biol 2003, 52:571-593.
30. Steppan SJ, Storz BL, Hoffmann RS: Nuclear DNA phylogeny of
the squirrels (Mammalia: Rodentia) and the evolution of arboreality from c-myc and RAG1. Mol Phylogenet Evol 2004, 30:703-719.
31. Gaines CA, Hare MP, Beck SE, Rosenbaum HC: Nuclear markers
confirm taxonomic status and relationships among highly endangered and closely related right whale species. Proc R Soc Lond B 2005, 272:533-542.
32. Willows-Munro S, Robinson TJ, Matthee CA: Utility of nuclear
DNA intron markers at lower taxonomic levels: Phyloge-netic resolution among nine Tragelaphus spp. Mol Phylogenet Evol 2005, 35:624-636.
33. Musser GG, Carleton MD: Superfamily Muroidea. In Mammal
species of the world a taxonomic and geographic reference Edited by:
Wil-son DE, Reeder DM. Baltimore: Johns Hopkins University Press; 2005:894-1531.
34. Conroy CJ, Cook JA: MtDNA evidence for repeated pulses of
speciation within Arvicoline and Murid rodents. J Mam Evol
1999, 6:221-245.
35. Conroy CJ, Cook JA: Phylogeography of a post-glacial
colo-nizer: Microtus longicaudus (Rodentia: Muridae). Mol Ecol
2000, 9:165-175.
36. Jaarola M, Martinkova N, Gündüz I, Brunhoff C, Zima J, Nadachowski
A, Amori G, Bulatova NS, Chondropoulos B, Fraguedakis-Tsolis S, et
al.: Molecular phylogeny of the speciose vole genus Microtus (Arvicolinae, Rodentia) inferred from mitochondrial DNA sequences. Mol Phylogenet Evol 2004, 33:647-663.
37. Chaline J, Graf JD: Phylogeny of the Arvicolidae (Rodentia):
Biochemical and paleontological evidence. J Mamm 1988, 69:22-33.
38. Chaline J, Brunet-Lecomte P, Montuire S, Viriot L, Courant F:
Anat-omy of the arvicoline radiation (Rodentia): palaeogeograph-ical, palaeoeocological history and evolutionary data. Ann Zool Fenn 1999, 36:239-267.
39. Huelsenbeck JP, Rannala B, Masly JP: Accomodating phylogenetic
uncertainty in evolutionary studies. Science 2000, 288:2349-2350.
40. Sullivan J, Swofford DL: Should we use model-based methods
for phylogenetic inference when we know that assumptions about among-site rate variation and nucleotide substitution pattern are violated? Syst Biol 2001, 50:723-729.
41. Swofford DL, Waddell PJ, Huelsenbeck JP, Foster PG, Lewis PO,