Plasma Science and Fusion Center Massachusetts Institute of Technology
Cambridge MA 02139 USA
This work was supported by the U.S. Department of Energy, Grant No.
DE-FC02-99ER54512. Reproduction, translation, publication, use and disposal, in whole or in part, by or for the United States government is permitted.
PSFC/RR-05-11 DOE-ET-54512-354
.
Alcator C-Mod FY2005 Level-1 OFES Science
Target Completion Report: “Measure Plasma
Behavior with All-Metal Walls and Input Power
Greater than 3.5 MW”
Yijun Lin, P. Bonoli, C. Fiore, M. Greenwald, I. Hutchinson, J. Irby, B. LaBombard, B. Lipschultz, E. Marmar, M. Reinke, J. Rice, S. Scott*, J. Terry, R. Vieira, S. Wolfe, D. Whyte**, S. Wukitch, Alcator Team
* Princeton Plasma Physics Laboratory **University of Wisconsin, Madison.
Alcator C-Mod FY2005 Level-1 OFES Science
Target Completion Report: “Measure Plasma
Behavior with All-Metal Walls and Input Power
Greater than 3.5 MW”
Yijun Lin, P. Bonoli, C. Fiore, M. Greenwald, I. Hutchinson, J. Irby, B.
LaBombard, B. Lipschultz, E. Marmar, M. Reinke, J. Rice, S. Scott,
§J.
Terry, R. Vieira, S. Wolfe, D. Whyte,
∗S. Wukitch, Alcator Team, MIT
Plasma Science and Fusion Center.
Abstract
This report documents the results of experiments and analysis on the operations of
Alcator C-Mod during the Fiscal Year 2005 campaign to study the effects of removing all boron-nitride protection limiters and cleaning all metal surfaces as thoroughly as possible to return the machine to conditions with all-metal plasma facing components. ICRF antenna performance, heating efficiency, disruption hardiness, plasma cleanliness, impurity and hydrogen isotope dynamics, and the effects of boronization on the cleaned surfaces were all investigated. These studies were focused on a programmatic research milestone which was completed with the submission of this report in September, 2005 to the Office of Fusion Energy Sciences, US Department of Energy.
Contents
1. Alcator C-Mod FY05 OFES level-1 science target 3
2. Experimental resources and runs dedicated to the target 3
3. Preparations for the target study 4
4. ICRF antennas performance and disruption hardness 6
5. Effect of boronization on an all-metal machine 8
6. H/D level and ICRF D(H) minority heating efficiency 16
7. Hydrogenic isotopes retention on an all metal wall 23
8. Summary 24
Acknowledgement 24
References 24
§ Princeton Plasma Physics Laboratory
1. Alcator C-Mod FY05 OFES level-1 science target
Measure plasma behavior with high-Z antenna guards and input power greater than 3.5 MW.
“This FY2005 science target addresses issues related to first wall choices, and the trade-offs between low-Z and high-Z materials. This choice can affect many important aspects of tokamak operation, including: impurity content and radiation losses from the plasma; hydrogen isotope content in the plasma and retention in the walls; disruption hardiness of device components. All of these issues are significant when considering choices for next step devices to study burning plasma physics, especially ITER. Definitive
experimental results will be compared to model predictions, and will be documented in a Target Completion Report in September 2005.”
The target was completed on September 20, 2005. All four quarterly milestones have
been completed. All science topics requested by the target have been addressed, and significant scientific results have been obtained through the studies leading to the target completion. Experiments have shown that the ICRF antennas with high-Z antenna guards have similar power and voltage handling capabilities to those envisioned by the ITER ICRF antennas. We also find that a properly conditioned wall, using boronization in C-Mod, is essential to attain best performance plasmas in an all-metal tokamak by lowering the impurity level. New boronization techniques, such as between-shot boronization and glow-discharge boronization have been explored. The H/D level has been better
controlled in the all-metal configuration, which may partly account for a possible enhancement of ICRF absorption.
2. Experimental resources and runs dedicated to the target
Significant research resources and runs were dedicated to this level 1 science target study in the FY05 experimental campaign (Table 1). The primary mini-proposal was MP417 ‘Plasma performance, boronization and ICRF heating effectiveness with high-Z antenna guards and all metal surface’ (Y. Lin et al). A total of 15 experimental run days were dedicated to this MP. The major results from the work of this MP included that
boronization was necessary in C-Mod to obtain the best performance plasmas, and the ICRF antennas with all metal antenna guards had power and voltage handling capabilities similar to those previously with boron nitride (BN) tiles. Following MP417, we had MP430 ‘Localization of the effect of boronization’ (B. Lipschultz et al), with a total of 6 run days allocated. In this part of the study, we found that between-shot boronization (electron cyclotron resonance gas breakdown) could achieve the same effect as over-night boronization in terms of plasma performance, except that the effectiveness did not last as long. We also identified the most effective location of the EC resonance for
MP419 and MP348. In total, the studies leading to the completion of the level-1 science target made up more than a third of all physics research runs. Essentially all members of the Alcator C-Mod research team, including collaborators, have participated in the target research. For instance, Dr. Dennis Whyte of University of Wisconsin proposed MP 412 on the improvement of H to D changeover, and carried out the experiments.
MP# Title First Author Run(s)
417 Plasma performance, boronization and ICRF heating effectiveness with high-Z antenna guards and all metal surface
Y. Lin 15
430 Localization of the effect of boronization B. Lipschultz 6 412 Improved hydrogen-to-deuterium changeover
using radiative terminations and disruptions
D. Whyte 2
419 Fiducial wall pumping measurements for comparing operating conditions
B. Lipschultz 4 414 Divertor conditioning with Li pellets in near
double-null discharges
E. Marmar 1
348 Initial tests of the boron injector J. Irby 2
Table 1 Mini-proposals and runs for the level 1 science target research in FY 2005.
3. Preparations for the target study
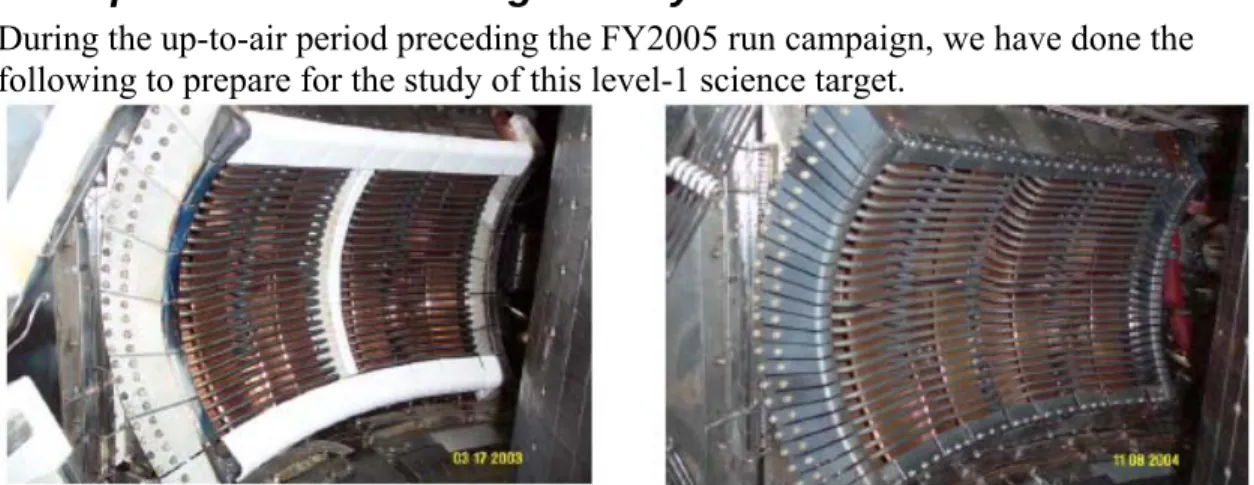
During the up-to-air period preceding the FY2005 run campaign, we have done the following to prepare for the study of this level-1 science target.
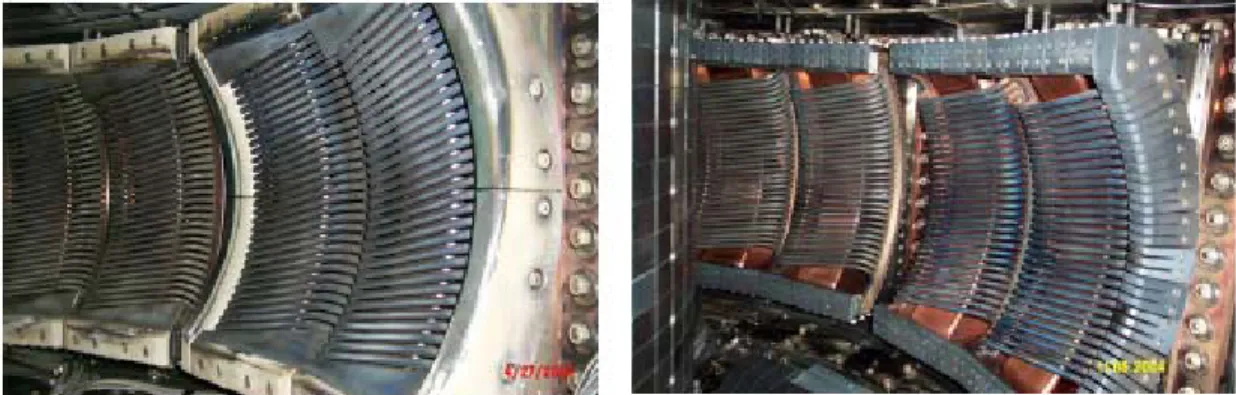
Figure 2 D and E antennas before and after BN tiles removal
ICRF antenna preparation:
• Replaced all boron-nitride protection tiles on the 4-strap J-port ICRF antenna with molybdenum protection tiles, and removed the boron-nitride septum from the J-port antenna (Figure 1)
• Replaced all boron-nitride protection tiles and septum on the D- and E-port dipole ICRF antennas with molybdenum protection tiles (Figure 2)
Tokamak preparation:
• All in-vessel surfaces were vacuumed to remove boron, boron nitride,
molybdenum, and other forms of dust. Surfaces beneath the divertor modules were also vacuumed. All material > 2 µm in size was collected and analyzed for size distribution and composition.
• 160 tile modules, mostly on the inner wall and ceiling, were removed from the machine and ultrasonically cleaned to remove boron, boron nitride, and other deposits
• All inner and outer divertor tiles were wiped down in-situ to remove boron, boron nitride, and other deposits
• All other in-vessel surfaces, including outboard limiters, vessel stainless steel walls, and cable trays were wiped down to remove as much boron, boron nitride, and other deposits as could be practically done.
In addition, the following activities were also completed, removing additional boron-nitride structures, and returning all plasma-facing components to clean metallic conditions:
• Removed all boron-nitride from the active MHD antennas
• Installed molybdenum protection limiters for the Lower Hybrid Launcher • Removed boron nitride insulators from all emissive probes
After these preparations, the Alcator C-Mod tokamak became a genuine all-metal tokamak, with all metal plasma facing components. This all-metal condition provided opportunities to address important ITER relevant issues called upon by the target, such as the plasma behavior with high-Z antenna guards, boronization and hydrogen isotope retention on an all-metal wall.
4. ICRF antennas performance and disruption hardiness
In this campaign, the ICRF antennas with Mo protection tiles have been shown to have the same power and voltage handling capabilities as with BN tiles. Moreover, the Mo protection tiles are shown to be more mechanically robust to disruptions than BN tiles. Boron nitride, a chalk like dielectric material, was introduced into the C-Mod vessel beginning in CY 2000. In the place of the original molybdenum tiles on the ICRF
antennas, we installed protection limiters using BN tiles, after Mo tile/plasma interactions were shown to be a serious limiting phenomenon for antenna performance by producing sparks. Although the BN tiles reduced the sparking, along field line arcing was observed in J-antenna (Figure 3). A BN septum was installed on the J antenna to break the RF sheath potential on the metal surfaces, and arcs along magnetic field lines were
eliminated. Later, it was also found that BN/metal interfaces being exposed to the plasma were prone to melting from ion bombardment, due to a locally enhanced sheath potential. With improved BN tile design, this problem was eliminated. As a result, the BN tiles plus BN septum enhanced the antenna power and voltage handling capabilities in comparison to the original all Mo design. However, BN tiles are mechanically fragile, and high current plasma disruptions caused BN tile fractures in all campaigns with BN in the vessel (Figure 4). In some cases, large fractured tile fragments fell into the divertor, and degraded plasma performance.
Figure 3 Arcs along the field lines between two BN/metal interfaces before the installation of a BN septum in the year 2000 campaign.
In this campaign, the ICRF antennas with Mo protection tiles have been shown to have the same power and voltage handling capabilities as with BN tiles (Figure 5). Mo tiles are more robust to disruptions than BN tiles as seen from the fact that no damage was found on any Mo antenna protection tiles during the open-to-air in May, nor during the recent open-to-air in September (Figure 6), after a number of high current plasma disruptions. The antennas (D, E, and J) together were able to routinely provide > 5 MW power. In the FY05 campaign, we also ran the J antenna at different frequencies, antenna phases (heating and current drive), species (D(H) and D(3He)), heating scenarios (minority heating, mode conversion heating), and also dipole configuration using the middle two straps. The J antenna ran well in all these configurations. Second harmonic H minority heating was also successfully performed using the E port antenna. Impurity injections from the antennas were no worse than that with BN tiles in the last campaign, but much less than in the original J antenna with Mo tiles.
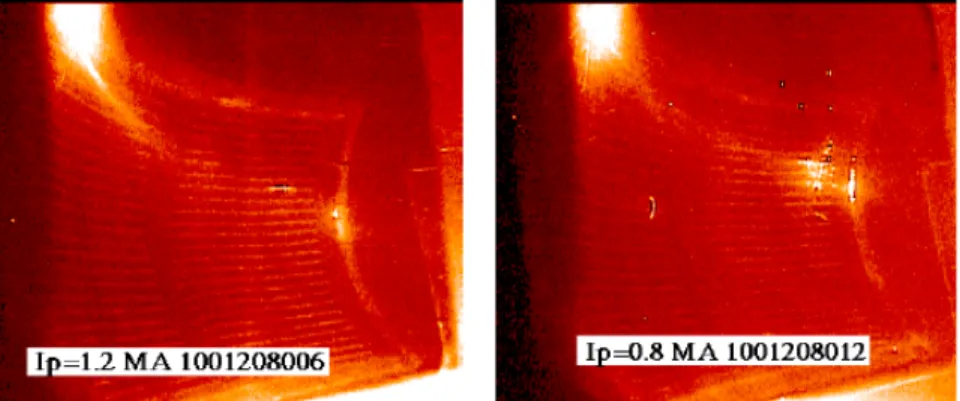
Figure 5 Visible camera views of the D antenna at 1.3 MW (left) and the J antenna at 2.7 MW (right) in H-mode. Most plasma/antenna interactions were benign and did not cause large injections/plasma disruptions or significant density rise (some bright spots are reflections).
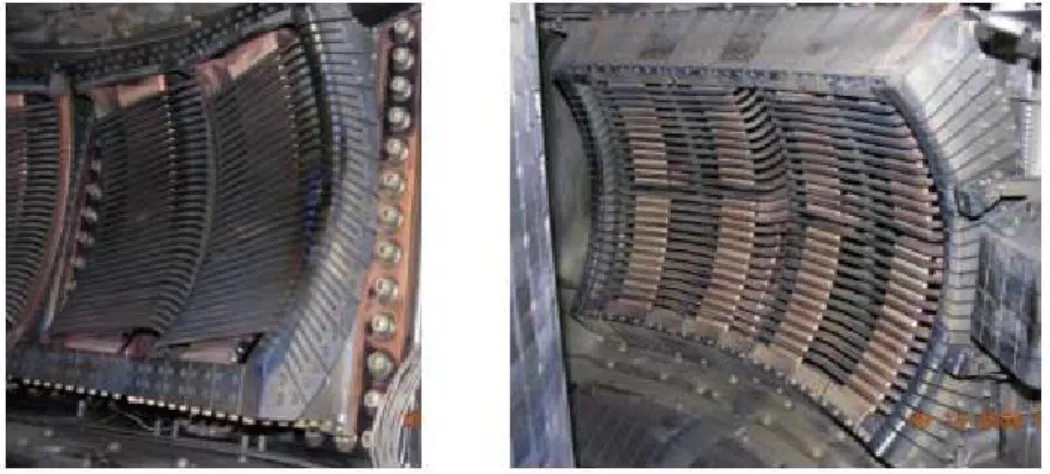
Figure 6 E antenna (left) and J antenna (right) views in recent open-to-air survey in September. No Mo protection tiles were found damaged.
Since the D and E antennas originally ran reasonably well in the campaigns from 1996-1999 with Mo tiles, the good behavior of these two antennas after the BN to Mo changeover was not unexpected. On the other hand, J-port is much better in this campaign than the first campaign after it was installed (1999), when the original Mo protection tiles were used. Since then, many problems on the original J-antenna have been fixed iteratively (Ref. [1]), including rotating the feeding strips to have E⊥B, modifying the locations where E//B so that the E field is <10 kV/cm (an empirical threshold obtained from C-Mod and other tokamak experiments), and shortening the vacuum transmission line to improve handling of neutral pressure in the antenna box (prior to the FY05 campaign). As mentioned earlier, BN tiles and septum were used to help reduce RF sheath potential and eliminate arcs. The good behavior of the J antenna with Mo tiles and without a septum in this campaign was a surprise to us in the
beginning. After carefully comparing the detailed antenna structure, we found the major reason for the good performance may be due to the fact that the present top/bottom Mo tiles are a recessed by several mm, and they are thus in the shadow of the antenna side tiles (R = 91.3 cm), while all antenna structures are in the shadow of outboard poloidal limiters (R = 90.5 cm). In contrast, the top/bottom Mo tile surfaces were further protruding to the plasma than the side tiles during the 1999-2000 campaigns. Since the plasma density decays exponentially in the limiter shadow with an e-folding length of about 1 mm, this small recess lowered the plasma density in front of the top/bottom Mo tiles below a critical density, above which avalanche behavior of Mo impurities through sputtering may occur (Refs. [2, 3]). Such a change also smooths out the local heat load and eliminates hot spots on tiles. The good antenna performance in this campaign indicates that a septum might be unnecessary for future C-Mod antenna operation. The physics behind this issue is being investigated.
In summary, ICRF antennas with all metal protection limiters in C-Mod have been shown to have the same power and voltage handling capabilities as that of BN limiters. They are more robust, in terms of disruption hardness, than with BN protection tiles.
5. Effect of boronization on an all-metal machine
High-Z metallic plasma facing components have low tritium retention compared to carbon, while maintaining high heat flux handling capability, and robustness to erosion.. Therefore, high-Z materials are seriously considered for ITER PFCs. However, since high-Z impurities can cause significant radiation energy loss from the plasma, we need to evaluate the plasma behavior with an all-metal machine and also seek remedies on the issue of radiation loss.
The plasma behavior with Mo PFCs, for both ohmic and ICRF heated discharges, was carefully documented at the beginning of the FY05 campaign. Typical plasmas had H89~0.8 in L-mode, and H89~1.0, Prad/Ptot > 60% in H-mode. The major radiation source was found to be Mo. This sub-par performance in both L and H-modes suggested that the all-metal wall must be properly conditioned to reduce impurity influx. Before attempting the first boronization, known to improve plasma performance in C-Mod, we tried some novel techniques on wall conditioning, including Li pellet injection into double-null
plasmas, and injection of boron particles into plasmas. Neither technique produced measurable improvement on plasma performance.
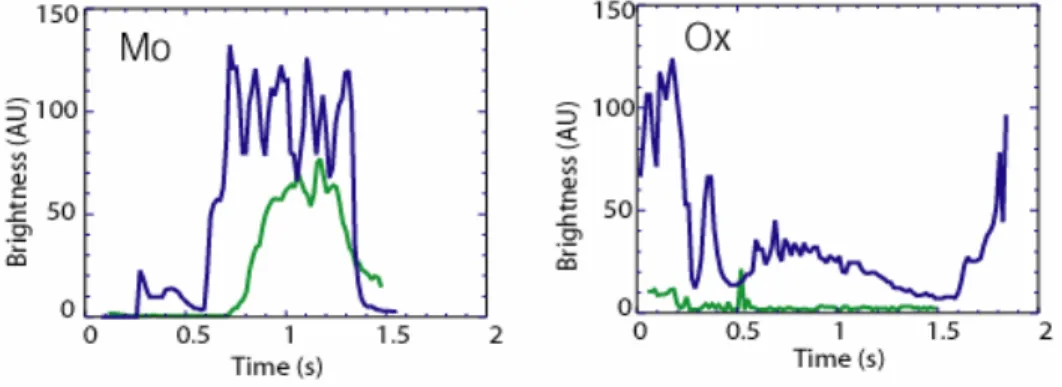
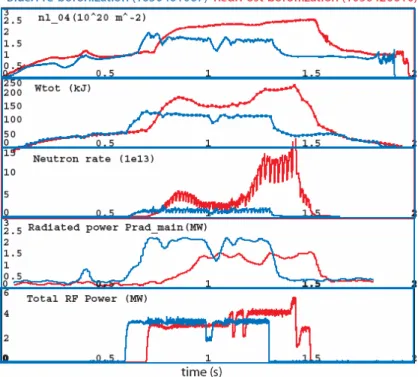
The first boronization was performed on April 20, after more than 2 months of plasma operation. Most boronizations in this campaign were done using a mixture of 90% helium and 10% deuterated diborane (B2D6) and with electron cyclotron resonance (2.45 GHz magnetron) discharge to break down the gas. The EC resonance positions were varied to study the effect of localized boronization. We also compared the effectiveness of 50% duty cycle (1 Hz modulation) and 100% duty cycle of the magnetron. Gas with a different diborane concentration, having 20% B2D6 and 80% helium, was used in some of the boronizations late in the campaign. After the first boronization (R = 0.54-0.92 m, overnight), the molybdenum and oxygen levels in plasma were significantly reduced (Figure 7). The Mo level was down by a factor of 2 after the first boronization, and down another factor of 2-10 after the 2nd boronization. The oxygen level was down by a factor more than 10 after the first boronization. Because of this significant reduction of impurity level, the radiated power is also lowered dramatically. In Figure 8, two plasmas with similar RF power traces are compared. The improvement in the plasma performance, as seen from total stored energy Wtot, and neutron rate, is clearly correlated to the reduction of Prad, measured by bolometry. This result is similar to previously reported in Refs. [4, 5].
Figure 8 Comparison of two discharges pre-boronization and post-boronization.
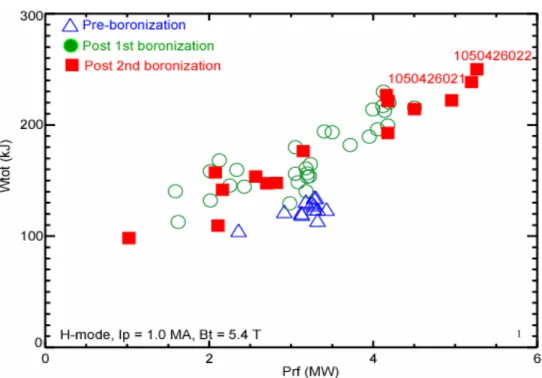
The total stored energy at the same RF power was increased significantly compared to the pre-boronization plasmas (Figure 9). In this figure, we plotted the stored energy vs. input RF power, and compare H-modes pre-boronization and post-boronization. At 3 MW RF power, Wtot were less than 110 kJ pre-boronization for these 1 MA, 5.4 T plasmas. After boronization, Wtot were mostly greater than 150 kJ. On run 1050426, after the 2nd
boronization (R=0.52 to1.02 m, overnight), we obtained plasmas with record stored energy in C-Mod, and also the world tokamak record in volume averaged pressure of <P> = 1.8 atm, at the ITER values of toroidal field (5.3 tesla) and normalized β, βN = 1.73 (Figure 10).
Figure 9 Comparison of the plasma performance pre- and post-boronization.
Figure 10 The plasma discharge with the new world tokamak record of volume average pressure <P> = 1.8 atm. Plasma current Ip = 1 MA and toroidal field Bt = 5.4 T. Also note that there was only one
trip in the RF trace for power up to 5 MW, caused by a monster sawtooth crash.
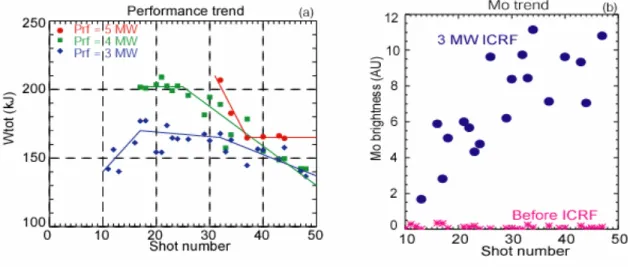
The effectiveness of the boron layer deposited by the overnight boronization is degraded to pre-boronization levels after about 20-30 high RF power shots (or equivalently after ~50 MJ RF energy deposited). On 1050610, an extended run, plasmas with same target plasma parameters and the same RF power were produced to evaluate the duration of the boronization. The trend of plasma performance vs. shots and total RF energy is shown in
Figure 11-(a). It is clearly shown that the plasma performance in terms of Wtot started degrading after about shot 30, while the Mo level in the plasma increased shot by shot (Figure 11-(b)). The general trend and duration of the boronization is similar to that of the 03-04 campaign (Figure 12), when BN tiles were used as the antenna guards and a thick boron layer was already present on a major part of the Mo surfaces. This comparison suggests that the boron layers at most locations do not contribute to the performance enhancement; applying a thin B coating over the Mo in high B erosion regions is likely the most important effect. One other conclusion is that the BN tile surfaces on the antenna must not have had significant effect on the plasma performance, since they were covered with a thick boron layer based on tile analysis.
Figure 11 (a) Plasma performance peaks at about 20 shots after a boronization. The effectiveness of boronization became lost after ~ 30 shots, or ~50 MJ RF power deposited. (b) Mo levels rises shot by shot.
Figure 12 Comparison of plasma performance post-boronization in different years. Although we had higher peak performance this campaign, the up-and-down trend is similar.
This short duration of boronization effectiveness prompted us to look at more economical and/or more efficient boronization techniques. The Mo tile analysis prior to this
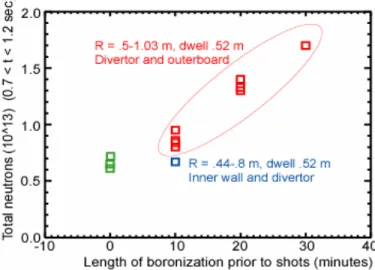
campaign found that the thickness of the boron layer in-vessel was very uneven. The layer was thickest on the inner wall tiles and upper divertor (up to 10 µm), whereas tiles near or in the outer divertor have the thinnest boron layer (≤ 1 µm). This finding indicates that not all locations are equal, and possibly boronizing the locations where the boron erosion was the strongest will be the best. To investigate this hypothesis, we carried out studies on between-shot boronization at various locations. Figure 13 shows the result of such a study on run 1050705. The boronization done over inner wall and divertor seemed to have insignificant effect on the plasma performance. Boronization from the divertor to the outboard structures did improve the plasma, and also the longer boronization created the better plasmas, evidenced by the total neutrons. The improvement of the plasma performance in H-mode is closely anti-correlated to the initial rate of rise of the radiated power following the transition from L to H mode (Figure 14). The slower the rise of Prad, the more neutrons were produced, and the stored energy in the plasmas also
increased.These short duration boronizations were effective for 1-2 subsequent plasmas.
Figure 13 Between shot boronization showed that a longer period of boronization at the divertor and outerboard structures created better plasmas
Figure 14 H-mode performance vs. the rate of rise of the radiated power just after entering H-mode.
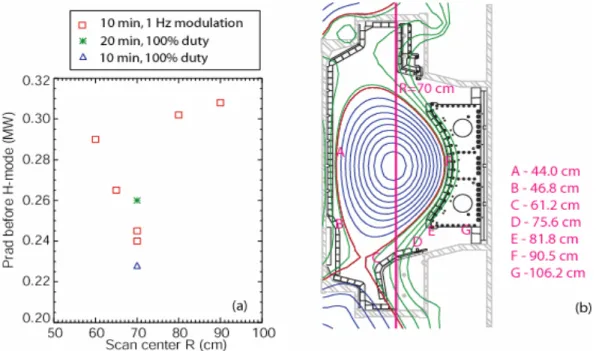
In Figure 15(a), we compare the effects of boronizations with different EC resonance location sweeps. The radiated power before the L-H transition, another indicator of plasma H-mode performance, was plotted vs. location. We found that 10 minute
boronizations, with 100% duty cycle of the magnetron, and EC resonance scanned over R = 65-75 cm produced the best plasma in terms of minimizing Prad. This location
corresponds to the upper-gusset and lower floor tiles. The detailed physics behind this observation is still under study, and it will be part of the presentations by B. Lipschultz and E. Marmar at the coming APS-DPP meeting (Denver, October 2005).
Figure 15 a)Prad was reduced the most after boronization done near R = 70 cm with 10 minutes 100%
duty cycle (constant). b) Poloidal cross-section showing a typical plasma equilibrium, and the major radius locations of various in-vessel structures; the EC resonance is a cylinder at constant R, scanned in time by varying the current in the toroidal field magnet.
In standard EC boronization, the diborane molecules are broken down by collisions with moderate-energy electrons (Te ~ 10 eV). This breakdown mechanism may be less
efficient than glow discharge, where ion collision is the major mechanism. In this campaign, we also studied the glow discharge boronization at different pressure/current. The result is summarized in Figure 16. To our surprise, glow discharge boronization did not enhance plasma performance as much as EC boronization. The plasmas after glow discharge boronization, at least with the parameters we tried, are at best only slightly better than the un-boronized plasma. A possible explanation is that glow discharge may have been depleting the boron layer faster than it is formed. Operating at lower currents and voltages may have been the proper way to go rather than higher ones we tried. As we have seen previously, glow is very effective at unloading the walls of deuterium and making previous boronizations ineffective. EC boronization may provide more localized deposition of the boron, while the glow tends to deposit boron throughout the vessel. Finally, glow may do sufficient sputtering of metals to negate the positive effects of the boron.
Figure 16 Glow discharge boronization is worse than EC discharge (50/70/103) boronization in terms of plasma performance.
In summary, proper boronization is necessary to obtain the best performance tokamak plasmas in C-Mod. Boronization is most effective with the EC resonance scanned over the region of R = 60-75 cm. Radiated power is significantly reduced compared to the pre-boronization level. Lowering Prad has been shown to be a necessary condition for good plasma performance.
6. H/D level and ICRF D(H) minority heating efficiency
The significant plasma performance enhancement reported in Section 5 can explain most short-period variation of plasma performance within each campaign. However, there is another long-term trend in the C-Mod performance history that cannot be satisfactorily explained by boronization alone, since boronizations were done, sometimes frequently, in each campaign starting in 1996. To show this long term trend, in Figure 17, we plot the amount of RF power needed to produce plasmas with maximum stored energy between 160 and 180 kJ at 1 MA, using D(H) minority ICRF heating. An upward trend exists after year 2000, and peaking for the 2004 campaign. The data points from the current 2005 campaign clearly show a reverse of the trend, back to a level similar to pre-2000
campaigns. This finding indicates that there must be a secondary, but secular, issue that affects the plasma performance. As discussed in the following, this other issue may be the effect of the H/D level on ICRF heating efficiency.
Figure 17 The amount of ICRF power required to obtain 160 <Wtot < 180 kJ vs. campaigns. Data
from 1050524 to 1050609 are excluded because of titanium contamination. The machine was first boronized in January, 1996.
In Figure 18, we plot the H/(H+D) ratio vs. the years of the same plasma discharges shown in Figure 17 since the 1999 campaign. The ratio is obtained from the ratio of Hα and Dα line intensities near the plasma edge. As shown in the figure, right after the introduction of significant quantities of BN (side tiles, top/bottom tiles and septa) into the vessel, the H/D level became systematically higher in both the ohmic and RF heated parts of discharges. The H/D level also rose during the RF pulse as seen from Figure 18-(c). An earlier study in C-Mod (Ref. [7]) showed that the optimal H/D level was at about 5%, while a rather steep drop-off of the RF heating/plasma performance was observed at H/D > 6% experimentally. Another study prior to 1999 using neutral particle analyzer data showed lower sensitivity of the performance vs H/D level. There was no over-lapping
time period for these two diagnostics. Since the wall condition of the 96-98 period was closer to the current 2005 campaign than to the 03-04 campaign, we believe that the H/D level was also well under control in the pre-2000 campaigns.
Figure 18 H/(H+D) trends over run campaigns for the discharges in Figure 17. (a) H/(H+D) at the time of max stored energy; (b) H/( H+D) 50 ms before the RF pulse; (c) The difference between H/(H+D) at max Wtot and before the RF. Typical error bars on the individual measurements are
about ±0.5%.
In Figure 19, we compare the two discharges with the highest Wtot in campaigns 2005 and 03-04 respectively. Overnight boronization was carried out prior to both run days. Shot 1040212023 had rather high Wtot despite a relatively high radiated power. The H/D level, constant in 1050422026, was rising steadily from 4% to 8% during the RF pulse in shot 1040212023. This rise of H/D was typical in the 03-04 campaign. Such behavior indicated that hydrogen was released when the wall is heated, suggesting a less optimized wall with a large H reservoir. If the higher H/D level (>%6) does lower the RF
absorption, a vicious cycle might happen: some RF power is lost to directly heat the near surface on the wall, causing increased hydrogen release, and then more RF power is lost to heating the wall. This may help to explain the low Wtot of the 2nd and 3rd H-modes on this shot.
Figure 19 Comparison of the highest stored energy shots from the 03-04 campaign and 2005 campaign. The level and evolution of H/D are different.
The ICRF heating efficiency is difficult to measure directly or to calculate. One way to measure this quantity is by estimating the break-in-slope of stored energy during RF turn-offs in H-modes. For this purpose, high time-resolution EFIT calculations were done around the time of an RF turn-off during H-mode. Assuming other powers, like ohmic power and radiated power, do not change instantaneously, the change of the slope of the stored energy divided by the rf power, ∆(dW/dt)/∆Prf, gives an estimate of the RF heating efficiency. Since this calculation has large uncertainties (equivalent to the 2nd derivative of the EFIT reconstructed stored energy), it is only meaningful when a large number of data points are present. In Figure 20, we show the trend of efficiency over campaigns. Only cases with steady or slightly rising Wtot before the RF turn-offs (0.05 < dW/dt/Prf < 0.2) are plotted. The data of each campaign are generally Gaussian distributed, but with large standard deviation. The average value of campaign 2005 has an approximately 30% increase over that of campaign 2003-2004, a definite reversal of the downward trend since 2002. And the average value in 2005 is close to those of 96-01.
Figure 20 The trend of RF heating efficiency for discharges having Prf > 2 MW, Wtot > 100 kJ,
H-mode, central D(H) minority heating. Only campaigns having significant numbers of points are shown. Blue filled circles are the average, and the green bars are the standard deviation. Major events are also labeled.
Over a large range of plasma parameters in C-Mod, modeling indicates that the single-pass absorption of the fast wave should be excellent for D(H) minority at H/D level from 4% to 8%. However, in high density H-modes, the difference can be significant. In Figure 21(a), we calculated the energetic particle spectrum for H/D at 4%, 6% and 8%, under assumptions of RF power density of 20 MW/m3, ne = 4×10²⁰m-3, and Te = 3 keV. The average tail energy ranges from 20 keV to 10 keV, and the corresponding single pass absorption coefficient varies significantly from 66% to 39% as shown in Figure 21(b). This high sensitivity of single pass absorption to the H/D level suggests that the H/D level may play a key role in high-density plasmas. Also note that at higher tail energy, e.g., higher power density or lower electron density, the single pass absorption
coefficients are expected to be at a level ~ 80% for all three H/D levels as shown in Figure 21(b). The total RF absorption, by considering multi-passes, is generally higher than the calculated single-pass absorption. Only when the parasitic absorption is at a value significant to the single-pass absorption, the total absorption would be affected. Realistic models properly treating all types of parasitic absorption mechanisms are not available at present. In Figure 22, we use the post-1999 data from Figure 20, but separate them into two sets at different density ranges, and plot them vs. H/D levels. It seems less likely to have high RF absorption at high density (ne0 > 4×10²⁰m-3) and high H/D levels (>6%). Dedicated experiments with the H/D level as the only variable, e.g., puffing H2 into repeatable high-density H-mode plasmas produced by between-shot boronization, may help clarify this issue.
Figure 21 (a) the energetic tail at different H/D level calculated using the Stix formula at 20 MW/m3 power density, ne = 4×10²⁰ m-3, Te = 3 keV, for three H/D levels, 4%, 6% and 8%. (b) Single pass
Figure 22 RF efficiency vs. H/D level at two density ranges.
One plausible explanation for the long trend of H/D is that the boron layers on the in-vessel Mo tiles (and BN tiles) were getting thicker and thicker in years. The BN tiles, if not sufficiently baked, could also be a source of hydrogen. The thick boron layer, and possibly the bulk BN tiles, may have slowed the processes reducing the H/D level since year 2000. The preparation of the tokamak back to all-metal surface in this campaign reversed the trend. In Figure 23(a), we compare the trend of H/D in the 2003-04, with that of the 2005 campaign. The curve of 1999 was also drawn, when no BN material was present and the residual boron layer was also cleaned prior to the campaign. The H/D level is the average level from 0.5 to 1.5 sec for typical plasmas. As shown in the plot, in the 2005 and 1999 campaigns, H/D reached the optimal level more quickly than in the 03-04 campaign. Although the first boronizations in 2005 and 1999 were done at two very different times, the long-term trends of H/D level are similar. In contrast, in the 03-04 campaign, we had the first boronization at about shot 200 in this figure. Evidently, these early boronizations did not expedite the H/D changeover process, and the H/D level came back as soon as the fresh boron layer was worn out (like wall-paper covering a badly prepared wall). The average H/D levels after the first boronization (roughly the beginning of physics studies) in the 1999 and 2005 campaigns are at ~ 4% whereas in 03-04, the value is at ~6%. The long-term trend of H/D level in a campaign is more likely determined by the initial wall condition at pump-down. This initial condition may differ dramatically in different campaigns. Evidence is shown in Figure 23(b), where the torus pressure is plotted as a function of campaign after 100 minutes pump-down for the first evacuation following manned entry. The pump-down speed in the 03-04 campaign (also 01 and 02 campaigns) was significantly slower than the others, which would indicate more H2O adsorption on the wall, presumably due to thick boron layers (also labeled in the figure). This may also be an indication of more H absorption in the wall, thus more conditioning in the run campaign was required to lower the H/D level. A better-prepared in-vessel wall before pump-down, for instance, removing the residual boron layer, may be a key to shorten the conditioning period in future campaigns.
Figure 23 (a) The H/D trends in three campaigns. Short open-to-air periods within a campaign are not shown in the curves. (b) Torus vacuum pressure after 100 minutes pump-down at the beginning of each campaign. The three campaigns shown in (a) are labeled in (b).
We have also carried out experiments to expedite H to D changeover using planned major disruptions. Gas analysis is obtained with closed pump valves using a differentially pumped RGA. The hydrogen is recovered almost entirely in the form of molecular HD rather than H2 indicating the important role of isotope exchange in wall. Figure 24 shows the correlation of the H/(H+D) level in the recovered gas and that in plasma. This
correlation confirms that wall fuelling and disruption recovery are “sampling” similar gas reservoirs in the near surface of walls. The difference of the two run days, 1050211 and 1050408, indicates that the walls had been depleted after about two months of plasma operation. On shot 1050211018, Wtot = 30 kJ, Te =2 keV, with D2 injection of 13 Torr-L, we had total gas recovered of 35 Torr-L, of which H accounts for 19 Torr-L. In a similar plasma shot on 1050408, we had total gas recovery 10 Torr-L including 1 Torr-L H. Although eventually we can get the H to D changeover after a long period of plasma operation, expediting the process using planned disruptions may save operation time.
Figure 24 H/(H+D) from the gas recovered from planned disruption and H/(H+D) in plasma are clearly correlated.
7. Hydrogenic isotope retention on an all metal wall
For ITER, the issue of tritium retention is very important because of the availibility of tritium and site limits. Metal wall machines are thought to have less retention of hydrogenic isotopes than carbon machines (Ref. [6]).
Typical C-Mod plasmas show net wall pumping of the puffed gas. Fiducial shots before the first boronization showed about 7 Torr-L wall pumping, with about 50% gas pumped after a regular shot. This is different after a fresh boronization. Figure 25 shows the evolution of the wall pumping and the midplane neutral pressure before RF pulses in a run day after boronization. At the beginning of the run day, the wall starts by releasing D2 to the plasma as shown by the difference of gas puffed and gas pumped, a quantity
corresponding to how much D2 is retained in the walls. The neutral pressure was also high to begin with, and then it dropped steadily shot by shot. Usually it takes 10-20 shots for the wall to go from being a net source to being a net sink. This wall condition
evolution might also be one of the reasons that the plasma performance is not optimized immediately after an overnight boronization. Since the ICRF antennas also have
operational problems at high neutral pressure, it is still unclear whether the slow-rise of performance immediately after a boronization (see Figure 12) is due to the wall condition evolution or just fewer RF trips along the way. More experiments will be needed to further investigate this issue.
Figure 25 Neutral pressure trend and wall releasing/pumping trend after an overnight boronization.
The long-term retention of hydrogenic isotopes on the wall will be obtained through post-run sample tiles analysis. Sample tiles have been taken out of the tokamak and sent to D. Whyte of University of Wisconsin for further analysis. The results will be compared with those from previous campaigns.
8. Summary
In summary, this level one science target has been completed with great success. This study has enhanced the general understanding of plasma performance, impurities, ICRF absorption, and wall conditioning in an all-metal machine, which will be important for ITER wall material selection and plasma operation. The study showed that high-Z wall and high-Z antenna guards seem to be beneficial for hydrogen isotope retention, and resulted in no degradation of ICRF antenna performance. A well-prepared wall to reduce H reservoir before a campaign may be a key to control H/D level during the campaign. To obtain best performance plasmas, boronization is essential in Alcator C-Mod. This result suggests that proper wall conditioning techniques will need to be addressed for ITER.
The experimental results of this study will be presented at the coming 47th APS-DPP annual meeting, including an invited talk (B. Lipschultz), two oral presentations (E. Marmar and I. Hutchinson) and one poster (Y. Lin). Several peer-reviewed journal publications are expected based on this study. Part of the work has been reported at ITPA meetings (B. Lipschultz). Because of its significance to the magnetically confined fusion community, especially to ITER, we anticipate the results will also be presented at the 21st IAEA Fusion Energy Conference and the 17th International Conference on Plasma Surface Interaction in Controlled Fusion Devices (PSI) in 2006.
Acknowledgement
This work is supported by U.S. DoE Office of Fusion Energy Sciences.
References
[1] S. J. Wukitch et al, Plasma Phys. Control. Fusion 46(9), 1479(2004).
[2] D. I’Ippolito, J. R. Myra, B. Bures and J. Jacquinot, Plasma Phys. Control. Fusion
33(6), 607(1991).
[3] J-M. Nortedame and G. Oost, Plasma Phys. Control. Fusion 35, 1481(1993). [4] B. Lipschultz, D. A. Pappas et al, Nuclear Fusion 41(5), 585(2001).
[5] M. Greenwald et al, Nuclear Fusion 37(6), 793(1997). [6] ITER Physics Basis, Nuclear Fusion 39(12), 2577(1999).
[7] T. E. Tutt, E. Marmar et al, APS Bulletin 44(7), 206(1999), KP1 48. Also T. E. Tutt, MIT Master’s thesis (1999) http://psfcwww2.psfc.mit.edu/library/99rr/99rr011/99rr011_abs.html.