HAL Id: hal-02361141
https://hal.archives-ouvertes.fr/hal-02361141
Submitted on 15 Nov 2019HAL is a multi-disciplinary open access archive for the deposit and dissemination of sci-entific research documents, whether they are pub-lished or not. The documents may come from teaching and research institutions in France or abroad, or from public or private research centers.
L’archive ouverte pluridisciplinaire HAL, est destinée au dépôt et à la diffusion de documents scientifiques de niveau recherche, publiés ou non, émanant des établissements d’enseignement et de recherche français ou étrangers, des laboratoires publics ou privés.
CORIGAN: Assessing multiple species and interactions
within images
Paul Tresson, William Puech, Philippe Tixier, Leïla Bagny Beilhe, Sacha
Roudine, Christine Pages, Dominique Carval
To cite this version:
Paul Tresson, William Puech, Philippe Tixier, Leïla Bagny Beilhe, Sacha Roudine, et al.. CORIGAN: Assessing multiple species and interactions within images. Methods in Ecology and Evolution, Wiley, 2019, 00, pp.1 - 6. �10.1111/2041-210X.13281�. �hal-02361141�
HAL Id: hal-02361141
https://hal.archives-ouvertes.fr/hal-02361141
Submitted on 15 Nov 2019HAL is a multi-disciplinary open access archive for the deposit and dissemination of sci-entific research documents, whether they are pub-lished or not. The documents may come from teaching and research institutions in France or
L’archive ouverte pluridisciplinaire HAL, est destinée au dépôt et à la diffusion de documents scientifiques de niveau recherche, publiés ou non, émanant des établissements d’enseignement et de recherche français ou étrangers, des laboratoires
CORIGAN: Assessing multiple species and interactions
within images
Philippe Tixier, Leïla Bagny Beilhe, Paul Tresson, Phillippe Tixier, William
Puech, Leïla Bagny Beihlhe, Sacha Roudine, Christine Pages, Dominique
Carval
To cite this version:
Philippe Tixier, Leïla Bagny Beilhe, Paul Tresson, Phillippe Tixier, William Puech, et al.. CORIGAN: Assessing multiple species and interactions within images. Methods in Ecology and Evolution, Wiley, 2019, 00, pp.1 - 6. �10.1111/2041-210X.13281�. �hal-02361141�
CORIGAN : Assessing multiple species and
interactions within images
Authors:
Paul Tresson 1,2,3, Phillippe Tixier 1,2, William Puech 3, Leïla Bagny Beil
h
e 4,5, SachaRoudine 4,5, Christine Pagès 4,5, Dominique Carval 1,2
1 - CIRAD, UR GECO, Montpellier, France
2 - GECO, Univ Montpellier, CIRAD, Montpellier, France
3 - LIRMM, Univ Montpellier, CNRS, Montpellier, France
4 - CIRAD, UR Bioagresseurs, Montpellier, France
5 - Bioagresseurs, Univ Montpellier, CIRAD, Montpellier, France
Running headline:
Assessing species interactions within imagesNumber of words:
3098 (incl. Title, tables, captions)Corresponding author:
Dominique Carval [email protected] 1 2 3 4 5 6 7 8 9 10 11 12 13 14 15 16 17Abstract
1. Images are resourceful data for ecologists and can provide a more complete information than other methods to study biodiversity and the interactions between species. Automated image analysis however often relies on extensive datasets, not implementable by small research teams. We are here proposing an object detection method that allows the analysis of high-resolution images containing many animals interacting in a small dataset.
2. We developed an image analysis pipeline named ‘CORIGAN’ to extract the characteristics of the community. CORIGAN is based on the YOLOv3 model as the core of image detection. To illustrate potential applications, we use images collected during a sentinel prey experiment.
3. Our pipeline can be used to detect, count and study the physical
interactions between various animals. On our example dataset, the model reaches 86.6% precision and 88.9% recall at the species level or even at the caste level for ants. The training set required fewer than 10 h of labelling. Based on the pipeline output it was possible to build the trophic and non-trophic interactions network describing the studied community. 4. CORIGAN relies on generic properties of the detected animals and can be
used for a wide range of studies and supports. Here, we study
invertebrates on high-resolution images, but the same processing can be transferred for the study of larger animals on satellite or aircraft images.
Keywords:
Image processing, Animal detection, Interaction study,Convolutional Neural Network, Trophic networks, Sentinel prey study, On-field image 18 19 20 21 22 23 24 25 26 27 28 29 30 31 32 33 34 35 36 37 38 39 40 41 42
1. Introduction
Understanding the functioning of ecosystems depends on accurate information on biodiversity, species behaviour, trophic and non-trophic interactions, and other ecosystem properties. Such information can be very useful for biodiversity conservation, invasive species monitoring, and biological pest control (Reid et al. 2005).
However, classical methods used to sample biodiversity or to identify the behaviours of species are often either time consuming, information-poor, or expensive. Depending on thestudied species and objectives of the studies, these methods include direct observation, the use of trap cameras, Barber traps, sentinel prey, or satellite images for instance. Among these methods, camera observations have several advantages and present few biases. For the study of arthropods with sentinel preys, Grieshop et al. (2012) demonstrate the
usefulness of the collected data and mentioned as only limits of this techniques the small sampling window of a camera and the time investment needed for image analysis. In fact, ecologists and biologists are therefore increasingly using automated methods to analyse images (Pimm et al. 2015).
To date, one of the most developed applications of computer vision in ecology is the identification of species (Wäldchen, Mäder & Cooper 2018; Weinstein 2018). In comparison with species identification, the counting of objects and the
describing of animal behaviours and interactions are less developed applications of computer vision in ecology (Weinstein 2018). Furthermore, the existing
methods to identify, count, or describe animals are often designed for specific uses and rely on extensive datasets and citizen science initiatives (Norouzzadeh et al. 2018; Willi et al. 2018).
43 44 45 46 47 48 49 50 51 52 53 54 55 56 57 58 59 60 61 62 63 64 65 66 67
In the current manuscript, we describe the CORIGAN pipeline that uses object detection to identify and locate numerous small objects in high-resolution images and uses these detections to compute information about species interactions. We illustrate how CORIGAN can be applied on a small custom dataset of images of invertebrate communities from a sentinel prey experiment in a tropical
agrosystem.
2. Materials and methods
2.1. Overview
2.1.1.Image and detection processing
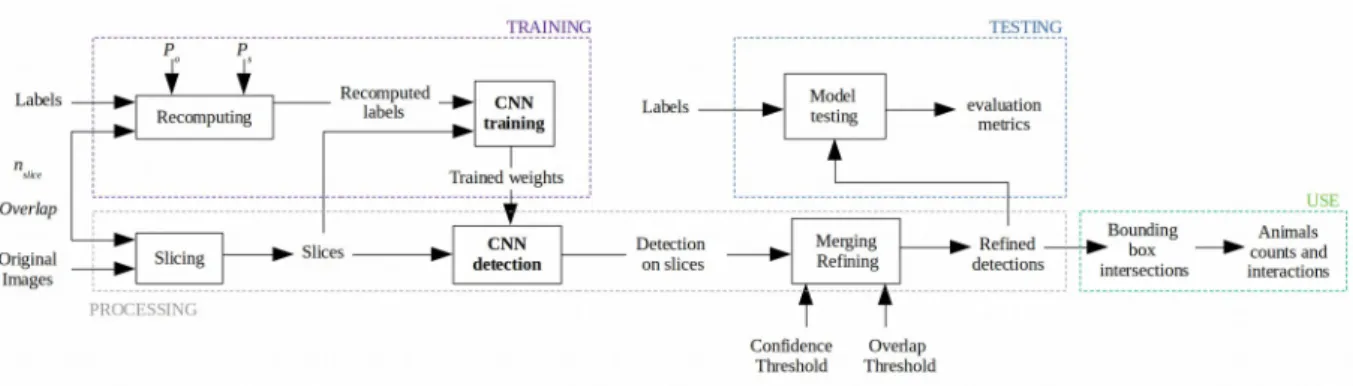
We use the YOLOv3 Convolutional Neural Network (CNN) (Redmon et al. 2018) as core of our image-processing pipeline. This model outputs the bounding box coordinates of the objects it recognizes on an input image. As this model is best fit for small images featuring large objects, we have developed an
image-processing pipeline inspired from satellite images analysis methods (Van Etten, 2018) to be able to work with high-resolution images featuring numerous small objects. The image-processing is summarized in Fig. 1 and details on image labelling, processing and CNN training are presented in Supplementary Material 1. Images are first sliced into nslices x nslices pixel slices with a given overlap to reduce the risk of an object being cut in non-identifiable parts.
For model training, ground truth labels of the train dataset are recomputed within each slice referential with Pobject and Pslice parameters to handle how small and large labels will be recomputed. The CNN is then trained on this new dataset. Here, we have performed data augmentation as Redmon et al. (2018) and payed particular attention to overfitting, given the size of our example dataset.
68 69 70 71 72 73 74 75 76 77 78 79 80 81 82 83 84 85 86 87 88 89 90 91
For model testing, detection is performed on slices using trained model weights and a separate test dataset. These detections are then merged back together within the referential of the original image. The overlap of the slicing may
generate duplicates and a refining of the detections with Overlap Threshold (OT) and Confidence Threshold (CT) parameters is performed to suppress duplicates. Refined detections are then compared with ground truth to assess the
performances of the model. Detected and ground truth bounding boxes are compared using Intersection over Union (IoU), which is the ratio between the area of intersection and the area of union of two bounding boxes. An IoU of 1 indicates that the detected box and ground truth box overlap perfectly. Detections are accepted as True Positive (TP) if IoU > 0.5 and if the detected class is correct. Otherwise, the detection is considered as False Positives (FP). As well, duplicates are considered as FP. If a ground truth object is missed, it is considered as False Negative (FN). Overall performances are assessed with precision, recall and F1-score.
precision=
TP
TP+ FP
recall=
TP
TP+ FN
F 1=
2 × precision× recall
precision+recall
For each class, the Average Precision (AP) is computed as the area under the precision-recall curve. AP is used to compare performances between classes.
Once the model shows acceptable performances and the best processing
parameters determined, the pipeline can be used to study interactions between animals. 92 93 94 95 96 97 98 99 100 101 102 103 104 105 106 107 108 109 110 111 112 113 114
2.1.2.Interactions
Since we observe animals on a 2D surface, we can thus use the intersection of bounding boxes to detect physical interactions between two individuals. There may be intersections of bounding boxes without real physical contact but the intersection of bounding boxes ensures that animals are within very close range to each other. We chose to consider this as a physical interaction, as this means that at least one of the participants of the interaction is willing to engage physical contact with the other.
To provide further nuances, interactions may be characterized depending on the known or observed behaviour of a species towards another. In our example, interactions between predators and prey are labelled as predation if the prey is alive and scavenging if the prey is already dead at the beginning of the
experiment. Interactions between two predators of different species are labelled as competition, whereas interactions between two predators of the same social species are labelled as cooperation. Finally, animals whose behaviour towards others where not clearly identified are labelled as undefined. Moreover, the number of individuals of a predator species interacting with a prey on an image is counted, providing information about the predator unit investment needed for the capture of a prey during a predation event. All results are exported in csv dataframes. R scripts are provided for analysis and production of graphics.
2.2. Example dataset
To illustrate how CORIGAN can assess multiple species and interactions within images, we have conducted sentinel prey experiments, using eggs and dead or alive adults of Cosmopolites sordidus and larvae of Metamasius sp. as prey under the camera. 115 116 117 118 119 120 121 122 123 124 125 126 127 128 129 130 131 132 133 134 135 136 137 138 139
Detailed protocol is presented in Supplementary Material 2. These experiments have produced 1240 images of 3000x 4000 pixels and we have used 95 images as training dataset, 95 different images as test dataset and 1191 to study invertebrate interactions. Training and test dataset feature 4087 invertebrates belonging to 24 classes: these include 21 species and morphospecies; three ant species are further labelled to caste level (minor or major workers). For the sake of clarity, results are here presented with these classes summarized into seven super-classes (ant, cockroach, weevil, spider, larva, egg, slug) but see Table 1 in Supplementary Material 3 for complete results on all classes. An output example for a test image of this dataset is shown Figure 2.
3. Results
3.1. Network performance
Given our dataset, we choose nslice = 416 pixels and an overlap of 0.2. Each original image then generates 108 slices. Labels are kept for Pobject = 0.4 and Pimage = 0.5. We choosed an OT of 0.4.and a CT of 0.2. Details on the choice of values of these parameters are provided in Supplementary Material 1.
Given our hardware (detailed in Supplementary Material 1), training on 95
images (corresponding to 10 260 slices) required about 24 h. Tests on 93 original images (meaning 10 044 slices) required < 5 min. The presented state of the network shows maximal test performance and a test loss to training loss ratio of 1.01.
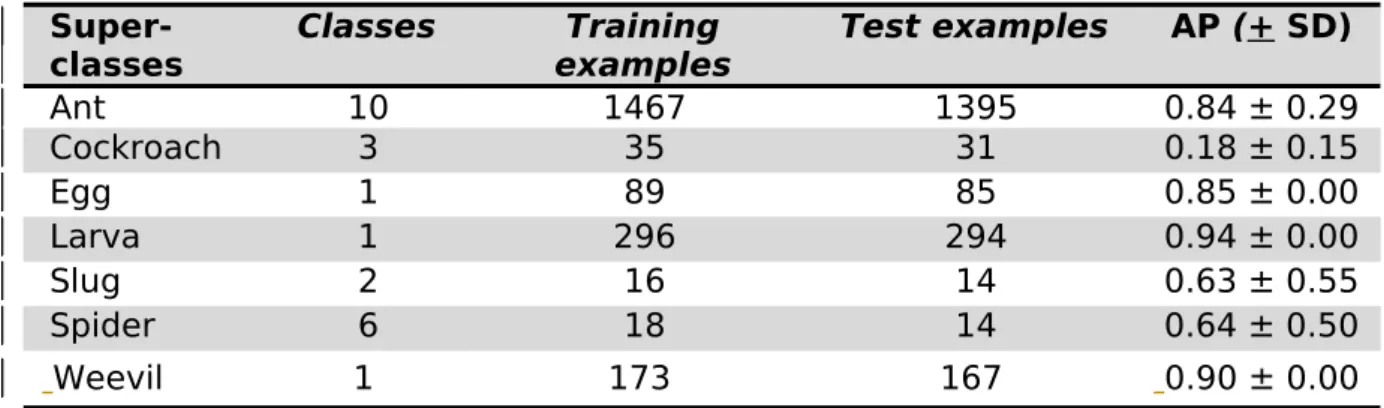
The model had a precision of 86.6%, a recall of 88.9%, and an F1-score of 87.8% on detailed classes. If classes are summarized into super-classes, precision, recall, and F1 increased to 89.6%, 91.2%, and 90.4% respectively. AP for the different super-classes are shown on Table 1.
140 141 142 143 144 145 146 147 148 149 150 151 152 153 154 155 156 157 158 159 160 161 162 163 164
3.2. Interaction analysis
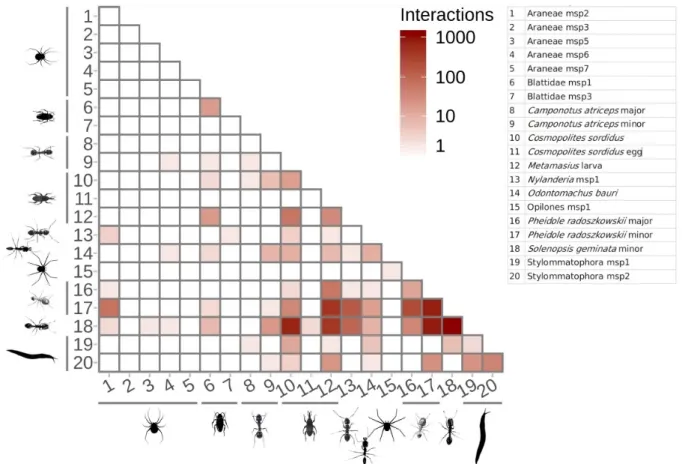
All interactions between animals are displayed on Figure 3. Such a matrix can be used to show the importance of intra-specific interactions. For instance, our example shows numerous intraspecific interactions for the ants Pheidole
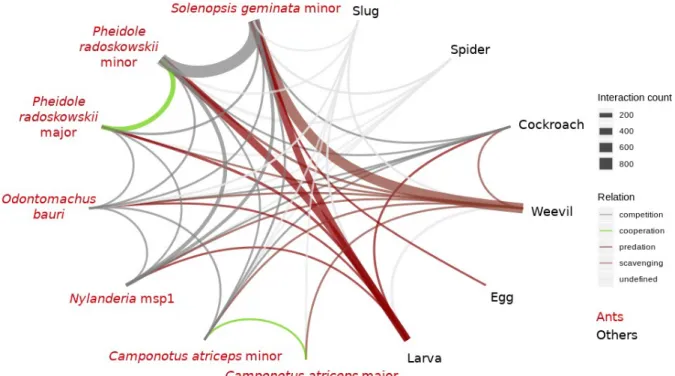
radozkowskii and Solenopsis geminata. Interspecific interactions can be shown as an interaction network and qualified given the participants of the interaction (Fig. 4).
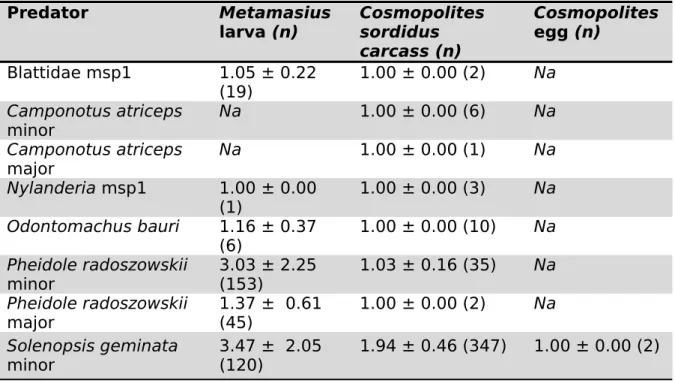
The number of predators interacting with a prey on an image are shown on Table 2. For example, smaller ants (e.g. P. radoszkowskii, S. geminata) need to invest more individuals for the capture of one prey than larger ants (e.g.
Odontomachus bauri)
4. Discussion
4.1. Time investment to apply the method
For our example, labelling (train and test datasets) took 12h of human work. This time can as well be reduced with the use of active learning methods(Qiu et al. 2016). Using our method, with accurate knowledge of the imaged species, a dataset achieving 90% precision requires less than a day of work and is applicable by small research teams working on custom datasets.
4.2. Interaction and predation definition
In the current research, we assessed interactions between two individuals as the overlapping of bounding boxes. A source of error while studying interactions is the confusion between species of similar size and general morphology. The high number of interactions between P. radoszkowskii and S. geminata, for example, was an artefact mostly due to confusion between the two classes. In images 165 166 167 168 169 170 171 172 173 174 175 176 177 178 179 180 181 182 183 184 185 186 187 188
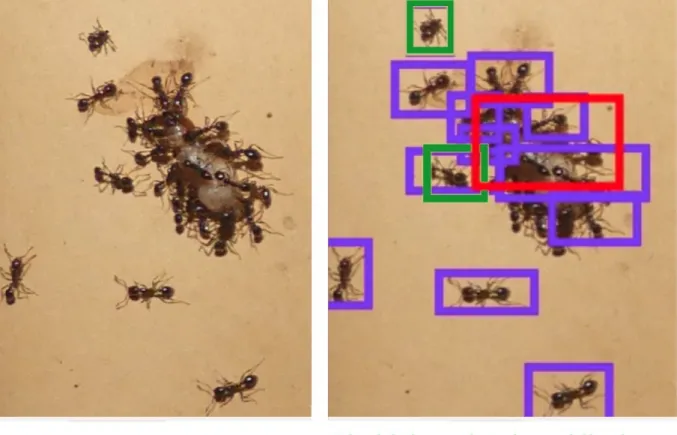
displaying an S. geminata attack on Metamasius larvae, 1050 of 9436 S. geminata were also incorrectly detected as P. radoszkowskii, resulting in the generation of false positives. These confusions mostly occur in complex, crowded scenes, which are difficult to assess even for a human observer (see Figure 5).
4.3. Robustness of the method
One problem facing deep-learning methods, especially with small datasets, is overfitting. Here, despite the limited amount of training data, our model was not overfitted, as indicated by the test loss to training loss ratio and the test
performances. Our model is robust partly as a consequence of the slicing of the original image. With the slicing of original images, the model does not learn directly from the original images but from the slices after pre-processing (with our example parameters, this means a 108 times larger dataset). Furthermore, a vast majority of the slices show background that provides various details and shapes at a precise level (branches, soil particles, etc.) that could have been confounded with invertebrates. These details are learned by the model and reduce possible confusion. This effect could be associated with hard negative mining, which has been a successful strategy to improve neural network performance (e.g. Ogier Du Terrail & Jurie 2017; Sun, Wu & Hoi 2018). Data augmentation is also important for ensuring robustness (Godfellow et al., 2016), particularly with small datasets. Performances and robustness of the model depends on the dataset but the use of high-resolution images and slicing ensures a relative robustness even for small datasets.
4.4. Further improvements
To reduce the risk of false positives and false negatives (especially when dealing with unknown species), hierarchical classification approaches could be
developed. These methods are a known technique to improve model 189 190 191 192 193 194 195 196 197 198 199 200 201 202 203 204 205 206 207 208 209 210 211 212 213 214
generalisation and have been shown relevant for handling biological data (Redmon & Farhadi 2016; Colonna, Gama & Nakamura 2018).
In our example dataset, images were taken with short time steps and are not independent, leading to a possible bias in the frequency of interactions. This bias could be overcome by the tracking of individuals over multiple images (e.g. see Romerro-Ferrero et al. 2019).
5. Acknowledgements
This work was supported by the French National Research Agency under the Investments for the Future Program, referred as ANR-16-CONV-0004. The Ph.D. thesis of P. Tresson was funded by CIRAD and #DigitAg grants.
6. Author contributions
Pa.T., D.C., Ph.T., and W.P. conceived of research idea. Pa.T. implemented and evaluated the methods and led the writing of the manuscript. D.C. and S.R. conducted the field study. D.C., C.P., and Pa.T. contributed to the labeling task. L.B.B. initiated the project. All authors contributed critically to the drafts and gave final approval for publication.
7. Data accessibility
[Code is available on Github]
[Dataset will be available online on CIRAD Dataverse https://dataverse.cirad.fr/] 215 216 217 218 219 220 221 222 223 224 225 226 227 228 229 230 231 232 233
8. References
Colonna, J.G., Gama, J. & Nakamura, E.F. (2018) A comparison of
hierarchicalmulti-output recognition approaches for anuran classification. Machine Learning, 107, 21.
Goodfellow, I., Bengio, Y. & Courville, A. (2016) Deep Learning. MIT Press. Grieshop, M.J., Werling, B., Buehrer, K., Perrone, J., Isaacs, R. & Doug, L. (2012)
Big Brother is Watching: Studying Insect Predation in the Age of Digital Surveillance. American Entomologist, 58, 11.
Norouzzadeh, M.S., Nguyen, A., Kosmala, M., Swanson, A., Palmer, M.S., Packer, C. & Clune, J. (2018) Automatically identifying, counting, and describing wild animals in camera-trap images with deep learning. Proc Natl Acad Sci U S A, 115, E5716-E5725.
Ogier Du Terrail, J. & Jurie, F. (2017) On the use of Deep Neural Networks for the detection of small vehicles in ortho-images. IEEE International Conference on Image Processing. Beijing, China.
Pimm, S.L., Alibhai, S., Bergl, R., Dehgan, A., Giri, C., Jewell, Z., Joppa, L., Kays, R. & Loarie, S. (2015) Emerging Technologies to Conserve Biodiversity.
Trends Ecol Evol, 30, 685-696.
Qiu, J., Wu, Q., Ding, G., Xu, Y., Feng, S. (2016) A survey of machine learning for big data processing. Eurasip Journal on Advances in Signal Processing. 67. doi:10.1186/s13634-016-0355-x.
Redmon, J. & Farhadi, A. (2016) YOLO9000: Better, Faster, Stronger. pp. 9. ArXiv e-prints.
Redmon, J. & Farhadi, A. (2018) YOLOv3: An Incremental Improvement. pp. 6. ArXiv e-prints.
Reid, W.V., Mooney, H.A., Cropper, A., Doris Capistrano, Carpenter, S.R., Chopra, K., Dasgupta, P., Dietz, T., Duraiappah, A.K., Hassan, R., Kasperson, R., 234 235 236 237 238 239 240 241 242 243 244 245 246 247 248 249 250 251 252 253 254 255 256 257 258 259 260
Leemans, R., May, R.M., McMichael, T.A.J., Pingali, P., Samper, C., Scholes, R., Watson, R.T., Zakri, A.H., Shidong, Z., Ash, N.J., Elena Bennett, Kumar, P., J. Lee, M., Raudsepp-Hearne, C., Simons, H., Thonell, J. & Zurek, M.B. (2005) Millenium Ecosystem Assessment Ecosystems and Human Well-being Synthesis, pp. 155. World Resources Institute, Washington, D.C. Romerro-Ferrero, F., Bergomi, M. G., Hinz R. C., Heras, F. J. H., Polavieja, G. G.
(2019) idtracker.ai: tracking all individuals in small or large collectives of unmarked animals. Nature Methods, 16, 179–182.
Sun, X., Wu, P. & Hoi, S.C.H. (2018) Face detection using deep learning: An improved faster RCNN approach. Neurocomputing, 299, 42-50.
Van Etten, A. (2018) Satellite Imagery Multiscale Rapid detection with Windowed Networks. pp. 8. arXiv e-prints.
Wäldchen, J., Mäder, P. & Cooper, N. (2018) Machine learning for image based species identification. Methods in Ecology and Evolution, 9, 2216-2225. Weinstein, B.G. (2018) A computer vision for animal ecology. J Anim Ecol, 87,
533-545.
Willi, M., Pitman, R.T., Cardoso, A.W., Locke, C., Swanson, A., Boyer, A., Veldthuis, M., Fortson, L. & Gaggiotti, O. (2018) Identifying animal species in camera trap images using deep learning and citizen science. Methods in Ecology and Evolution, 10, 80-91. 261 262 263 264 265 266 267 268 269 270 271 272 273 274 275 276 277 278 279 280 281
Table 1. AP per super-classes. This underlines a limitation of the use of deep learning with small datasets, as class imbalance can lead to poor performances on rare classes. See Table 1 in Supplementary Material 3 for detailed results on all classes.
Super-classes Classes examplesTraining Test examples AP (+ SD)
Ant 10 1467 1395 0.84 ± 0.29 Cockroach 3 35 31 0.18 ± 0.15 Egg 1 89 85 0.85 ± 0.00 Larva 1 296 294 0.94 ± 0.00 Slug 2 16 14 0.63 ± 0.55 Spider 6 18 14 0.64 ± 0.50 Weevil 1 173 167 0.90 ± 0.00 282 283 284 285 286 287
Table 2. Mean (+ SD) numbers of predators surrounding an individual sentinel prey (± standard variation) as detected by automated image analysis. The values in parentheses (n) are the number of predation events recorded between the two species. msp = morphospecies, and Na indicates cases where predator was not detected in interaction with the prey.
Predator Metamasius
larva (n) Cosmopolites sordidus carcass (n) Cosmopolites egg (n) Blattidae msp1 1.05 ± 0.22 (19) 1.00 ± 0.00 (2) Na Camponotus atriceps minor Na 1.00 ± 0.00 (6) Na Camponotus atriceps major Na 1.00 ± 0.00 (1) Na Nylanderia msp1 1.00 ± 0.00 (1) 1.00 ± 0.00 (3) Na Odontomachus bauri 1.16 ± 0.37 (6) 1.00 ± 0.00 (10) Na Pheidole radoszowskii minor 3.03 ± 2.25 (153) 1.03 ± 0.16 (35) Na Pheidole radoszowskii major 1.37 ± 0.61 (45) 1.00 ± 0.00 (2) Na Solenopsis geminata minor 3.47 ± 2.05 (120) 1.94 ± 0.46 (347) 1.00 ± 0.00 (2) 288 289 290 291 292 293 294
Figure 1. Overview of the proposed method. 295
296 297
Figure 2. Output of the pipeline for an image of the test dataset. Values on x and y axes are pixel coordinates.
298 299
Figure 3. Interaction matrix showing interactions on our example dataset. 301
Figure 4. Trophic and non-trophic interaction network between species of the observed community.
303 304 305
Figure 5. Example of complex situation leading to misclassifications, FP and FN. Some minor worker of Solenepsis geminata were confused with minor worker of Pheidole radoszkowskii, another species of the Myrmicinae subfamily and of similar size.
306 307 308 309