HAL Id: hal-00304092
https://hal.archives-ouvertes.fr/hal-00304092
Submitted on 14 Apr 2008HAL is a multi-disciplinary open access
archive for the deposit and dissemination of sci-entific research documents, whether they are pub-lished or not. The documents may come from teaching and research institutions in France or abroad, or from public or private research centers.
L’archive ouverte pluridisciplinaire HAL, est destinée au dépôt et à la diffusion de documents scientifiques de niveau recherche, publiés ou non, émanant des établissements d’enseignement et de recherche français ou étrangers, des laboratoires publics ou privés.
Effects of urban pollution on UV spectral irradiances
R. L. Mckenzie, C. Weinreis, P. V. Johnston, B. Liley, H. Shiona, M.
Kotkamp, D. Smale, N. Takegawa, Y. Kondo
To cite this version:
R. L. Mckenzie, C. Weinreis, P. V. Johnston, B. Liley, H. Shiona, et al.. Effects of urban pollution on UV spectral irradiances. Atmospheric Chemistry and Physics Discussions, European Geosciences Union, 2008, 8 (2), pp.7149-7188. �hal-00304092�
ACPD
8, 7149–7188, 2008 Effects of urban pollution on UV spectral irradiances R. L. McKenzie et al. Title Page Abstract Introduction Conclusions References Tables Figures ◭ ◮ ◭ ◮ Back CloseFull Screen / Esc
Printer-friendly Version Interactive Discussion
Atmos. Chem. Phys. Discuss., 8, 7149–7188, 2008 www.atmos-chem-phys-discuss.net/8/7149/2008/ © Author(s) 2008. This work is distributed under the Creative Commons Attribution 3.0 License.
Atmospheric Chemistry and Physics Discussions
Effects of urban pollution on UV spectral
irradiances
R. L. McKenzie1, C. Weinreis2, P. V. Johnston1, B. Liley1, H. Shiona1, M. Kotkamp1, D. Smale1, N. Takegawa3, and Y. Kondo3
1
NIWA Lauder, Central Otago, New Zealand
2
University of Hannover, Germany
3
University of Tokyo, Japan
Received: 18 February 2008 – Accepted: 12 March 2008 – Published: 14 April 2008 Correspondence to: R. L. McKenzie ([email protected])
ACPD
8, 7149–7188, 2008 Effects of urban pollution on UV spectral irradiances R. L. McKenzie et al. Title Page Abstract Introduction Conclusions References Tables Figures ◭ ◮ ◭ ◮ Back CloseFull Screen / Esc
Printer-friendly Version Interactive Discussion
Abstract
Spectral measurements of UV irradiances at Tokyo are compared with corresponding measurements at a pristine site (Lauder New Zealand) to identify the causes of the re-ductions in urban UV irradiances, and to quantify their effects. Tropospheric extinctions in Tokyo were found to be up to ∼40% greater than at Lauder. Most of these differences
5
can be explained by differences in cloud and aerosols, but ozone differences are also important in the summer. Examining spectral signatures of tropospheric transmission of both sites shows that reductions due to mean NO2and SO2amounts are generally
small. However, at times the amount of NO2 can be 20 times higher than the mean
amount, and on these days it can decrease the UV-A irradiance up to 50%. If SO2
10
shows comparable day to day variability, it would contribute to significant reductions in UV-B irradiances. The results indicate that at Tokyo, interactions between the larger burden of tropospheric ozone and aerosols also have a significant effect. These results have important implications for our ability to accurately retrieve surface UV irradiances at polluted sites from satellites that use backscattered UV. Supplementary data
char-15
acterising these boundary layer effects are probably needed.
1 Introduction
Previous studies have clearly demonstrated that UV irradiances at the surface are strongly influenced by tropospheric extinctions (Bais et al., 1993). These are thought to be significant contributors to the peak UV irradiances being approximately 40% higher
20
in NZ than at corresponding latitudes in the Northern Hemisphere (Seckmeyer and McKenzie, 1992; McKenzie et al., 2006).
It is difficult to measure aerosol extinctions accurately in the UV-B region. In the past it has been assumed that aerosol extinctions in the UV-B region can be estimated by simple extrapolation from their effects in the visible and UV-A regions. However,
25
ACPD
8, 7149–7188, 2008 Effects of urban pollution on UV spectral irradiances R. L. McKenzie et al. Title Page Abstract Introduction Conclusions References Tables Figures ◭ ◮ ◭ ◮ Back CloseFull Screen / Esc
Printer-friendly Version Interactive Discussion
For example, many organic aerosols have absorptions bands in this region, so the single scattering albedo of the aerosols may reduce markedly through the UV-B region (Jacobson, 1998).
An understanding of the causes of pollution effects is needed to improve estimates of geographical differences in UV, which are usually derived from satellite-borne
sen-5
sors that make use of solar UV radiation that is backscattered to the satellite sensor from the Earth’s atmosphere. These satellite borne sensors include NASA’s series of TOMS (Total Ozone Mapping Spectrometer), the SBUV instruments, and the more recent ozone monitoring instrument (OMI) on board the NASA EOS Aura satellite. Un-fortunately, the mean backscattering altitude is located several kilometres above the
10
Earth’s surface, so assumptions must be made about the radiative transfer through the lower troposphere, including the boundary layer which can be polluted, especially over heavily populated areas. Consequently, these satellite sensors show a significant positive bias at polluted locations, including Tokyo (Tanskanen et al., 2005).
The present study attempts to quantify pollution effects by comparing spectral UV
15
data from pristine and polluted locations.
2 Measurements
This study makes use of data from a well-calibrated UV spectrometer system which was deployed at a pristine site (Lauder, New Zealand) and a polluted site (Tokyo, Japan) for extended periods. The spectrometer system is the NIWA UV4 system which
20
meets the demanding criteria set by the Network for the Detection of Atmospheric Com-position Change (NDACC – formerly called the NDSC) (McKenzie et al., 1997; Wuttke et al., 2006). Instrument details are shown in Table 1. In normal operation the spec-trometer is programmed to measure spectral irradiances over the wavelength range 285–450 nm at 5-degree steps in solar zenith angle (SZA) for SZA<=95 degrees, as
25
well as at 15 min intervals over the midday period. One scan is also made at mid-night. During the measurement period at Tokyo, the frequency of daylight scans was
ACPD
8, 7149–7188, 2008 Effects of urban pollution on UV spectral irradiances R. L. McKenzie et al. Title Page Abstract Introduction Conclusions References Tables Figures ◭ ◮ ◭ ◮ Back CloseFull Screen / Esc
Printer-friendly Version Interactive Discussion
increased to once every 15 min.
Calibrations are traceable to NIST, and the usual measurement uncertainty with these systems is better than ±5%. However, subsequent analysis of the data from Tokyo revealed a problem caused by a build-up of pollution on the surface of the unpro-tected PTFE diffuser, which was designed for use in less polluted places. The operators
5
cleaned the diffuser at regular intervals, and before the stability calibration sequences, which were carried out at interval of approximately two weeks. This regime was later found to be inadequate, and cleaning with water was generally carried out several times per week from early January 2005. Even with these additions, it was still necessary to back correct data to take account of build-up of pollution on the diffusers. Fortunately,
10
another NIWA spectrometer system with a domed entrance optic designed to measure actinic flux was operating alongside the spectrometer in question for most of the year. Over some periods of each day, the scans were simultaneous, and we were able to use data from that instrument to check and back correct the measurements. Six periods were identified where increasing corrections were needed to account for this problem.
15
The correction factors needed were independent of wavelength and were well approx-imated by a linearly increasing correction over these periods. The largest reductions in throughput were ∼20%, and this correction procedure added an additional 5% to the overall calibration uncertainty. Over the summer periods (May through August) the diffuser was cleaned more regularly, and the maximum correction was 5%.
20
Each scan logged is an average of a forward scan and a reverse scan, where the total scan time is approximately 5 min. During the scan period, there can be significant changes in mean intensity due to changing cloud conditions. To recognise these oc-currences, some of the radiation arriving at the entrance slit is intercepted by a diode detector which is sensitive to UV-A radiation. At each wavelength sampled, this diode
25
signal is also recorded.
Details of the sites are summarised in Table 2, and a summary of irradiances and ozone amounts over these deployment periods is shown in Fig. 1.
ACPD
8, 7149–7188, 2008 Effects of urban pollution on UV spectral irradiances R. L. McKenzie et al. Title Page Abstract Introduction Conclusions References Tables Figures ◭ ◮ ◭ ◮ Back CloseFull Screen / Esc
Printer-friendly Version Interactive Discussion
than at Lauder, especially during the second summer of operation. In the UV-A re-gion (integral 315–400 nm, upper panel) the lower summertime values at Tokyo are attributable to the closer Sun-Earth separation in January compared with June (a 7% effect), and to differences in tropospheric pollution, which will be discussed later. In contrast to the summer differences, winter irradiances are larger at Tokyo. This
re-5
versal is partly due to a reversal in the Sun-Earth separation effect, but the longer atmospheric paths at Lauder’s higher latitude also become important, because of its larger SZAs in winter. These seasonal and geographic differences in UV-A radiation are amplified in UV-B radiation (280–315 nm), and therefore in erythemally-weighted irradiances (middle panel), which is more strongly scattered by air and aerosol, and is
10
additionally absorbed by ozone. There are large day-to-day and seasonal variabilities in ozone, with maxima in spring, and minima in autumn. In summer, ozone columns are larger over Tokyo (lower panel), whereas in winter they are similar at both sites.
A wide range of ancillary measurements are available at the Lauder NDACC site, in-cluding ozone and temperature profiles, and aerosol optical depth. It has been
demon-15
strated previously (Badosa et al., 2007) that aerosol extinctions there have a negligible effect on UV irradiances at this site. Unfortunately, no measurements of aerosol optical depth were available at the Tokyo site. However, it is likely that they will sometimes exceed 0.5 at wavelength 0.5 µm (Chin et al., 2004), and will therefore have apprecia-ble effects on UV irradiances. Profiles of ozone and temperature, which were availaapprecia-ble
20
from nearby Tsukuba, are representative of the Tokyo site.
3 Comparison of clear-sky days
We used the following procedure to identify the clearest summer day (least affected by clouds) at each site. First we restricted the data to days when ozone retrievals were made for scans taken at SZA<80◦, and for which the noise in the UV-A diode signal for
25
these scans is also less than 1%. This subset selected above was further filtered with an objective data-selection algorithm, which placed constraints on diurnal symmetry.
ACPD
8, 7149–7188, 2008 Effects of urban pollution on UV spectral irradiances R. L. McKenzie et al. Title Page Abstract Introduction Conclusions References Tables Figures ◭ ◮ ◭ ◮ Back CloseFull Screen / Esc
Printer-friendly Version Interactive Discussion
The following days, for which there were no turning points other than at noon, and for which the variance was a minimum, were selected:
Lauder, 21/12/2003, Day of Year =355, SZAmin= 21.6◦, ozone=295 DU
5
Tokyo, 04/07/2004, Day of Year=186, SZAmin= 12.8◦, ozone=307 DU
Measurements of UV irradiances and the calculated UV-A transmissions for Lauder and Tokyo are plotted, and compared as a function of SZA in Fig. 2 for these clear days. Despite this day being the clearest available for the Tokyo site there is still
sig-10
nificant asymmetry, with the higher irradiances and transmissions occurring during the afternoon. Even on this clearest day, the UV-A transmission at Tokyo is ∼10% lower than for Lauder, clearly demonstrating the larger effects of aerosol extinction.
The peak UV irradiances measured on the day selected at each site are close to the maximum valid values for the period. Over the period studied, the highest UVEry value
15
at Tokyo was 0.29 Wm−2 (corresponding to UVI=11.6), and the highest at Lauder was
0.32 Wm−2 (UVI=12.8).
4 Comparison of measured spectra
Because there were few cloudless days, the main analysis for this study compares data from the entire period at Tokyo with data from the period November 2002 to May 2004 at
20
Lauder. By examining the wavelength dependence of the differences we can attribute the causes of the differences, and estimate the contributions from each contributing factor. To avoid effects of intensity changes during the scans, we initially used our criterion for an ozone retrieval; SZA<80◦, and noise in the UV-A diode signal less than 5%. We then examined further restriction of the analysis to scans where the standard
25
deviation of the slit diode signal described above was less than 1% of its mean value. This latter criterion reduced the number of scans included to 65% of that with the initial
ACPD
8, 7149–7188, 2008 Effects of urban pollution on UV spectral irradiances R. L. McKenzie et al. Title Page Abstract Introduction Conclusions References Tables Figures ◭ ◮ ◭ ◮ Back CloseFull Screen / Esc
Printer-friendly Version Interactive Discussion
criterion, as shown in Table 3. Since the statistical penalty was relatively small, we decided to restrict our subsequent analysis to scans where the diode noise was less than 1% of the mean. The resulting dataset includes cloud-free and cloudy-sky scans, but excludes scans where there is non uniform cloud cover in the vicinity of the Sun.
The spectra measured at each site were then binned by SZA, (5◦ steps ±2.5◦), and
5
by season. Here “summer” is taken as the 6 month period centred on the summer solstice and “winter” is the complementary 6 month period around the winter solstice. For smaller SZAs the period thus-defined as summer narrows towards the summer solstice period. Ratios were then formed to reveal the wavelength dependences of the differences between the two sites. The results are shown in Fig. 3.
10
In all of these ratio spectra, differential absorption features due to NO2 are clearly
visible in the UV-A region, especially at λ>420 nm. There are also differential absorp-tion features visible in the UV-B region due to O3 or SO2. These will be discussed
later.
During the “summer” period, the UV irradiances for high sun, SZA=25◦ (which is
15
close to noon for the summer solstice period for Lauder) are much smaller at Tokyo than at Lauder (black line). The ratio decreases markedly towards shorter wavelengths in the UV-B region because of the larger ozone amounts in Tokyo.
During the “summer” period for SZA=70◦ (red line), which is actually a full 6 month period, there is a different wavelength dependency. In the UV-B region, the ratio
de-20
creases more rapidly than for SZA=25◦, which can be explained by the longer path length through the ozone. There is also a tendency for the ratio to decrease at longer wavelengths, whereas it tended to increase in that spectral region for the smaller SZA. There is an unexpected increase in the ratio in the UV-A and “violet” (400–450 nm) regions.
25
In the “winter” period (the complementary 6 month period) for SZA=70◦, the mean
ratio is higher than for the summer period. Approximately 3% of this difference can be explained by the seasonal progression in Sun-Earth separation (the maximum effect between mid-summer summer and mid-winter is 7%). The larger observed difference
ACPD
8, 7149–7188, 2008 Effects of urban pollution on UV spectral irradiances R. L. McKenzie et al. Title Page Abstract Introduction Conclusions References Tables Figures ◭ ◮ ◭ ◮ Back CloseFull Screen / Esc
Printer-friendly Version Interactive Discussion
suggests that extinctions by aerosols in Tokyo are larger in summer than in winter. In this case the ratios are quite flat through the UV-B region. The smaller ozone de-pendence is expected, since the ozone amounts in winter are similar at both sites (discussed later). However, unlike the situation for SZA=70◦ in the summer, the ratios in winter tend to become larger at longer wavelengths.
5
To investigate whether the observed spectral differences at SZA=70◦ could be caused by obscuration of the horizons from nearby structures (see Fig. 4), we com-pared morning results, for which obscuration by a large structure to the East (Fig. 4a) may be more important, with afternoon results, for which there is minimal obscuration (Fig. 4b).
10
The results of this comparison are summarised in Fig. 5, in which Tokyo/Lauder irradiance ratios measured at SZA=70◦ are plotted as a function of season. Morning and afternoon data are plotted separately. The plotted points are the means of all irradiance ratios from 315–450 nm. The UV-B component is omitted to minimise effects of noise at the shortest wavelengths, and to avoid effects of seasonal differences in
15
ozone. The vertical bars in the plot show the standard deviations of the ratios for each month. The ratios are much lower in the summer months, showing that the effects of clouds and aerosols are much larger in Tokyo than at Lauder during the summer. In winter the ratios are larger, though still usually less than unity. Approximately 7% of this seasonal change can be explained by seasonal variations in the Sun-Earth separation.
20
With regard to the question of horizon obscuration, differences in these ratios between the morning and afternoon data are of particular interest. During the summer, the afternoon ratios tend to be slightly higher than the morning ratios, which would be consistent with a build-up of cloud at Lauder or a reduction of cloud and pollution at Tokyo during the day. On the other hand, during the winter, the afternoon ratios tend
25
to be significantly lower than the morning ratios, which would be consistent with Tokyo having mornings that are sunnier, or less polluted than afternoons (or Lauder having sunnier afternoons). Paradoxically, although there is no obscuration of direct sunlight for SZA=70◦, the effect of horizon obscuration at Tokyo would be more pronounced
ACPD
8, 7149–7188, 2008 Effects of urban pollution on UV spectral irradiances R. L. McKenzie et al. Title Page Abstract Introduction Conclusions References Tables Figures ◭ ◮ ◭ ◮ Back CloseFull Screen / Esc
Printer-friendly Version Interactive Discussion
during sunnier weather due to the greater anisotropy of sky light at those times, and the large component of scattered light in the vicinity of the Sun direction. The a.m./p.m. differences would also be more pronounced at shorter wavelengths. We return to this point in Sect. 9, during discussion of Fig. 13.
Here we estimated the effect of the horizon obscuration at Tokyo by calculating the
5
reduction in diffuse irradiance, expressed as a percentage of the total global irradiance assuming isotropy of skylight. From the preceding discussion, this procedure could potentially underestimate the effect under clear sky conditions.
5 Comparison with models: aerosol and cloud effects
In order to focus on differences in tropospheric extinctions between these two sites,
10
and to remove the effects of differences in SZA, stratospheric ozone, and Sun-Earth separation, we used the “tuv” radiative transfer model (Madronich and Flocke, 1995) to calculate the clear sky aerosol-free spectrum corresponding to each measurement. The model was recently validated against spectral measurements by the NIWA group at several sites (Badosa et al., 2007). The ozone values which were used in the
15
model were extracted from the assimilated global ozone data set maintained by NIWA (Bodeker et al., 2001). For both sites, we initially assumed the temperatures and ozone distributions followed those in the US standard atmosphere. A surface albedo of 0.05 was assumed. Although this is slightly higher than typical value of 0.02 expected for Lauder, it is probably quite representative of the more built-up environment at Tokyo
20
(McKenzie et al., 1996). These small differences in albedo do not affect the irradiances appreciably. Since the exercise was computationally intensive, and we were concerned only with effects for relatively small SZA, we used the 2-stream Delta-Eddington ap-proximation in the tuv model runs. More detailed calculations were carried out with the DISORT version of this model for specific cases, as discussed later. We define the
25
“tropospheric transmission” TLauder, TTokyofor Lauder and Tokyo respectively as the ratio of the measured to calculated spectra. The smallest SZA for which data are available
ACPD
8, 7149–7188, 2008 Effects of urban pollution on UV spectral irradiances R. L. McKenzie et al. Title Page Abstract Introduction Conclusions References Tables Figures ◭ ◮ ◭ ◮ Back CloseFull Screen / Esc
Printer-friendly Version Interactive Discussion
year-round at both sites is SZA=68◦. Time series of these ratios for that SZA range
are shown in Fig. 6. Note that with our data selection criteria, not all cloud conditions are included. At both sites, there is a large day to day variability which is due to the effects of clouds. These seem to be slightly damped for the Tokyo period. For the Lauder periods, the upper envelope of the transmissions is close to unity, and shows
5
little seasonal variability. In contrast, the upper envelope of transmissions at Tokyo is significantly smaller, and shows a much stronger seasonal variability, with smaller transmissions in the summer.
Figure 6 shows that on occasions at Lauder, the transmissions can exceed unity. For the UV-B region these can be caused by measurement errors, errors in ozone affecting
10
the model calculations, or by real increases in UV due to reflections from clouds or snow-covered surfaces. An example of the effect of snow is apparent during the winter at Lauder. The effects of snow are largest in the UV-B region, where surface albedo is generally less than 2% at this site (McKenzie et al., 1998), so that increases in surface albedo due to snow cover are largest. For the UV-A and violet regions, the ozone factor
15
does not contribute and the albedo effect is smaller. The larger enhancements in the violet region compared with the UV-A region are consistent with this being due to cloud enhancements (Pfister et al., 2003). To avoid possible issues arising from the effects of snow cover at Lauder, we analysed data separately for the summer and winter periods. The SZA dependence of the transmissions in the binned data described previously
20
is shown for three spectral regions in Fig. 7. The transmission is consistently greater at Lauder. The largest differences between sites and between spectral regions occur at smaller SZA. At the largest SZA available, the transmissions all converge to a value near 0.7. Transmissions tend to be smaller in the UV-B region. The differences be-tween Tokyo and Lauder are also more pronounced in the UV-B region. In the SZA
25
range 25◦<SZA<30◦, the mean transmission at Lauder is greater than 0.9, whereas the corresponding transmission at Tokyo is 0.7. This implies that the effects of clouds and aerosols are very small at Lauder for the subset of scans selected (for the 65% of scans where the diode noise is less than 1%). The corresponding transmissions if all
ACPD
8, 7149–7188, 2008 Effects of urban pollution on UV spectral irradiances R. L. McKenzie et al. Title Page Abstract Introduction Conclusions References Tables Figures ◭ ◮ ◭ ◮ Back CloseFull Screen / Esc
Printer-friendly Version Interactive Discussion
scans are considered are 0.7 and 0.5, respectively.
6 Retrieval of trace gases
Column amounts of trace gases that absorb in the spectral region sampled were de-rived with an adaptation of the widely used DOAS (Differential Optical Absorption Spec-troscopy) method. Previous studies using this method had shown that extinctions by
5
tropospheric aerosols and pollutant trace gases such as NO2 can be neglected at
Lauder (Johnston and McKenzie, 1984; Liley, 2006). The excess column amounts of the various trace gases in the Tokyo atmosphere are estimated by least-square fits of the ratio spectra (TTokyo/TLauder) to the relevant basis function that include the
ab-sorption cross sections of the gases in question as well as other known interfering
10
effects, such as absorptions from water vapour, and a basis function to model the fill-ing in of Fraunhofer lines by rotational Raman scatterfill-ing, known as the “Rfill-ing” effect. The retrieval method fits detrended and zero-mean versions of these basis functions to similarly detrended and zero-mean versions of the transmission ratios. We included several trace gases (e.g., O3, NO2, SO2, OClO, BrO), and explored the optimal regions
15
for retrievals by requiring that the fitting error be minimised. The only two species for which results were statistically meaningful were NO2and SO2, with optimal retrievals being made in the spectral ranges 425–448 nm and 300–315 nm, respectively. The re-trieved ozone effect is of particular interest. In principal, the effects of ozone should be removed since they are included in the model calculation as well as the measurements
20
themselves. However, uncertainties in the ozone amounts used in the model, as well as differences in its assumed distribution with altitude, together with any differences in light paths though the boundary layer caused by aerosol scattering, can also lead to systematic ozone effects. For example, in New Zealand a relatively small fraction of the total ozone is in the troposphere compared with at Tokyo, where ozone absorptions
25
are further amplified for high sun by multiple scattering from aerosols within the bound-ary layer. Thus for high sun (small SZA), we expect a residual absorption by ozone at
ACPD
8, 7149–7188, 2008 Effects of urban pollution on UV spectral irradiances R. L. McKenzie et al. Title Page Abstract Introduction Conclusions References Tables Figures ◭ ◮ ◭ ◮ Back CloseFull Screen / Esc
Printer-friendly Version Interactive Discussion
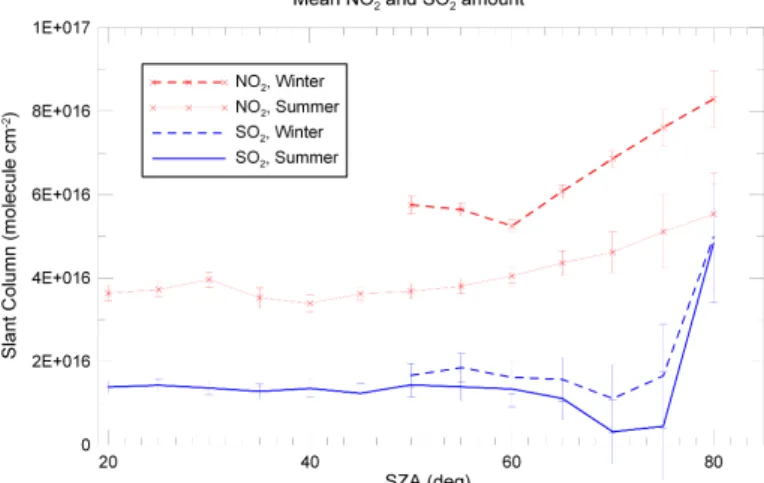
Tokyo even if there were no errors in the ozone values that are used by the model. The derived NO2and SO2slant column amounts over Tokyo for summer and winter months are shown in Fig. 8 as functions of SZA. Note that for our definition of winter, the minimum SZA included is SZA=50◦. For NO2 the retrieved values are larger in
winter, and in both seasons they appear to increase as a function of SZA. This
ap-5
parent increase may however be attributable to the effects of stratospheric NO2, which
becomes more important at twilight. The tropospheric path lengths (or air mass fac-tors) also tend to increase with SZA, although under these relatively polluted conditions this dependence is expected to be less than ∼20% over the range of SZA considered. Column amounts of SO2are smaller, approximately 1.5×10
16
molecule cm−2, and any
10
dependences on SZA or season are not statistically significant for SZA<80◦.
The column amounts can in principal be related to vertical column amounts if we know the effective air mass factors (Honninger et al., 2004); and then to concentra-tions if we know the thickness of the boundary layer, which can be estimated from lidar observations. The vertical column amounts are approximately half of the slant
col-15
umn amounts measured at SZA=60◦, and the resulting concentrations are quite plau-sible (personal communication, Y. Morino, Centre for Environmental Studies, Tsukuba, Japan). However, the details of this retrieval are outside the scope of the present work, and will be discussed elsewhere. Here we are concerned only with the effect of the slant column amounts on the radiation received at the surface.
20
Figure 9 shows a time series of the slant column amount of NO2derived from each
spectrum, for the whole Tokyo period using the standard DOAS technique, as de-scribed previously (Johnston and McKenzie, 1989). Results are from the same spectra as used in the mean values shown in Fig. 8, which are limited to SZA<80◦ to mini-mize the contribution from stratospheric NO2. The mean NO2amount derived by this
25
method is 4×10¹⁶molecule cm−2, which is consistent with the values derived by our alternative adaptation of the DOAS method, as shown in Fig. 8. However, on some days the NO2column amount can dramatically exceed the mean values. For example,
ex-ACPD
8, 7149–7188, 2008 Effects of urban pollution on UV spectral irradiances R. L. McKenzie et al. Title Page Abstract Introduction Conclusions References Tables Figures ◭ ◮ ◭ ◮ Back CloseFull Screen / Esc
Printer-friendly Version Interactive Discussion
ceeds the mean value by a factor of ∼20. As previously noted for the mean values, the baseline values of NO2in this plot also tend to be larger in winter than summer.
7 Absorptions by NO2and SO2
The calculated spectral absorption signatures caused by these retrieved amounts of tropospheric NO2and SO2are shown in Fig. 10. For the seasonal means in NO2and
5
SO2column amounts, the absorptions are relatively small. Their peak absorptions are
3% in the UV-A and 2% in the UV-B regions respectively for the sample spectra shown. However, in the extreme case, where the slant column amount of NO2 is a factor of
20 greater (100×1016molecule cm−2), the absolute absorption is strong. In the UV-A region absorption can exceed 50%, and even in the UV-B region where its absorption
10
cross section is smaller, the absorption is ∼15%. Although retrievals of SO2were
pos-sible from the seasonally averaged spectra, in which noise levels are greatly reduced, we have not yet been able to apply the standard DOAS technique to confidently cal-culate the SO2from individual spectra. However, the concentrations of pollutant trace gases in this region appear to depend largely on local meteorological conditions and
15
transport from the major source regions (Shirai et al., 2007), so the day to day vari-ability could be similar to that for NO2. Then absorptions by SO2could exceed 20% at some wavelengths in the UV-B region. The observed absorptions by NO2are
compa-rable with, but somewhat larger than, observations at other metropolitan areas, such as in Moscow (Chubarova, 2008).
20
It had been our intention to additionally determine whether there were any unidenti-fied spectral absorption features, possibly attributable to the cocktail of organic aerosols that is expected to be present in Tokyo. While there are significant remaining absorp-tions due to factors other than the retrieved trace gases, no definitive and consistent residual spectral characteristic could be identified.
ACPD
8, 7149–7188, 2008 Effects of urban pollution on UV spectral irradiances R. L. McKenzie et al. Title Page Abstract Introduction Conclusions References Tables Figures ◭ ◮ ◭ ◮ Back CloseFull Screen / Esc
Printer-friendly Version Interactive Discussion
8 Effects of profile differences, and their interaction with aerosols
Despite the fact that the effects of ozone should already be removed by forming the ra-tios of measured to modelled irradiances for each site, residual absorptions by ozone were still evident in the trace gas retrievals. We investigated whether these could be attributed to a larger fraction of ozone being in the troposphere at Tokyo, since it has
5
been shown previously that, on a per molecule basis, ozone absorbs more efficiently in the troposphere than in the stratosphere (Bruhl and Crutzen, 1989). This effect arises from two factors. Firstly, for small solar zenith angles the geometric path length through tropospheric ozone is increased by multiple scattering. Secondly, at the warmer tem-perature in the troposphere, the absorption cross section of ozone is larger. As the
10
SZA increases, the first of these factors tends to act in the opposite sense because the tropospheric air mass for the direct beam then becomes large, and multiple scattering tends to reduce the effective path length through the troposphere.
Previous work has shown that geographical and seasonal differences in the ozone and temperature profiles can have significant effects on UV irradiances (Badosa et al.,
15
2007; McKenzie et al., 2003; Kazantzidis et al., 2005). These may be especially impor-tant in Tokyo, since ozonesonde flights from nearby Tsukuba have shown very large enhancements of ozone in the boundary layer, especially during the summer, that are characteristic of urban air pollution (Oltmans et al., 2004). The large aerosol extinc-tions in Tokyo can exert an additional effect by increasing the effective tropospheric
20
path length, which in turn can lead to increased absorption by tropospheric ozone, as noted by Kerr and Davis (2007).
The mean conditions encountered at each site are shown in Table 4. We modelled these effects using the DISORT 8-stream version of the tuv model to calculate the effect on spectral UV of differences in the ozone and temperature profiles between Lauder
25
and Tokyo. First we extracted the mean summer and winter profiles at each site for the periods of study from a recently compiled database (Hassler et al., 2008). The mean profiles are shown in Fig. 11. As expected, the tropospheric burden of ozone is
ACPD
8, 7149–7188, 2008 Effects of urban pollution on UV spectral irradiances R. L. McKenzie et al. Title Page Abstract Introduction Conclusions References Tables Figures ◭ ◮ ◭ ◮ Back CloseFull Screen / Esc
Printer-friendly Version Interactive Discussion
significantly larger at Tokyo than at Lauder. There are also significant differences in the temperature profiles, with lower temperatures and larger seasonal mean difference at tropopause heights over Tokyo than at Lauder. In the lower troposphere there is a much larger seasonal difference at Tokyo than at Lauder. We then compared irradiances calculated for Tokyo using the Lauder profiles with those calculated with the profiles that
5
were appropriate for Tokyo. For both sites, we used the total column ozone amounts as measured at Lauder. The calculation was repeated for a range of aerosol optical depths. In all cases we assumed an aerosol single scattering albedo of 0.95, an aerosol asymmetry factor of 0.61, and a surface albedo of 0.05. For the UV-A integral, the effects of these profile differences are small. For the UV-B integral, their effect was to
10
reduce irradiances in Tokyo compared with Lauder. These reductions were largest for small SZA in the summer, when the UV is most intense (see Table 5). However, at wavelengths shorter than ∼300 nm, the effect of profile differences becomes larger for SZA=70◦ than for SZA=25◦, as shown in Fig. 12. At these shorter wavelengths, the
effects of interactions between the profiles and aerosol also become more important.
15
As the aerosol burden increases, the radiative effect of the profile differences between Lauder and Tokyo is amplified. At the shortest wavelengths, particularly for SZA=70◦,
there is a suggestion of a reversal, where the effect of these profile differences causes an increase in the ratio as the wavelength decreases. At twilight the effects of these changes in profile are smaller, and for SZA>90◦ they can even reverse sign at shorter
20
UV-B wavelengths (not shown). However, this is of little importance because at twilight the total irradiance at these wavelengths is very small. Finally, we note that the effects of ozone profile differences and temperature profile differences do not add linearly. At the smaller SZA (SZA=25◦), the combined effect is larger than the sum of the two individual effects. Conversely, at the larger SZA (SZA=70◦), the combined effect is
25
ACPD
8, 7149–7188, 2008 Effects of urban pollution on UV spectral irradiances R. L. McKenzie et al. Title Page Abstract Introduction Conclusions References Tables Figures ◭ ◮ ◭ ◮ Back CloseFull Screen / Esc
Printer-friendly Version Interactive Discussion
9 Comparing modelled and measured UV spectral irradiances
To check our overall understanding of the processes, we compared measured spectral ratios between Tokyo and Lauder (shown previously, in Fig. 3) with modelled ratios cal-culated from the tuv radiative transfer model using DISORT with 8-streams. Although the measured spectra include the effects of clouds, the calculations were carried out
5
for cloud-free conditions, and we attempted to simulate the differences due to the com-bined effects of clouds and aerosols. The calculations included the effects of differ-ences in altitude, and Sun-Earth separation, but they excluded the effects of horizon obscuration at Tokyo. The inputs to the model calculations are as listed in Table 4, and we used the vertical profiles for ozone and temperature profiles shown in Fig. 11.
Base-10
line calculations were carried out for each site assuming aerosol free conditions and a surface albedo of 0.05 (independent of wavelength). No trace gases were included for Lauder, but for Tokyo we included the effects of absorptions by NO2and SO2. We
investigated the sensitivities to changing aerosol optical depth (specified at 1 µm), its wavelength dependence, and surface albedo in Tokyo. In all cases, we assumed an
15
aerosol single scattering albedo of 0.95, and an aerosol asymmetry parameter of 0.67. The comparison is shown in Fig. 13.
For SZA=25◦ in the summer, the measured ratios are well simulated by the model between 330 nm and 450 nm for an assumed aerosol optical depth of 0.5. At wave-lengths shorter than 300 nm, the measured ratios become progressively higher than
20
the calculated ratios.
For SZA=70◦ in the summer, the measured ratios are well simulated by the model
down to 300 nm, for an assumed optical depth of 0.2. At shorter wavelengths the measured ratios are again larger than the calculated ratios.
For SZA=70◦ in the winter, the measured ratios do not match the calculated ratios,
25
possibly because of the confounding effect of the nearby buildings. While there is rea-sonable agreement with the calculated ratios for optical depth 0.1 at the longest wave-lengths, measured values fall further and further below the calculated ratios
through-ACPD
8, 7149–7188, 2008 Effects of urban pollution on UV spectral irradiances R. L. McKenzie et al. Title Page Abstract Introduction Conclusions References Tables Figures ◭ ◮ ◭ ◮ Back CloseFull Screen / Esc
Printer-friendly Version Interactive Discussion
out most of the UV-A and UV-B range. This tendency for measured ratios to become smaller at shorter wavelengths may be a consequence of obscuration of scattered light by the building (see Fig. 4), since its effect is larger in the winter, and the scattered light component becomes a progressively larger fraction of the total at shorter wavelengths. To understand this better, measured ratios for the morning and afternoon data
re-5
spectively have been included in Fig. 13. Differences between the morning and af-ternoon ratios are relatively small for the summer conditions. However, there are sig-nificant differences between the morning and afternoon results in the winter. In the afternoon data, the ratios are lower, and the spectral signature is more consistent with the model results. In contrast, the ratios are much higher in the morning data, and
10
show poorer agreement with the model calculations. The best-fit optical depth is also significantly lower for these winter morning values at SZA=70◦than for the other cases. These findings suggest that skies tend to be clearest during the winter morning peri-ods, and in that case the radiation field is less isotropic and therefore more affected by the horizon blockage in the vicinity of the Sun. A comparison of morning and afternoon
15
results revealed that tropospheric transmissions at Tokyo were indeed larger during the winter mornings, as shown previously in Fig. 5.
In all cases, there is a tendency for the measured ratios to exceed the modelled ratios at the shortest wavelengths. Sensitivity tests showed that variations in the surface albedo and the wavelength-dependence of aerosol extinction at Tokyo had only small
20
effects on the ratios shown in Fig. 13. For example, if the surface albedo at Tokyo is increased from 0.05 to 0.10, the UV-B ratios at SZA=70◦ increase by less than 1%. Similarly, if the Angstrom wavelength exponent of aerosol extinction (β) is reduced from its default value of 1.0 to 0.8, the increase in the UV-B ratios is also only ∼1%.
The aerosol conditions that result in best agreements between model and
measure-25
ment are different for each of the three cases. Significant differences in aerosols are plausible, since the periods are different. However, even allowing for these differences there are several features in the measured ratios which are not present in the model. For example, in all three cases, the measured ratios are larger than the model at the
ACPD
8, 7149–7188, 2008 Effects of urban pollution on UV spectral irradiances R. L. McKenzie et al. Title Page Abstract Introduction Conclusions References Tables Figures ◭ ◮ ◭ ◮ Back CloseFull Screen / Esc
Printer-friendly Version Interactive Discussion
shortest wavelengths. These differences are reminiscent of those seen in Fig. 12, but are not present in the model calculations in this case because differences in total col-umn ozone amounts (see Table 4) swamp those due to profile differences. The effect is also in the opposite sense to what would be expected if there were unidentified ab-sorbers, such as from organic aerosols, in Tokyo. The divergence between model and
5
measurement, with relatively higher measured values in the UV-B region compared with the UV-A region, leads us to conclude that any effects of unidentified organic aerosols that preferentially absorb in the UV-B region are not large. The discrepan-cies noted here are perhaps not surprising, since we have attempted to model the observed ratios for all sky conditions using a clear-sky model. Even small differences
10
in cloud cover could have a marked effect. The behaviour at the shortest wavelengths, where measured ratios are higher than modelled ratios, is unexpected and remains unexplained.
10 Conclusions
During the summer, mean UV-B irradiances at Tokyo are approximately 40% less than
15
at Lauder for the same solar zenith angle. These differences are slightly smaller in the winter, and in the UV-A region.
The effects of pollution in Tokyo impose large reductions in UV irradiances compared with those at the pristine Lauder site. The reductions in UV at Tokyo become progres-sively larger as the wavelength decreases though the UV-A and UV-B regions. The
20
difference of the mean values between Lauder and Tokyo in the UV-B and UV-A for two SZAs in summer and one in winter are summarised respectively in Table 5. Note that the combined effect of the individual factors is not the same as the overall transmis-sion shown in Fig. 7. The differences are at times close to the combined uncertainty of the measurements (±11%). However, the chief cause for the discrepancy is not
25
measurement error, but is due to the fact that the RT model used in that figure did not include all of the effects discussed in the Table. In particular, it was run with only
2-ACPD
8, 7149–7188, 2008 Effects of urban pollution on UV spectral irradiances R. L. McKenzie et al. Title Page Abstract Introduction Conclusions References Tables Figures ◭ ◮ ◭ ◮ Back CloseFull Screen / Esc
Printer-friendly Version Interactive Discussion
streams and excluded the effects of differences in ozone and temperature profiles, and the interactions with aerosols, absorptions by NO2and SO2, and horizon obscuration.
The effects of Sun-Earth differences, altitude, ozone, profile differences, and tropo-spheric trace gases were all included in Fig. 13, and further sensitivity tests with the tuv radiative transfer model failed to identify any modification that could have improved
5
the agreement significantly. The effect of horizon obscuration remains as a likely can-didate for the remaining discrepancy between model and measurement. Its effect was estimated by calculating the reduction in diffuse radiation field, which was assumed to be isotropic. The reduction is expressed as a fraction of the total radiation field. For the solar zenith angles chosen, the direct beam is never obscured. There are limitations to
10
this approach. Firstly, the diffuse fraction is a function of aerosol optical depth, which was not measured directly – we simply assumed an optical depth of 0.2 at 1 micron at Tokyo for this calculation. Secondly, although the diffuse radiation field tends to be more isotropic in the UV region, there is still a relatively large fraction from the region of the sky surrounding the Sun (the aureole). However, an accurate representation of
15
these effects is complex, and since the overall correction from horizon obscuration is rather small, we did not include these detailed effects.
After all known effects were taken into account, any remaining unexplained differ-ences were attributed to the effects of aerosols and clouds. As discussed previously, with the data selection criteria that have been applied (i.e., diode signal noise <1%),
20
most of the differences will be due to aerosols rather than clouds, since the passage of clouds generally leads to increased variability in the UV-A diode signal.
Referring to Table 5, it can be seen that these cloud/aerosol effects are the largest contributors to the differences in UV between Tokyo and Lauder. In the UV-A region, the effects of clouds and aerosols seem to be smaller in the winter than in the summer.
25
However, in the UV-B region, their contribution is similar in summer and winter, and does not depend strongly on SZA. In the UV-B region, the next most important factors are the differences in column ozone and its vertical profile. These are important only in the summer months. The next most important factor is the differences in Sun-Earth
ACPD
8, 7149–7188, 2008 Effects of urban pollution on UV spectral irradiances R. L. McKenzie et al. Title Page Abstract Introduction Conclusions References Tables Figures ◭ ◮ ◭ ◮ Back CloseFull Screen / Esc
Printer-friendly Version Interactive Discussion
separation, which acts in the opposite sense in winter. The effect of horizon obscuration is small and is comparable with the differences that are due to differences in altitude. Both of these effects are slightly greater at larger SZA. The effects of NO2and SO2are
small for the mean amount. The effects of NO2are larger in the UV-A region, while the
effects of SO2are larger in the UV-B region. However, for the peak amounts, which are
5
∼20 times these mean values, the decreases in irradiances can be appreciable. This study reinforces previous research that has shown UV intensities in New Zealand to be relatively large compared with corresponding latitudes in the northern hemisphere. In this case, we have demonstrated the cleaner air is an important fac-tor. Since the effect is relatively large, it seems plausible that residual extinctions by
10
aerosols may still be a significant factor in supposedly clean air at sites far from the source of the aerosols. While the cleaner atmosphere in Lauder New Zealand is un-doubtedly beneficial for health, its effect on UV may not be. In summer there is a greater probability of skin damage in New Zealand, due to the more intense UV irradi-ance, which can lead to skin cancer. In the winter, when UV intensities are lower than
15
in Tokyo, there is a greater risk of insufficient vitamin D production (the action spectrum for vitamin D production is similar to that for erythema) (McKenzie et al., 2004).
In Tokyo, locations where the horizons are unimpeded by buildings are hard to find. Even for the measurement described in the paper, there were significant effects. In general, as far as the general public are concerned, the prevalence of high buildings
20
which block the sky, and lifestyle choices, characterised by spending a larger fraction of time indoors, will be important factors which further limit the personal exposure to UV radiation.
These results have important implications for our ability to accurately retrieve surface UV irradiances at polluted sites from satellites that use backscattered UV.
Supplemen-25
tary data characterising these boundary layer effects is probably needed.
Acknowledgements. We thank D. Pissulla from the University of Hannover for development of
analysis tools that were useful in this study. Ozone column amounts, and vertical profiles of ozone and temperature were provided by G. Bodeker from NIWA Lauder, and B. Hassler, from the University of Munich.
ACPD
8, 7149–7188, 2008 Effects of urban pollution on UV spectral irradiances R. L. McKenzie et al. Title Page Abstract Introduction Conclusions References Tables Figures ◭ ◮ ◭ ◮ Back CloseFull Screen / Esc
Printer-friendly Version Interactive Discussion
References
Badosa, J., McKenzie, R. L., Kotkamp, M., Calb ´o, J., Gonz ´alez, J. A., Johnston, P. V., O’Neill, M., and Anderson, D. J.: Towards closure between measured and modelled UV under clear skies at four diverse sites, Atmos. Chem. Phys., 7, 2817–2837, 2007,
http://www.atmos-chem-phys.net/7/2817/2007/.
5
Bais, A. F., Zerefos, C. S., Meleti, C., Ziomas, I. C., and Tourpali, K.: Spectral measurements of solar UV-B radiation and its relations to total ozone, SO2, and clouds, J. Geophys. Res., 98, 5199–5204, 1993.
Bodeker, G. E., Scott, J. C., Kreher, K., and McKenzie, R. L.: Global ozone trends in potential vorticity coordinates using TOMS and GOME intercompared against the Dobson network:
10
1978–1998, J. Geophys. Res., 106, 23 029–23 042, 2001.
Bruhl, C. and Crutzen, P. J.: On the disproportionate role of tropospheric ozone as a filter against solar UV-B radiation, Geophys. Res. Lett., 16, 703–706, 1989.
Chin, M., Chu, A., Levy, R., Remer, L., Kaufman, Y., Holben, B., Eck, T., Ginoux, P., and Gao, Q.: Aerosol distribution in the Northern Hemisphere during ACE-Asia: Results from global
15
model, satellite observations, and Sun photometer measurements, J. Geophys. Res, 109, D23S90, doi:10.1029/2004JD004829, 2004.
Chubarova, N.: UV variability in Moscow according to long-term UV measurements and recon-struction model, Atmos. Chem. Phys. Discuss., 893–906, 2008.
Hassler, B., Bodeker, G., and Dameris, M.: Technical Note: A new global database of trace
20
gases and aerosols from multiple sources of high vertical resolution measurements, Atmos. Chem. Phys., accepted, 2008.
Honninger, G., von Friedeburg, C., and Platt, U.: Multi axis differential optical absorption spec-troscopy (MAX-DOAS), Atmos. Chem. Phys., 4, 231–254, 2004,
http://www.atmos-chem-phys.net/4/231/2004/.
25
Jacobson, M. Z.: Isolating the causes and effects of large ultraviolet reductions in Los Angeles, J. Aerosol Sci., 29, S655–S656, 1998.
Johnston, P. V. and McKenzie, R. L.: Long-path absorption measurements of tropospheric NO2 in rural New Zealand, Geophys. Res. Lett., 11, 69–72, 1984.
Johnston, P. V. and McKenzie, R. L.: NO2observations at 45S during the decreasing phase of
30
solar cycle 21, from 1980 to 1987, J. Geophys. Res., 94, 3473–3486, 1989.
ACPD
8, 7149–7188, 2008 Effects of urban pollution on UV spectral irradiances R. L. McKenzie et al. Title Page Abstract Introduction Conclusions References Tables Figures ◭ ◮ ◭ ◮ Back CloseFull Screen / Esc
Printer-friendly Version Interactive Discussion
UV radiation to ozone and temperature profiles at Thessaloniki (40.5◦N, 23◦E), Greece, J.
Atmos. Solar-Terr. Phys., 67, 1321–1330, 2005.
Kerr, J. and Davis, J.: New methodology applied to deriving total ozone and other atmo-spheric variables from global irradiance spectra, J. Geophys. Res.-Atmos., 112, D21301, doi:10.1029/2007JD008708, 2007.
5
McKenzie, R. L., Kotkamp, M., and Ireland, W.: Upwelling UV spectral irradiances and surface albedo measurements at Lauder, New Zealand, Geophys. Res. Lett., 23, 1757–1760, 1996. McKenzie, R. L., Paulin, K. J., and Madronich, S.: Effects of snow cover on UV radiation and
surface albedo: a case study, J. Geophys. Res., 103, 28 785–28 792, 1998.
McKenzie, R., Smale, D., Bodeker, G., and Claude, H.: Ozone profile differences between
10
Europe and New Zealand: Effects on surface UV irradiance and its estimation from satellite sensors, J. Geophys. Res., 108, 4179, doi:10.1029/2002JD002770, 2003.
McKenzie, R., Smale, D., and Kotkamp, M.: Relationship between UV-B and erythemally weighted radiation, Photochem. Photobiol. Sci., 3, 252–256, 2004.
McKenzie, R. L., Bodeker, G. E., Scott, G., and Slusser, J.: Geographical differences in
15
erythemally-weighted UV measured at mid-latitude USDA sites, Photochem. Photobiol. Sci., 5, 343–352, 2006.
Oltmans, S. J., Johnson, B. J., Harris, J. M., Thompson, A. M., Liu, H. Y., Chan, C. Y., Vomel, H., Fujimoto, T., Brackett, V. G., Chang, W. L., Chen, J.-P., Kim, J. H., Chan, L. Y., and Chang, H.-W.: Tropospheric ozone over the North Pacific from ozonesonde observations, J.
20
Geophys. Res., 109, D15S01, doi:10.1029/2003JD003466, 2004.
Pfister, G., McKenzie, R. L., Liley, J. B., Thomas, A., Forgan, B. W., and Long, C. N.: Cloud cov-erage based on all-sky imaging and its impact on surface solar irradiance, J. Appl. Meteorol., 42, 1421–1434, 2003.
Seckmeyer, G. and McKenzie, R. L.: Increased ultraviolet radiation in New Zealand (45◦S)
25
relative to Germany (48◦N), Nature, 359, 135–137, 1992.
Shirai, T., Yokouchi, Y., Blake, D., Kita, K., Izumi, K., Koike, M., Komazaki, Y., Miyazaki, Y., Fukuda, M., and Kondo, Y.: Seasonal variations of atmospheric C-2-C-7 nonmethane hydro-carbons in Tokyo, J. Geophys. Res., 112, 24 305–24 305, 2007.
Wuttke, S., Bernhard, G., Ehramjian, J. C., McKenzie, R., Johnston, P., O’Neill, M., and
Seck-30
meyer, G.: New spectrometers complying with the NDSC standards, J. Ocean. Atmos. Tech-nol., 23, 241–251, 2006.
ACPD
8, 7149–7188, 2008 Effects of urban pollution on UV spectral irradiances R. L. McKenzie et al. Title Page Abstract Introduction Conclusions References Tables Figures ◭ ◮ ◭ ◮ Back CloseFull Screen / Esc
Printer-friendly Version Interactive Discussion Table 1. Instrument specifications of the UV4 spectrometer system.
Parameter Description
Model Acton, SpectraPro DSP-275
Type Double Monochromator, Additive Dispersion Focal length (mm) 275
Focal ratio f/3.8
Grating type Plane Holographic Ruling (/mm) 3600
Dispersion (nm/mm) 0.5
Slit widths (mm) 1.0, 1.5, 1.0 Slit height (mm) 20
Entrance optic Shaped PTFE diffuser (in house design)
Coupling Fibre Bundle (1.95 m×20 mm×1.2 mm (GigaHertz))
Detector Hamamatsu R1527
Wavelength range 285–450 nm Resolution (fwhm) 0.6 nm
Sample step 0.2 nm
Normal Scan period 272 s for forward + reverse scan
ACPD
8, 7149–7188, 2008 Effects of urban pollution on UV spectral irradiances R. L. McKenzie et al. Title Page Abstract Introduction Conclusions References Tables Figures ◭ ◮ ◭ ◮ Back CloseFull Screen / Esc
Printer-friendly Version Interactive Discussion Table 2. Site details.
Site Lat (◦N) Long (◦E) Alt (m) Period of deployment
Lauder, New Zealand −45.04 169.68 370 Nov 2002 to May 2004, and Aug 2005 to present Tokyo, Japan 35.66 139.68 60 28 Jul 2004 to 18 Jun 2005
ACPD
8, 7149–7188, 2008 Effects of urban pollution on UV spectral irradiances R. L. McKenzie et al. Title Page Abstract Introduction Conclusions References Tables Figures ◭ ◮ ◭ ◮ Back CloseFull Screen / Esc
Printer-friendly Version Interactive Discussion Table 3. Number of scans included for various diode threshold statistics, expressed as the
diode coefficient of variation.
Site All scans SZA<80◦and SZA<80◦and
Diode noise<5% Diode noise<1%
Lauder 17 773 9727 6274
ACPD
8, 7149–7188, 2008 Effects of urban pollution on UV spectral irradiances R. L. McKenzie et al. Title Page Abstract Introduction Conclusions References Tables Figures ◭ ◮ ◭ ◮ Back CloseFull Screen / Esc
Printer-friendly Version Interactive Discussion Table 4. Comparison of the mean conditions at Lauder and Tokyo for the spectra analysed at
SZA=25◦
(summer only), and SZA=70◦ (summer and winter). See Fig. 7 for uncertainties in
NO2and SO2retrievals. The conversion from slant column amount to vertical column amounts assumed air mass factors of 1.5 and 2.5 respectively at the two SZAs. One Dobson Unit (DU) corresponds to a vertical column amount of 2.69×10¹⁶molecule cm−2.
Season Summer Winter
Solar Zenith Angle (SZA) 25◦ 70◦ 70◦
Day of Year
Lauder 359 12 166
Tokyo 160 1770 362
Ozone column (DU)
Lauder 290.0 287.7 300.1 Tokyo 320.8 320.1 301.5 NO2column (DU) Lauder 0 0 0 Tokyo 0.9 0.7 1.0 SO2colum (DU) Lauder 0.0 0.0 0.0 Tokyo 0.3 0.1 0.1
ACPD
8, 7149–7188, 2008 Effects of urban pollution on UV spectral irradiances R. L. McKenzie et al. Title Page Abstract Introduction Conclusions References Tables Figures ◭ ◮ ◭ ◮ Back CloseFull Screen / Esc
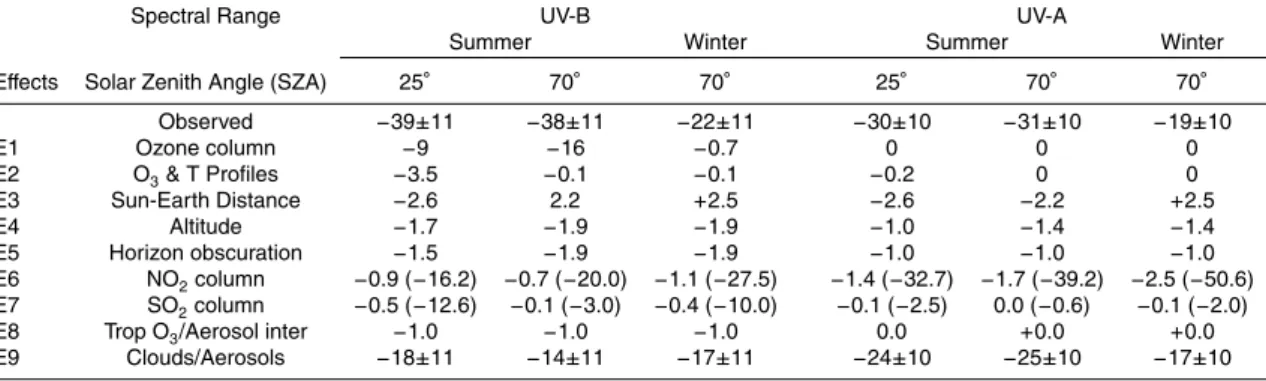
Printer-friendly Version Interactive Discussion Table 5. Mean percentage (%) differences in UV-B and UV-A between Tokyo and Lauder and
the inferred attribution effects. Results are shown for summer (SZA: 25◦ and 70◦) and winter
(SZA: 70◦). The numbers in parentheses for NO
2and SO2are the effects calculated when the
mean column amounts are increased by a factor of 20 to represent their maxima. The effect of clouds and aerosols (E9) is defined as the remaining extinction after all identified factors have been considered, (i.e., E9=Obs–(E1+E2+E3+E4+E5+E6+E7+E8). The uncertainty is the 2σ quadrature sum from the measurements at both sites.
Spectral Range UV-B UV-A
Summer Winter Summer Winter Effects Solar Zenith Angle (SZA) 25◦ 70◦ 70◦ 25◦ 70◦ 70◦
Observed −39±11 −38±11 −22±11 −30±10 −31±10 −19±10 E1 Ozone column −9 −16 −0.7 0 0 0 E2 O3& T Profiles −3.5 −0.1 −0.1 −0.2 0 0 E3 Sun-Earth Distance −2.6 2.2 +2.5 −2.6 −2.2 +2.5 E4 Altitude −1.7 −1.9 −1.9 −1.0 −1.4 −1.4 E5 Horizon obscuration −1.5 −1.9 −1.9 −1.0 −1.0 −1.0 E6 NO2column −0.9 (−16.2) −0.7 (−20.0) −1.1 (−27.5) −1.4 (−32.7) −1.7 (−39.2) −2.5 (−50.6) E7 SO2column −0.5 (−12.6) −0.1 (−3.0) −0.4 (−10.0) −0.1 (−2.5) 0.0 (−0.6) −0.1 (−2.0)
E8 Trop O3/Aerosol inter −1.0 −1.0 −1.0 0.0 +0.0 +0.0
ACPD
8, 7149–7188, 2008 Effects of urban pollution on UV spectral irradiances R. L. McKenzie et al. Title Page Abstract Introduction Conclusions References Tables Figures ◭ ◮ ◭ ◮ Back CloseFull Screen / Esc
Printer-friendly Version Interactive Discussion Fig. 1. History of UV4 deployment shown by time series of UV and derived ozone.
ACPD
8, 7149–7188, 2008 Effects of urban pollution on UV spectral irradiances R. L. McKenzie et al. Title Page Abstract Introduction Conclusions References Tables Figures ◭ ◮ ◭ ◮ Back CloseFull Screen / Esc
Printer-friendly Version Interactive Discussion Fig. 2. Measurements of UV-A (315–400 nm) and UV-B (280–315 nm) irradiances over the
clearest days at each site (top panel), and corresponding calculated UV-A transmissions for the same time periods (middle panel). The corresponding variations in erythemally weighted UV irradiance and UV Index are also shown as a function of SZA (bottom panel).
ACPD
8, 7149–7188, 2008 Effects of urban pollution on UV spectral irradiances R. L. McKenzie et al. Title Page Abstract Introduction Conclusions References Tables Figures ◭ ◮ ◭ ◮ Back CloseFull Screen / Esc
Printer-friendly Version Interactive Discussion Fig. 3. Spectral ratios of Tokyo Irradiances divided by Lauder irradiances for three conditions:
summer, SZA=25◦, and 70◦
ACPD
8, 7149–7188, 2008 Effects of urban pollution on UV spectral irradiances R. L. McKenzie et al. Title Page Abstract Introduction Conclusions References Tables Figures ◭ ◮ ◭ ◮ Back CloseFull Screen / Esc
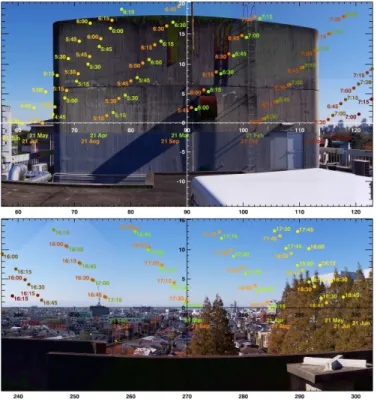
Printer-friendly Version Interactive Discussion Fig. 4. Sunrise and sunset horizons viewed from the instrument diffuser at Tokyo. The figures
superimposed on the photograph show the position of the sun at twilight on the 21st of each month. (Upper) View to the East showing a wall which obscured the direct sun for SZA>72◦
in the sunrise periods from February to October. (Lower) View to the West, showing minimal obscuration for the sunset periods. The figures are cylindrical panoramic reconstructions from rectilinear images, with angular uncertainties better than ±0.2◦.
ACPD
8, 7149–7188, 2008 Effects of urban pollution on UV spectral irradiances R. L. McKenzie et al. Title Page Abstract Introduction Conclusions References Tables Figures ◭ ◮ ◭ ◮ Back CloseFull Screen / Esc
Printer-friendly Version Interactive Discussion Fig. 5. Seasonal variation in the Tokyo/Lauder irradiance ratios measured at SZA=70, for the
morning and afternoon data separately. The plotted points are the means of all irradiance ratios from 315–450 nm. The UV-B component is omitted to minimise effects of noise at the shortest wavelengths, and to avoid effects of seasonal differences in ozone. The vertical bars show the standard deviation of the ratios for each month.
ACPD
8, 7149–7188, 2008 Effects of urban pollution on UV spectral irradiances R. L. McKenzie et al. Title Page Abstract Introduction Conclusions References Tables Figures ◭ ◮ ◭ ◮ Back CloseFull Screen / Esc
Printer-friendly Version Interactive Discussion Fig. 6. Time series of tropospheric transmissions for the UV4 instrument during its deployment
at Lauder and Tokyo. UV-B (top panel), UV-A (middle panel) and Violet (bottom panel) for SZA= 70◦
±2.5◦. Note that spectral measurements at Lauder are made at noon and at 5◦ multiples of SZA.
ACPD
8, 7149–7188, 2008 Effects of urban pollution on UV spectral irradiances R. L. McKenzie et al. Title Page Abstract Introduction Conclusions References Tables Figures ◭ ◮ ◭ ◮ Back CloseFull Screen / Esc
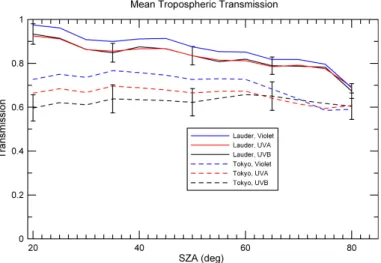
Printer-friendly Version Interactive Discussion Fig. 7. Tropospheric transmissions at Lauder and Tokyo as functions of SZA. Black: UV-B (280–
315 nm); Red: UV-A (315–400 nm); Blue: violet (400–450 nm). Solid line, Lauder, Dashed line, Tokyo, period for Lauder: November 2002 to May 2004; Tokyo: June 2004 to June 2005. The 2σ uncertainties for Lauder and Tokyo are shown by the error bars on the UV-B lines.
ACPD
8, 7149–7188, 2008 Effects of urban pollution on UV spectral irradiances R. L. McKenzie et al. Title Page Abstract Introduction Conclusions References Tables Figures ◭ ◮ ◭ ◮ Back CloseFull Screen / Esc
Printer-friendly Version Interactive Discussion
Fig. 8. Slant column amounts of NO2 (red) and SO2(blue), with error bars as a function of
SZA in the seasons defined previously: summer (20◦ to 80◦, solid line) and winter (50◦to 80◦,
ACPD
8, 7149–7188, 2008 Effects of urban pollution on UV spectral irradiances R. L. McKenzie et al. Title Page Abstract Introduction Conclusions References Tables Figures ◭ ◮ ◭ ◮ Back CloseFull Screen / Esc
Printer-friendly Version Interactive Discussion
Fig. 9. Slant column amounts of NO2 for each spectra plotted as a time series for the whole
ACPD
8, 7149–7188, 2008 Effects of urban pollution on UV spectral irradiances R. L. McKenzie et al. Title Page Abstract Introduction Conclusions References Tables Figures ◭ ◮ ◭ ◮ Back CloseFull Screen / Esc
Printer-friendly Version Interactive Discussion
Fig. 10. Tropospheric extinctions by NO2 and SO2 for the calculated mean slant column
amounts, and for the extreme cases where slant column amounts are a factor of 20 greater than the mean values.
ACPD
8, 7149–7188, 2008 Effects of urban pollution on UV spectral irradiances R. L. McKenzie et al. Title Page Abstract Introduction Conclusions References Tables Figures ◭ ◮ ◭ ◮ Back CloseFull Screen / Esc
Printer-friendly Version Interactive Discussion Fig. 11. Comparison of ozone profiles (left) and temperature profiles (right) at Lauder (top) and
Tokyo (bottom). The profiles for Tokyo were obtained from balloon sonde flights at Tateno, near Tsukuba, Tokyo.
ACPD
8, 7149–7188, 2008 Effects of urban pollution on UV spectral irradiances R. L. McKenzie et al. Title Page Abstract Introduction Conclusions References Tables Figures ◭ ◮ ◭ ◮ Back CloseFull Screen / Esc
Printer-friendly Version Interactive Discussion Fig. 12. Calculated effects of differences in ozone and temperature profiles between Lauder
ACPD
8, 7149–7188, 2008 Effects of urban pollution on UV spectral irradiances R. L. McKenzie et al. Title Page Abstract Introduction Conclusions References Tables Figures ◭ ◮ ◭ ◮ Back CloseFull Screen / Esc
Printer-friendly Version Interactive Discussion Fig. 13. Comparison between measured and calculated spectral ratios for Tokyo/Lauder for
the same cases as shown in Fig. 3 (a) summer, SZA=25◦, (b) summer, SZA=70◦, (c) winter, SZA=70◦. The solid and broken coloured lines that are distributed about the measured values