HAL Id: hal-02268499
https://hal.archives-ouvertes.fr/hal-02268499
Submitted on 21 Aug 2019
HAL is a multi-disciplinary open access
archive for the deposit and dissemination of
sci-entific research documents, whether they are
pub-lished or not. The documents may come from
teaching and research institutions in France or
abroad, or from public or private research centers.
L’archive ouverte pluridisciplinaire HAL, est
destinée au dépôt et à la diffusion de documents
scientifiques de niveau recherche, publiés ou non,
émanant des établissements d’enseignement et de
recherche français ou étrangers, des laboratoires
publics ou privés.
Mechanical behaviour of a high explosive: multiaxial
loading and strain-induced anisotropy
Gaëtane Plassart, Didier Picart, Michel Gratton, Arnaud Frachon, Michael
Caliez
To cite this version:
Gaëtane Plassart, Didier Picart, Michel Gratton, Arnaud Frachon, Michael Caliez.
Mechanical
behaviour of a high explosive: multiaxial loading and straininduced anisotropy. EUROPYRO
-44TH INTERNATIONAL PYROTECHNICS SOCIETY SEMINAR, Jun 2019, Tours, France.
�hal-02268499�
1
Mechanical behaviour of a high explosive: multiaxial loading and
strain-induced anisotropy
Gaëtane Plassart1*, Didier Picart1, Michel Gratton2, Arnaud Frachon2, Michaël Caliez2
1
CEA DAM Le Ripault, F-37260 Monts, France
2
INSA CVL, Univ. Orléans, Univ. Tours, LaMé, EA 7494, F-41000, Blois, France
*
Corresponding author: gaetane.plassart@cea.fr
Abstract
1.
Some experimental tests have highlighted a strain-induced anisotropy on a TATB-based PBX. In order to understand the phenomenon, literature is studied. Two interpretations seem possible: an anisotropic damage or a behaviour mainly governed by a kinematic hardening. Several experiments carried out let think that the material strain-induced anisotropy is due to the latter.
Introduction
2.
Modern numerical tools enable simulating operational life conditions of pyrotechnic structures but an improved and accurate mechanical constitutive law of the explosive composition is required. The main difficulty comes from the complexity of the behaviour of such a material. The aim of this study is to determine the behaviour law of a TATB-based PBX, denoted “M2”.
M2 is an energetic material made of a large majority of TATB crystals. Explosive crystals are coated with a thin layer of a thermoplastic binder, millimetric metagrains being then obtained by granulation. Granules are vacuum-packed in a tight elastomer bag, before being submitted to isostatic compaction cycles at approximately 150°C and 200 MPa. The temperature is chosen to soften the binder. The pressure applied to densify the material is higher than the one experienced during the life cycle of the pyrotechnic structure (pmax about 10 MPa). After cooling, the part of compacted material
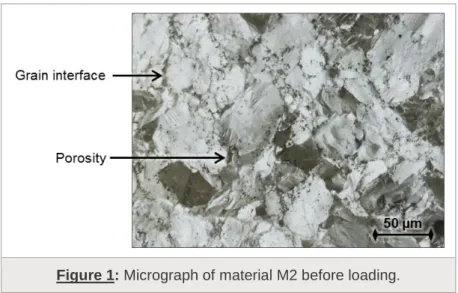
can be machined. This compaction process eliminates most of the initial porosity, resulting in a quasi-brittle material with a polycrystalline microstructure of characteristic size around 50 µm.
TATB crystals being strongly anisotropic, optical microscopy (figure 1) reveals a variation of colours. Grain orientations and binder locations being random by distribution, the material is initially isotropic on the macroscopic scale.
Thermomechanically speaking, experiments (compressive and tensile tests, triaxial compressions and dynamic mechanical analysis) have shown that M2 is a viscoelastic material with temperature-, pressure- and strain rate-dependencies. Moreover, M2 develops irreversible strains during a compressive loading.
Few years ago, the CEA and the Gabriel LaMé mechanical laboratory proposed a first constitutive law. This law deals with a generalised Kelvin-Voigt viscoelastic model combined with an isotropic damage, a viscoplasticity flow rule with isotropic hardening, and a yield stress depending on the confinement. Failure (which is considered here to be at the maximal stress) is treated by two uncoupled equations: one linking the maximum positive principal strain to pressure, when the other one is based on the maximum positive effective principal stress.
Parameters have been determined from DMA measurements and compressive tests with cyclic loading at 20°C and 50°C, and at 20°C under a 10 MPa triaxial pressure. Comparisons between model and experimental data have shown an under-estimation of the transversal strains. Strain-induced anisotropy could be the reason of such differences.
2
Figure 1: Micrograph of material M2 before loading.
Strain-induced anisotropy in some aggregate or granular materials
3.
Because of its microstructure and its quasi-brittle behaviour, the material M2 can be compared to concretes and geomaterials. Literature reports several experiments showing strain-induced anisotropy in these materials.
At the beginning of the 1990s, Mazars, Berthaud and Ramtani [1] made some alternated tensile/compressive tests on a concrete. They observed a stiffness recovery at the beginning of the compression. This phenomenon, called unilateral effect, is interpreted considering a network of cracks in the material. When cracks open in traction and increase in density, there is a stiffness loss and so a decrease of the elastic modulus. At the opposite, when cracks are compressed and closed, a stiffness recovery is obtained. With this interpretation, the influence of cracks on the behaviour depends on their orientation. It implies an anisotropy due to damage.
Shortly after, Gotuwka and co-workers [2][3] characterized three different concretes. To do so, they carried out some compressive cyclic loadings. Each cycle was composed by three steps: loading, stress relaxation at fixed strain and partial unloading of 40 MPa. They considered the secant modulus, between the relaxation-end and the unload-end, as elastic. They showed a higher decrease of the transversal modulus than of the longitudinal one. This observation was interpreted as anisotropy on the elastic moduli evolutions. Gotuwka and co-workers concluded to an anisotropic damage for these concretes, cracks preferentially spreading along the loading direction.
At the same time, efforts were made to characterize geomaterials, particularly in France at the Mechanical Institute of Grenoble. Cambou, Lanier and colleagues studied the induced anisotropy of a dense Hostun sand [4] and a dry one [5]. For these sands, they emphasized a strain-induced anisotropy making two successive loads with intermediate unload. Samples were submitted to the same first compressive loading, the direction of the second loading changing depending on the samples. The aim was to see the first loading influence on the second one. Data showed an increase of the sample stiffness in the direction initially compressed, whereas the ductility increased in the initial expansion directions. According to the authors, the load-induced anisotropy observed can be modelled by an elastoplastic law with kinematic hardening.
Le and co-workers [6] characterized the CEA explosive composition “M1” in the quasistatic
domain. This material is a HMX-based PBX whose fabrication process is likely the same than M2, the two materials morphology being similar. Analysing the experimental results, they noticed that the ratio of elastic strain evolves during loading and that the transversal modulus decreases faster than the longitudinal one. A dilatancy mechanism being not able to explain this phenomenon, an anisotropic evolution of the damage was assumed.
Benelfellah and co-workers [7] made an in-depth study of the induced anisotropy of M1. Elastic secant moduli degradation in the longitudinal and transversal directions was compared from compressive cyclic loadings. Making alternated tensile/compressive tests, the unilateral effect due to damage was highlighted.
3
Thus, experimental tests made on concretes, on sand and on the M1 PBX emphasize a strain-induced anisotropy. Two models were proposed in the literature to interpret data: (1) a constitutive law based on an anisotropic damage by microcracking (used for concretes and M1) or (2) an anisotropy linked to a kinematic hardening for sands.
We want to characterize the strain-induced anisotropy of M2 and if this anisotropy could be modelled as a consequence of damage or plasticity. Optical microscopy analysis being hardly tractable for small strain, we carry out macroscopic experimental testings inspired by those described above.
Experimental study of the strain-induced anisotropy
4.
An experimental campaign of alternated tensile/compressive tests, inspired by Mazars and co-workers [1] and by Benelfellah and co-workers [7],has been carried out on M2. Two tests were done: (1) a compression up to 30 MPa (~ 0.95 σmax, where σmax is the maximal compressive stress) followed
by a tensile loading to failure and (2) a traction up to 7 MPa (~ 0.95 σmax, where σmax is the maximal
tensile stress) followed by a compressive loading to failure.
Dog-bone-shape samples with a central volume of 10 mm in diameter and 20 mm in height were used. Glue helped to stick the samples to the horizontal platens of the machine. Two longitudinal gauges and two transversal ones measured strains. The strain rate of 10-5 s-1 was applied on one of the longitudinal strain gauge.
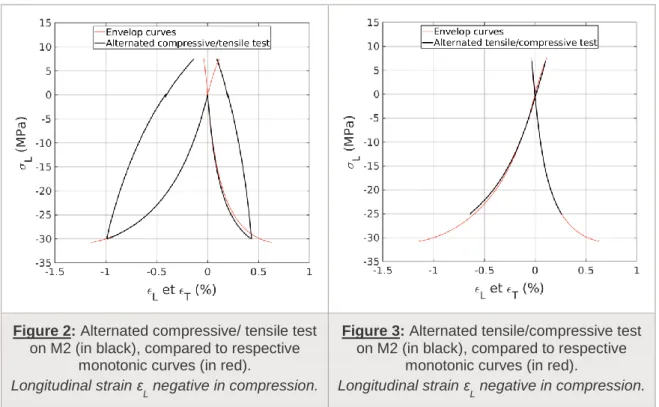
The curves are given on figures 2 and 3. εL (respectively εT) is the mean of the two longitudinal (respectively transversal) strains. σ is the longitudinal stress, positive in traction and negative in compression, measured by the machine strength cellule.
Experimental data don’t reveal a stiffness recovery (no unilateral effect) when stress sign changes. However, viscosity of the material may smooth the curves and hide the phenomenon. Therefore, M2 stiffness recovery would be low to negligible.
Figure 2: Alternated compressive/ tensile test
on M2 (in black), compared to respective monotonic curves (in red).
Longitudinal strain ε
L negative in compression.
Figure 3: Alternated tensile/compressive test
on M2 (in black), compared to respective monotonic curves (in red).
Longitudinal strain ε
L negative in compression.
Cyclic tests correspond to compressive tests during which loading cycles were realized. Benouniche [8] made cycles including three steps: loading, unloading and strain recovery. Cycles done by Gotuwka [2] were a little bit different: loading, stress relaxation and unloading. Le and
co-4
workers [6] and Benelfellah and co-workers [7] made four steps: loading, stress relaxation, unloading and strain recovery. We followed this last process. Experiments were carried out without lateral confinement or under a 10 MPa pressure. Cylindrical samples of 10 mm in diameter and 20 mm in height were used. They were put between two compressive platens without lubrication. Two longitudinal gauges and two transversal ones measured the strains. The strain rate of 10-5 s-1 was controlled on one of the longitudinal strain gauge.
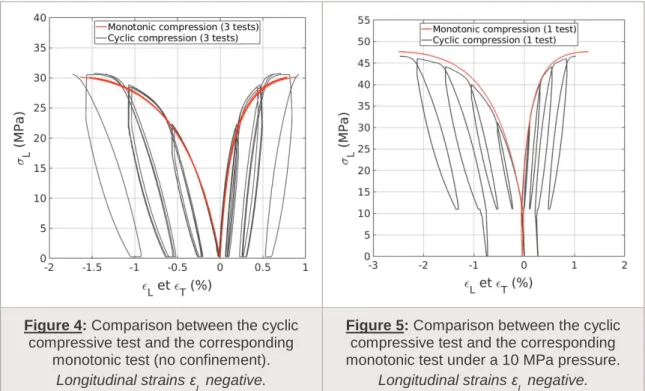
Comparisons between cyclic compressive test curves and the corresponding monotonic curve are presented on figures 4 and 5. Monotonic tests were made using the same experimental conditions. ε
L
(respectively ε
T) is the mean of the two longitudinal (respectively transversal) strains. σ is the
longitudinal stress, here taken positive in compression. According to the graphs, the envelop curves of tests with cycles are similar to the monotonic curves. So cycles don’t influence the envelop behaviour of M2 in compression.
Adding cycles gives a lot of information on the mechanical behaviour. Relaxation and recovery stages help to cancel the viscous effects. Furthermore, strains at recovery end correspond to the irreversible strains and give information about plasticity.
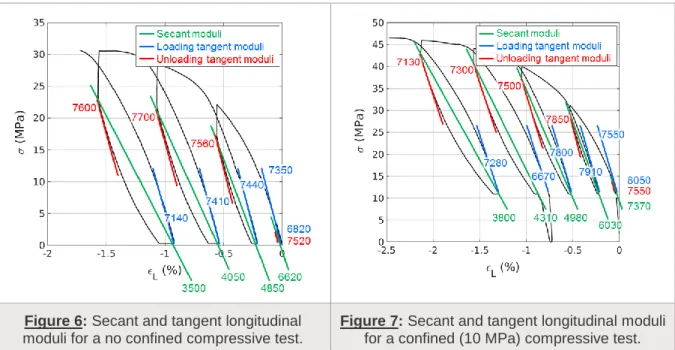
Let’s now suppose there is no plasticity when unloading. Consequently, for each cycle, the secant modulus between the relaxation-end and the recovery-end is elastic (green lines on figures 6 and 7). Thus loading cycles enable estimating the evolution of the elastic moduli and quantifying the material damage.
We can also estimate elastic tangent apparent moduli. Let’s assume stress state goes back inside the elastic domain when loading direction is reversing. Elastic tangent moduli are calculated at load (blue lines on figures 6 and 7) and unload (red lines) beginnings by linear regression with a 0.05% longitudinal strain window.
Tangent and secant moduli are compared on figure 6 (unconfined test) and figure 7 (confined test). The two methods give very different results. The tangent moduli (blue and red) are equal to the initial Young’s modulus. Thus, we claim that they still represent elasticity and, as a consequence, damage can be neglected. That implies that secant moduli (green) are not elastic and that some plasticity may develop during unloading.
Let us now detail another experimental campaign which will help to understand the causes of the strain-induced anisotropy of M2.
Figure 4: Comparison between the cyclic
compressive test and the corresponding monotonic test (no confinement).
Longitudinal strains εL negative.
Figure 5: Comparison between the cyclic
compressive test and the corresponding monotonic test under a 10 MPa pressure.
5
Figure 6: Secant and tangent longitudinal
moduli for a no confined compressive test.
Figure 7: Secant and tangent longitudinal moduli
for a confined (10 MPa) compressive test.
Inspired by the work of Cambou and Lanier [4][5], an experimental campaign of double compressions on cubic samples was done on M2. The aim was to see the influence of a first load on a second one. First, the samples, which were 20 mm-side cube, were compressed up to 30 MPa (95% of the maximal stress). After unloading and a recovery phase of several hours, samples were subjected to another compressive test, either in the same direction than the first one (« 0°-0° compression », see figure 8), or in an orthogonal direction (« 0°-0°-90°-0° compression», see figure 9). The strain rate was controlled by the cross head speed at 10-2 mm.s-1 (equivalent to 10-5 s-1 on the sample). Strains were measured by only one longitudinal and one transversal gauges. To avoid a “barrel effect” on samples because of friction at interfaces, lubricated Teflon was placed between the samples and the compressive platens. Displacement homogeneity was checked by digital image correlation (figure 10-b).
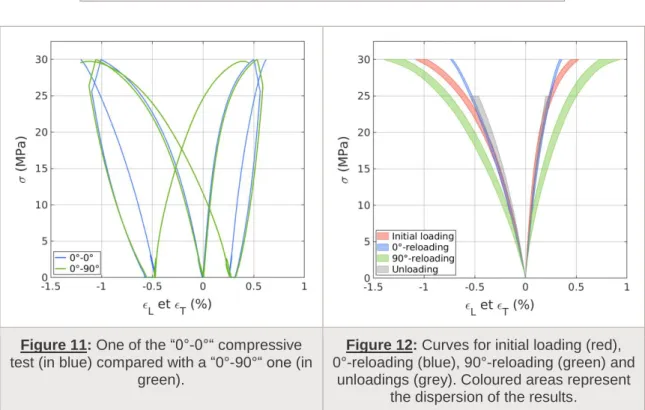
Curves of two representative tests are reported on figure 11. The first part of the curves is similar since it corresponds to the same initial load. Next, the blue curve (respectively the green curve) shows the behaviour of M2 when submitted to a compression in the same direction (respectively in an orthogonal direction). The two samples failed at the same strain-stress values so the failure criterion seems to be independent of load history.
As Cambou and Lanier [4], we have compared on figure 12 the loading curves reinitialising strains at the beginning of each loading. We have added also the “returned” unload curves. Coloured areas represent the results dispersion of the three tests realized for each operating procedure. So, figure 12 shows:
- initial loading in red, corresponding to the first load to 30 MPa of figure 11,
- reloading at 0° in blue, corresponding to the second part of the blue curve of figure 11, - reloading at 90° in green, corresponding to the second part of the green curve of figure 11, - all unloadings (returned) in grey.
Looking at figure 12, one can see different reloading curves in blue and in green. The anisotropy induced by the first load is evident. The direction of the sample which had seen an expansion (90° direction, green curve) is more ductile than initially. Conversely, the direction submitted to a compression (0° direction, blue curve) increases in rigidity. These experimental results are qualitatively the same as Cambou and Lanier [4] on Hostun sand. Furthermore, according to the figure 12, unloading curves (in grey) are all the same and they are superposed on the 0°-reloading area.
Lastly, let’s note that all curve-foots are superposed up to 5 MPa. That means the M2 viscoelastic behaviour is history-independent. One more time, damage has not been detected. We can also notice that the 0°-reloading (blue) and the initial loading (red) have superposed areas up to 15 MPa. Same phenomena were observed by Cambou and Lanier.
6
Figure 8: Schema of the compressive test called “0°-0°”.
Figure 9: Schema of the compressive test called “0°-90°”.
Figure 10: Transversal displacement field of a sample compressed at
30 MPa, a) without lubrication at interfaces, b) with Teflon and lubrication at interfaces (unit: pixel).
Figure 11: One of the “0°-0°“ compressive
test (in blue) compared with a “0°-90°“ one (in green).
Figure 12: Curves for initial loading (red),
0°-reloading (blue), 90°-reloading (green) and unloadings (grey). Coloured areas represent
the dispersion of the results.
a)
0 1 2 3 -1 -2 -3b)
0 1 2 3 -1 -2 -37
The material behaviour observed with this experimental campaign can be interpreted using a plastic flow model with a kinematic hardening. During a 0°-0° test (top of figure 13), the initial loading displaces the plasticity surface to 30 MPa. Then, unloadings and 0°-reloading remain inside this surface and an elastic response is obtained. During a 0°-90° test (bottom of figure 13), the initial load displaces the plasticity surface in such a way that the yield stress decreases in the 90° direction. Since σY1<σY0, there is more plasticity during the 90°-reloading than during the first loading. Then, plasticity surface is bringing up to 30 MPa in the new direction, the last unloading being elastic.
Thus, in this interpretation all unloadings and the 0°-reloading are elastic (and so similar). Moreover, the initial compression yields lower plastic strain than the 90°-reloading. It corresponds to what was experimentally observed on M2.
However, to properly apply this theory to our case, the zero-stress point must stay into the plasticity surface, implying an initial yield stress higher than 0.5*σmax thus 15 MPa. If this condition is not
satisfied, unloading at 90° would be different from the other unloading curves. However, the assumption of elastic unloading has been previously refuted. Nevertheless, if unloadings from cyclic compression of cylindrical samples (ø10h20 geometry) get some plastic flow, it may be possible that for cubes an artificial confinement induced an artificial increase of the yield stress even if the contact areas were lubricated. This paradox will be studied in a close future.
Figure 13: Interpretation of the M2 behaviour in 0°-0°
compressive test (top) and in 0°-90° compressive test (bottom) using a model with a kinematic hardening.
Conclusion
5.
Experimental campaigns realized on M2 have shown that the elastic moduli are constant during loading. Compressing samples twice in the same direction induces an increase of the stiffness. Moreover, curve-foots were always the same whatever the confinement and the loading history. All these observations lead us to conclude that damage can be neglected for M2. Thus, the strain-induced anisotropy has been interpreted as a consequence of a kinematic hardening.
To go on with the thermomechanical characterization of M2, researches have to be oriented toward plasticity. Experimental researches on the initial plasticity surface and on the hardening rule will be done using compression/traction/torsion multiaxial tests.
8
Thanks
6.
This study has been carried out within the framework of the Corresponding Research Laboratory gathering the CEA and the mechanical laboratory Gabriel LaMé.
Bibliographie
7.
[1] MAZARS J., BERTHAUD Y., RAMTANI S. (1990) – The unilateral behaviour of damaged concrete. Engineering Fracture Mechanics Vol. 35, n°4/5, pp. 629-635.
[2] GOTUWKA V. (1999) – Etude expérimentale du comportement mécanique des Bétons à Très Hautes Performances sous sollicitations multiaxiales simples et complexes. PhD thesis, Université de Lille I. (In French)
[3] GOTUWKA V., SIWAK J.-M., KONDO D. (1999) – Study of concrete under combined shear compression loading, evaluation of cracking tangential stress. Materials and Structure Vol. 32, pp.445-451.
[4] CAMBOU B., LANIER J. (1988) – Induced anisotropy in cohesionless soil: experiments and modelling. Computers and Geotechnics Vol. 6, pp. 291-311.
[5] LANIER J., DI PRISCO C., NOVA R. (1991) – Etude expérimentale et analyse théorique de l’anisotropie induite du sable d’Hostun. Revue Française de Géotechnique, n°57, pp. 59-74. (In French)
[6] LE V.D., GRATTON M., FRACHON A., CALIEZ M., PICART D. (2010) – Experimental mechanical characterization of plastic-bonded explosives. Journal of Materials Science Vol. 45, pp. 5802-5813.
[7] BENELFELLAH A. FRACHON A., GRATTON M., CALIEZ M., PICART D. (2013) – Anisotropic
damage model with unilateral effect and sliding friction for brittle materials. Design and Modeling of Mechanical Systems, Lectures Note on Mechanical Engineering, pp. 431-438.
[8] BENOUNICHE S. (1979) – Modélisation de l’endommagement du béton par microfissuration en