HAL Id: tel-02109003
https://tel.archives-ouvertes.fr/tel-02109003
Submitted on 24 Apr 2019
HAL is a multi-disciplinary open access archive for the deposit and dissemination of sci-entific research documents, whether they are pub-lished or not. The documents may come from teaching and research institutions in France or
L’archive ouverte pluridisciplinaire HAL, est destinée au dépôt et à la diffusion de documents scientifiques de niveau recherche, publiés ou non, émanant des établissements d’enseignement et de recherche français ou étrangers, des laboratoires
continental hydrology cycle in the lower Mekong basin
over the last two decades
Binh Pham-Duc
To cite this version:
Binh Pham-Duc. Satellite remote sensing of the variability of the continental hydrology cycle in the lower Mekong basin over the last two decades. Hydrology. Sorbonne Université, 2018. English. �NNT : 2018SORUS024�. �tel-02109003�
ÉCOLE DOCTORALE DES SCIENCES DE L’ENVIRONNEMENT D’ILE DE FRANCE
SATELLITE REMOTE SENSING OF THE
VARIABILITY OF THE CONTINENTAL
HYDROLOGY CYCLE IN THE LOWER MEKONG
BASIN OVER THE LAST TWO DECADES
PRÉSENTÉE PAR
Binh PHAM-DUC
THÈSE DE DOCTORAT DE SCIENCES DE L’ENVIRONNEMENT
DIRECTRICE DE RECHERCHE: Catherine PRIGENT CO-DIRECTEUR DE RECHERCHE: Filipe AIRES
PRÉSENTÉE ET SOUTENUE PUBLIQUEMENT LE 6 FÉVRIER, 2018 DEVANT UN JURY COMPOSÉ DE:
Agnès DUCHARNE METIS/CNRS-UPMC Présidente Stéphane JACQUEMOUD U. PARIS DIDEROT Rapporteur Thanh NGO-DUC USTH/VAST Rapporteur Sylvain BIANCAMARIA LEGOS/CNRS Examinateur Selma CHERCHALI CNES Examinatrice Catherine PRIGENT LERMA/CNRS Directrice de thèse Filipe AIRES LERMA/CNRS Co-Directeur de thèse
Les eaux superficielles sont nécessaires à toute forme de vie en tant que parties intégrantes de tout processus de vie sur Terre. Quantifier les eaux de surface et suivre leurs variations est primordiale en raison du lien direct qui existe en-tre les variables hydrologiques et le changement climatique. La télédétection par satellite, de l’hydrologie continental offre l’opportunité unique d’étudier, depuis l’espace, les processus hydrologiques à différentes échelles (régionale et glob-ale). Dans cette thèse, différentes techniques ont été développées afin d’étudier les variations des eaux superficielles ainsi que d’autres variables hydrologiques, au niveau du bassin inférieur du Mékong (entre le Vietnam et le Cambodge) et ce en utilisant plusieurs estimations satellitaires différentes. Cette thèse s’articule autour de quatre points principaux.
Premièrement, l’utilisation d’observations satellitaires dans le visible et dans l’infra-rouge (MODIS) est étudiée et comparée afin d’évaluer les eaux de surface au niveau du bassin inférieur du Mékong. Quatre méthodes de classification ont été utilisées afin de différencier les types de surface (inondés ou pas) dans le bassin. Les différentes méthodes ont donné des cartes d’eaux de surface aux résultats semblables en terme de dynamique saisonnière. La classification la plus adaptée aux régions tropicales a été ensuite choisie pour produire une carte des eaux de surface à la résolution de 500 m entre janvier 2001 et aujourd’hui. La compara-ison des série temporelles issues de cette carte et de celles issues du produit de référence MODIS donne une forte corrélation temporelle (> 95%) pour la période 2001-2007.
Deuxièmement, l’utilisation des observations issues du satellite SAR Sentinel-1 est examinée à des fins identiques. L’imagerie satellitaire optique est ici remplacée
permettent de « voir » à travers les nuages. Un jeu d’images Landsat-8-sans-nuage est alors utilisé pour entraîner un Réseau de Neurones (RN) afin de restituer des cartes d’eaux de surface par l’utilisation d’un seuillage sur les sortie du mod-èle RN. Les cartes sont à la résolution spatial de 30 m et disponibles depuis jan-vier 2015. Comparées aux cartes de référence Landsat-8-sans-nuage, les sorties de modèles RN montre une très grande corrélation (90%) ainsi qu’une détection "vrai" à 90%. Les cartes restituées d’eaux de surface utilisant la technologie SAR sont enfin comparées aux cartes d’inondation issues de données topographiques. Les résultats montrent une fois encore une très grande consistance entres les deux cartes avec 98% des pixel considérer comme inondées dans cartes SAR se trou-vant dans les région de très grande probabilité d’inondation selon la topographie (>60%).
Troisièmement, la variation volumique des eaux de surface est calculée comme le produit de l’étendue de la surface avec la hauteur d’eau. Ces deux variables sont validées à l’aide d’autres produits hydrologiques et montrent de bons résul-tats. La hauteur d’eau superficielle est linéairement interpolée aux régions non inondées afin de produire des cartes mensuelles à la résolution spatiale de 500 m. La hauteur d’eau est ensuite analysée pour estimer les variations volumiques. Ces résultats montrent une très bonne corrélation avec la variation volumique in-duite par la mesure du contenu en eau du satellite GRACE (95%) ainsi qu’avec la variation des mesures in situ de débit des rivières.
Finalement, deux produits globaux et multi-satellites d’eaux superficielles sont comparés à l’échelle régionale et globale sur la période 1993-2007: GIEMS et SWAMPS. Lorsqu’elles existent, les données auxiliaires sont utilisées afin de renforcer l’analyse. Les deux produits montrent une dynamique similaire, mais 50% des pixels inondés dans SWAMPS se trouvent le long des côtes. Pour les bassins de l’Amazonie et de l’Orénoque, GIEMS and SWAMPS montrent de très grandes corrélations (respec-tivement 95% et 99%), mais le maximum d’étendue d’eau de surface est moitié moins dans SWAMPS que dans GIEMS et/ou SAR. De plus SWAMPS ne rend pas compte de la dynamique des eaux de surface pour le bassin du Niger et son estimation de la saison s’y trouve déphasée aussi bien avec les estimations issues de GIEMS et MODIS qu’avec les données in situ de débit du Niger.
Surface water is essential for all forms of life since it is involved in almost all processes of life on Earth. Quantifying and monitoring surface water and its vari-ations are important because of the strong connections between surface water, other hydrological components (groundwater and soil moisture, for example), and the changing climate system. Satellite remote sensing of land surface hydrol-ogy has shown great potential in studying hydrolhydrol-ogy from space at regional and global scales. In this thesis, different techniques using several types of satellite estimates have been made to study the variation of surface water, as well as other hydrological components in the lower Mekong basin (located in Vietnam and Cambodia) over the last two decades. This thesis focuses on four aspects.
First, the use of visible/infrared MODIS/Terra satellite observations to monitor surface water in the lower Mekong basin is investigated. Four different classifi-cation methods are applied, and their results of surface water maps show similar seasonality and dynamics. The most suitable classification method, that is spe-cially designed for tropical regions, is chosen to produce regular surface water maps of the region at 500 m spatial resolution, from January 2001 to present time. Compared to reference data, the MODIS-derived surface water time series show the same amplitude, and very high temporal correlation for the 2001-2007 period (> 95%).
Second, the use of SAR Sentinel-1 satellite observations for the same objective is studied. Optical satellite data are replaced by SAR satellite data to benefit the abil-ity of their microwave wavelengths to pass through clouds. Free-cloud Landsat-8 satellite imagery are set as targets to train and optimize a Neural Network (NN).
ied region from January 2015 to present time, by applying a threshold (0.85) to the output of the NN. Compared to reference free-cloud Landsat-8 surface water maps, results derived from the NN show high spatial correlation (∼90%), as well as true positive detection of water pixels (∼90%). Predicted SAR surface water maps are also compared to floodability maps derived from topography data, and results show high consistency between the two independent maps with 98% of SAR-derived water pixels located in areas with a high probability of inundation (>60%).
Third, the surface water volume variation is calculated as the product of the sur-face water extent and the sursur-face water height. The two components are validated with other hydrological products, and results show good consistencies. The sur-face water height are linearly interpolated over inundated areas to build monthly maps at 500 m spatial resolution, then are used to calculate changes in the surface water volume. Results show high correlations when compared to variation of the total land surface water volume derived from GRACE data (95%), and variation of the in situ discharge estimates (96%).
Fourth, two monthly global multi-satellite surface water products (GIEMS & SWAMPS) are compared together over the 1993-2007 period at regional and global scales. Ancillary data are used to support the analyses when available. Similar tempo-ral dynamics of global surface water are observed when compared GIEMS and SWAMPS, but ∼50% of the SWAMPS inundated surfaces are located along the coast line. Over the Amazon and Orinoco basins, GIEMS and SWAMPS have very high water surface time series correlations (95% and 99%, respectively), but SWAMPS maximum water extent is just a half of what observed from GIEMS and SAR estimates. SWAMPS fails to capture surface water dynamics over the Niger basin since its surface water seasonality is out of phase with both GIEMS- and MODIS-derived water extent estimates, as well as with in situ river discharge data.
Keywords: Satellite remote sensing, surface water monitoring, surface water height,
surface water volume, discharge, precipitation, MODIS, Landsat, Sentinel-1, EN-VISAT, Mekong Delta.
• Binh Pham-Duc, Catherine Prigent, Filipe Aires, Fabrice Papa, Comparisons of global terrestrial surface water datasets over 15 years. Journal of Hydromete-orology 04/2017. DOI:10.1175/JHM-D-16-0206.1
• Filipe Aires, Leo Miolane, Catherine Prigent, Binh Pham-Duc, Etienne Fluet-Chouinard, Bernhard Lehner, Fabrice Papa, A global dynamic long-term in-undation extent dataset at high spatial resolution derived through downscaling of satellite observations. Journal of Hydrometeorology 05/2017. DOI:10.1175/JHM-D-16-0155.1
• Binh Pham-Duc, Catherine Prigent, Filipe Aires, Surface water monitoring within Cambodia and the Vietnamese Mekong Delta over a year, with Sentinel-1 SAR observations. Water 05/2017. DOI:10.3390/w9060366
The last three years have been a time of tremendous learning and growth for me professionally and personally. This thesis would not have been possible without the support, guidance and motivation from my supervisors, colleagues, thesis committee, friends, and family.
I owe my deepest gratitude to my supervisor, Dr. Catherine Prigent, for the con-tinuous support of my PhD study and related researches, for her patience, mo-tivation, and immense knowledge. Her guidance helped me in all the time of research and writing of this thesis. As well, I would like to express my sincere thanks and immense pleasure to my co-supervisor, Dr. Filipe Aires, for his scien-tific guidance, consistent support, and encouragement throughout the duration of my PhD.
I would like to thank to my colleagues whom I have been working with over the years, especially, Frédéric Frappart, Fabrice Papa, Victor Pellet, Xiaoni Wang, Jordane Mathieu, Lise Kilic, Die Wang, Evan Eames, and Duy Ba Nguyen. Their comments, corrections and suggestions contributed greatly to my work. It has been also a great pleasure working with them.
I am deeply grateful to my thesis committee: Prof. Stéphane Jacquemoud and Assoc. Prof. Thanh Ngo Duc, for their insightful comments and encouragement. The quality of my thesis has been largely improved thank to their interest and valuable scientific questions and suggestions.
To all my friends, thank you for wonderful time we shared that made my years in Paris become unforgettable.
the years. To my parents and in-laws, thank you for your unconditional love that inspire me to follow my dreams. To little my brother, thank you for being there taking care of our parents when I was not available. I owe my special thanks to my beloved wife and little daughter for their continued and unfailing love, understanding, support and kindness. A few words cannot express how grateful I am to my family, but this thesis would not have been possible without their support.
This thesis is dedicated to my wife and my little daughter.
Abstract v
Publications vi
Acknowledgment ix
Contents x
1 Introduction 1
1.1 Land surface remote sensing from satellites . . . 3
1.1.1 The need for satellite observations . . . 3
1.1.2 The atmospheric transmission windows. . . 4
1.2 Hydrological cycle from space . . . 6
1.2.1 Estimation of continental surface water extent from space . 7 1.2.1.1 Visible and Near-Infrared (NIR) observations . . . 7
1.2.1.2 Active microwave observations . . . 8
1.2.1.3 Passive microwave observations. . . 9
1.2.2 Estimation of surface water height from space . . . 9
1.2.3 Estimation of other hydrological components from space . . 10
1.3 The study area: The Vietnam Mekong Delta and the Tonle Sap Lake in Cambodia . . . 11
1.3.1 Presentation of the region . . . 11
1.3.2 The satellite remote sensing studies so far over the region . 14 1.4 Thesis objectives . . . 14
2 Surface Water Monitoring within the Mekong Delta and Cambodia us-ing Visible and Infrared MODIS Satellite Observations 17 2.1 Introduction . . . 19
2.2 Different methodologies using MODIS/Terra observations for sur-face water monitoring . . . 23
2.2.1 MODIS/Terra observations . . . 23
2.2.2 Sakamoto et al. [2007] methodology . . . 25
2.2.4.1 Unsupervised classification . . . 28
2.2.4.2 Supervised classification . . . 30
2.2.4.3 Hybrid classification . . . 31
2.3 MOD09A1 pre-processing . . . 32
2.3.1 MOD09A1 quality and reliability checking . . . 32
2.3.2 Smoothing method selection . . . 35
2.4 Results . . . 36
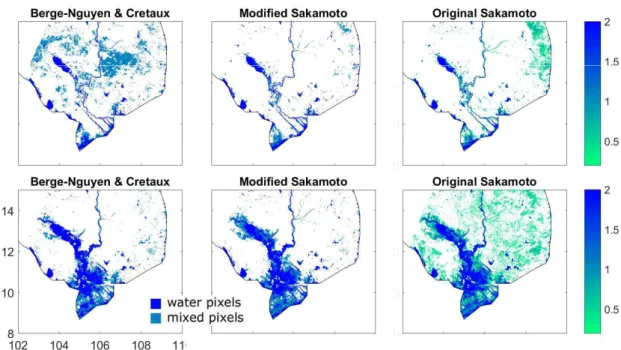
2.4.1 Comparing Sakamoto et al. [2007] and Bergé-Nguyen and Crétaux [2015] methodologies . . . 36
2.4.2 Comparing unsupervised and supervised methodologies. . 38
2.4.3 Expanding Sakamoto methodology . . . 41
2.5 Discussions and conclusions . . . 42
3 Surface Water Monitoring within the Mekong Delta and Cambodia us-ing SAR Sentinel-1 Satellite Observations 45 3.1 Introduction . . . 47
3.2 Sentinel-1 SAR data and the ancillary datasets . . . 50
3.2.1 Sentinel-1 SAR data . . . 50
3.2.2 Ancillary datasets. . . 52
3.2.2.1 Inundation maps derived from Landsat-8 data . . 52
3.2.2.2 Inundation maps derived from MODIS/Terra data 53 3.3 Methodology . . . 55
3.3.1 Surface water information from the Sentinel-1 SAR images . 55 3.3.2 A Neural Network-based classification . . . 57
3.3.3 NN sensitivity tests. . . 60
3.3.3.1 Selection of an optimized threshold for the NN output . . . 61
3.3.3.2 Equalization of water and non-water pixel number 62 3.3.3.3 Analyzing the weight of each NN satellite input . 63 3.4 Results and comparisons with other surface water products . . . . 66
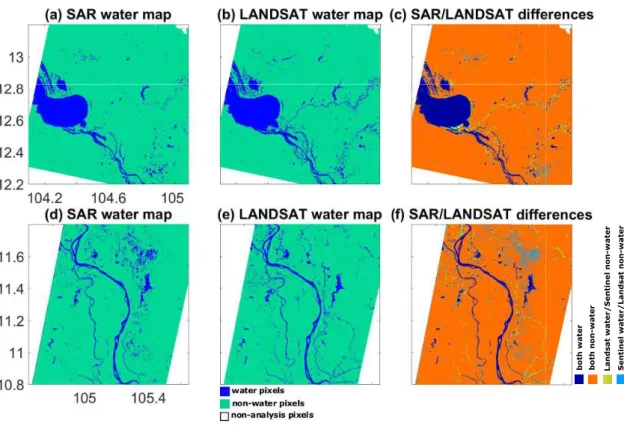
3.4.1 Evaluation of the SAR NN classification method with Landsat-8 images . . . 67
3.4.2 Evaluation using a topography-based floodability index . . 70
3.4.3 Comparisons with MODIS/Terra-derived inundation maps 72 3.5 Improvement of the Neural Network . . . 74
3.5.1 Performance comparisons between NN5 and NN7 . . . 76
3.6 Conclusions and perspectives . . . 79
4 Toward the analyses of the change in surface water volume within the lower Mekong Delta 83 4.1 Introduction . . . 85
4.2.2 GRACE data. . . 87
4.2.3 In situ water level and river discharge data . . . 88
4.2.4 Precipitation data . . . 89
4.2.5 The El Niño-Southern Oscillation index . . . 89
4.3 Evaluations of the MODIS-derived surface water extent . . . 90
4.3.1 Comparison with SAR-derived surface water extent . . . 91
4.3.2 Comparison with precipitation data . . . 93
4.3.3 Comparison with in situ water level data . . . 94
4.3.4 Comparison with the Multivariate ENSO Index . . . 95
4.4 Surface water height from altimetry data . . . 96
4.4.1 The principle of radar satellite altimeter . . . 96
4.4.2 Satellite-based surface water height estimations along the Mekong River . . . 98
4.4.3 Evaluations of satellite-based surface water height data . . . 100
4.4.3.1 Comparison with other studies . . . 100
4.4.3.2 Comparison with in situ water level data. . . 102
4.4.4 Interpolated surface water height maps . . . 104
4.5 Surface water volume variations . . . 106
4.5.1 Comparison between MODIS-derived surface water extent and satellite-based surface water height . . . 106
4.5.2 Methodology . . . 107
4.5.3 Results . . . 107
4.6 Discussions and conclusions . . . 108
5 Comparisons between Global Terrestrial Surface Water Datasets 111 5.1 Introduction . . . 113
5.2 Data . . . 115
5.2.1 GIEMS . . . 115
5.2.2 SWAMPS . . . 117
5.2.3 GLWD . . . 117
5.2.4 Other ancillary datasets . . . 118
5.3 Comparisons of the surface water datasets . . . 119
5.3.1 Global comparisons . . . 119
5.3.2 Basin-scale comparisons . . . 124
5.3.2.1 Comparisons over the lower Mekong basin . . . . 124
5.3.2.2 Comparisons over the Amazon basin . . . 126
5.3.2.3 Comparisons over the Orinoco basin . . . 128
5.3.2.4 Comparisons over the Niger basin . . . 130
5.3.2.5 Comparisons over the Ganges basin . . . 134
5.4 Discussions . . . 139
5.5 Conclusions . . . 141
6 Conclusions and Perspectives 143 6.1 Conclusions . . . 145
6.1.1 Surface water monitoring with visible/infrared MODIS satel-lite observations . . . 145
6.1.2 Surface water monitoring with SAR Sentinel-1 satellite ob-servations . . . 146
6.1.3 Toward the variation of the surface water volume . . . 147
6.1.4 Comparisons between two global terrestrial surface water datasets . . . 148
6.1.5 Other activities during my PhD . . . 149
6.1.5.1 Participation to another paper . . . 149
6.1.5.2 Teaching experience . . . 149
6.2 Perspectives . . . 150
6.2.1 Surface water monitoring over the Vietnam Red River Delta 150 6.2.2 Closure of the water cycle over the Mekong Delta and Cam-bodia . . . 153
6.2.3 The future with the SWOT and JV-LOTUSat satellites . . . . 154
A Paper A: 157
B Paper B: 181
1.1 Land surface remote sensing from satellites
1.1.1 The need for satellite observations
Earth remote sensing, by definition, is the science of acquiring information about the Earth without actually being in contact with it. This is done by sensing and recording reflected or emitted energy and processing, analyzing, and applying that information [CCMEO, 2013]. Satellite remote sensing started in 1960s after Sputnik-1, the world first man-made satellite, that was launched into space by the Soviet Union on 4 October 1957. Since then, satellite technology has devel-oped quickly, especially over the last few decades, providing valuable knowl-edge for numerous fields of Earth sciences (for example, geography, oceanogra-phy, glaciology, forestry, agriculture, and hydrology).
Applications of satellite remote sensing focusing on land surface hydrology began with the successful launch of the first Earth Resources Technology Satellite (ERTS-1, later renamed as Landsat-1) on 23 July 1972. It opened a new era for hydrological studies since scientists had a new source of valuable satellite obser-vations useful for researches of hydrological dynamics and processes [Pietroniro and Prowse, 2002]. Compared to hydrological data provided by in situ measure-ments, satellite remote sensing observations have obvious advantages. First, in situ measurements can provide longer data records, however, they contain lim-ited information about the spatial dynamics of hydrological parameters (surface water, for instance). In contrast, satellite observations can provide not only re-gional, but also global observations at different wavelengths and spatial resolu-tions, with uniform quality and rapid data acquisition. Second, the distribution of the stream gauge network is not uniform, very dense in developed countries (in the US, for example), but very sparse in developing countries (especially in African countries), or even not available in remote areas [Alsdorf et al., 2007]. Satellite observations can access to remote or inaccessible areas, and provide reg-ular observations all over the globe. Third, in situ measurements are often un-available for scientific purposes due to geopolitical reasons, but satellites can ac-quire information over countries that are not willing to share data (that is very important for military applications). For these reasons, nowadays, in situ data
are normally used for calibration and validation of methodologies using land surface satellite observations. Despite all these advantages, satellite remote sens-ing has limitations. A satellite system is very expensive, and it takes a long and complicated process to develop, build, test, launch and operate the system. As a consequence, many countries have their own satellites with the ability to provide observations, but only a few countries can master satellite technology (the US, Russia, Japan, France, German, Italy, India, etc). Different satellites provide dif-ferent spatial resolutions, and the applications can be affected due to large uncer-tainties and errors in the measurements. It is also difficult for data interpretation, especially with radar images.
In land surface satellite remote sensing, there are two types of sensors: passive and active. Depending on the observed surfaces, the interactions between the sur-faces and passive/active sensors will be different. Passive sensors measure sun-light radiation reflected from the Earth surfaces, or thermal radiation naturally emitted from objects. Active sensors create their own electromagnetic energy that is transmitted from the sensor toward the target to be investigated. The incoming energy interacts with the target producing a backscattered energy that is reflected back to the sensor for measurements. Observations acquired by measuring sur-face reflectance from the Sun is known as optical observations. Therefore, optical imagery relies on the Sun, and can be subjected to the presence of clouds. Optical observations are often used for applications related to surface water monitoring, disaster monitoring, inundation mapping, or land surface change detection [Owe et al.,2001]. Active sensors emit radar beams that are not blocked by clouds, and radar imagery can be acquired at any time, under all weather conditions and are independent from the Sun [Owe et al.,2001].
1.1.2 The atmospheric transmission windows
The presence of different types of molecules in the Earth’s atmosphere puts lim-itations on the spectral regions that can be used in land surface remote sensing. Each molecule has its absorption bands in various parts of the electromagnetic spectrum. As a consequence, only wavelengths outside the main atmospheric ab-sorption bands can be used in remote sensing of the Earth surface, and these
wavelength regions are known as the atmospheric transmission windows. Some wavelengths easily pass through the atmosphere, other wavelengths are blocked or absorbed partly to totally by the atmosphere. Figure1.1shows details of the at-mospheric transmission windows from radio to X-ray wavelengths. High energy wavelengths (Ultraviolet, X-rays, and Gamma-rays) are absorbed by the ozone in the Earth’s upper atmosphere. The visible wavelengths are not blocked by the Earth’s atmosphere, but they can be scattered by dust and clouds. In the in-frared ranges, some wavelengths are blocked by the atmosphere, but others can pass. Similarly in the microwave ranges, the Earth’s atmosphere is transparent at some wavelengths, but not at others. Finally, in the radio ranges, the Earth’s at-mosphere is totally transparent to most of its wavelengths. Based on these atmo-spheric transmission windows, satellite remote sensing instruments are designed to operate in one or more windows where wavelengths can pass through the Earth’s atmosphere to observe the Earth surface. More details of the atmospheric transmission windows can be found in remote sensing books, for exampleElachi and van Zyl[2006].
FIGURE 1.1: The atmospheric transmission windows from radio to X-ray
wavelengths. Figure created by NASA (https://earthobservatory.nasa. gov/).
1.2 Hydrological cycle from space
Satellite observations are very useful to study land surface hydrological cycle over large areas from space (Figure1.2 provides an overview of the hydrologi-cal cycle). It is possible to estimate and monitor different hydrologihydrologi-cal parame-ters (precipitation, evaporation, groundwater, soil moisture, wetlands, and sur-face water over rivers or lakes, for example) based on different published tech-niques. Estimation of surface water extent or precipitation can be done from both visible/infrared and passive/active satellite observations. Active satellite radar altimeters are effective to estimate surface water height over rivers and lakes. Passive microwave satellite estimates are used to extract river flow and discharge information. Satellite-based products are also used to determine variations of sur-face water extent or inland water storage. A quick summary of remote sensing techniques, mainly focusing on estimation of surface water extent and height, is presented in the following sections.
1.2.1 Estimation of continental surface water extent from space
Surface waters can be defined as water found on the surface of the Earth, such as in lakes, rivers, streams, ponds, wetlands, and natural watercourses. Surface waters are replenished by precipitation and by recruitment from groundwater. They are lost by evaporation to the atmosphere, seeping into the ground, running off into the ocean, or used by plants, animals, as well as humans. Remote sensing of surface waters is of interest because they have strong impacts on all forms of life, as well as on the environment. Surface waters are essential to plants for pho-tosynthesis, to animals for hydration, and to humans for their consumption in living, agriculture and industries. In term of impacts on the environment, surface waters play a key role in the biogeochemical and hydrological cycles, in biodi-versity, and in climate variability. Surface waters are the world’s largest natural source of methane (CH4), producing approximately 20%-40% of the world’s
to-tal annual methane emission to the atmosphere [Houweling et al., 1999]. Hence, the variation of surface water extent contributes to changes of methane surface emissions [Bousquet et al., 2006], that affects the global warming. As a conse-quence, monitoring surface water extent and their seasonal dynamics, as well as understanding global surface water distribution are necessary for water manage-ment, and climate change studies [Alsdorf et al.,2007]. In the literature, different methodologies have been developed for surface water extent estimation, using visible and Near-Infrared (NIR), as well as passive and active microwave satellite observations.
1.2.1.1 Visible and Near-Infrared (NIR) observations
Methodologies using visible and NIR satellite imagery for the estimation of sur-face water extent are well established, and are considered to be reliable at local and regional scales as long as the surface water target is not covered by clouds or dense vegetation [Smith,1997]. In principle, all water detection methodologies are developed based on the absorption of water bodies in the visible and in the NIR wavelengths [Smith, 1997]. Water bodies absorb almost all incoming energy in near and shortwave infrared wavelengths, causing low to no reflection to the
satellite sensors when the wavelength increases [Smith,1997]. Based on this phe-nomenon, reflectance data in the NIR wavelengths can be used as an indicator for water bodies [Bryant and Rainey, 2002; Bergé-Nguyen and Crétaux,2015], or it can be combined with reflectance data in the visible bands to create water in-dices, such as the Normalized Difference Vegetation Index (NDVI) [Tucker,1979], the Normalised Difference Water Index (NDWI) [McFeeters, 1996], the Modified Normalised Difference Water Index (MNDWI) [Xu, 2006], and the Automated Water Extraction Index (AWEI) [Feyisa et al.,2014]. Using these water indices for surface water extent and flood estimation has been tested with different types of visible/infrared satellite imagery, such as NOAA/AVHRR [Bryant and Rainey,
2002;Jain et al.,2006], MODIS [Martinez et al.,2008;Sakamoto et al.,2007; Bergé-Nguyen and Crétaux,2015], Landsat [Hallberg et al.,1973;Du et al.,2014;Ji et al.,
2015;Yamazaki et al.,2015;Pekel et al.,2016], and Sentinel-2 [Du et al.,2016;Yang et al.,2017]. Results showed high classification accuracy.
1.2.1.2 Active microwave observations
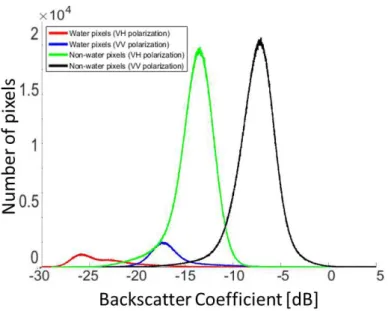
Using active microwave estimates derived from Synthetic Aperture Radar (SAR) satellite instruments for surface water extent and flood estimation appeared later, but it shows great potential. Microwaves can penetrate clouds, and provide day and night operation that are extremely useful for flood extent measurements. Ac-tive microwaves also have the ability to penetrate vegetation, to a certain extent, and this possibility increases when the wavelength increases [Prigent et al.,2016]. The principle of surface water mapping using active microwave satellite obser-vations is based on very low backscatter coefficient over water bodies when the surface is observed off nadir. Energy sent from the active instruments will be re-flected in the specular directions, thus very low backscatter coefficient will be received back at the satellite sensors when the incidence angle is off nadir. This makes water bodies appear very dark in the SAR imagery. Based on this principle, many flood events all over the globe have been estimated using SAR observations from different satellites: ERS-2 [Nguyen and Bui,2001], JERS-1 [Wang,2004], EN-VISAT [Hess et al.,2003; Bartsch et al., 2008; Kuenzer et al.,2013], RADARSAT-1 [Brisco et al., 2009], COSMO-SkyMed [Pierdicca et al., 2013], TerraSAR-X [ Voor-mansik et al., 2014], and recently Sentinel-1 [Amitrano et al., 2014]. Despite of
these advantages, global mapping of water bodies using SAR observations is lim-ited due to the lack of global estimations. Compared to visible/infrared observa-tions, SAR observations are more difficult to interpret because the backscatter coefficients are affected by complicated mechanisms. For example, the effect of wind on backscatter coefficient over water surfaces [Smith, 1997; Alsdorf et al.,
2007; Kuenzer et al.,2013], the double-bounce scattering mechanism [Hess et al.,
1990], or the similarity between water surfaces and flat dry surfaces [Prigent et al.,
2015].
1.2.1.3 Passive microwave observations
Surface water extent estimation using passive microwave satellite observations has been shown useful for a long time [Giddings and Choudhury, 1989]. The principle of detecting surface water extent using passive microwave satellite esti-mates is based on the low emissivity of water bodies in both linear polarizations due to differences in dielectric properties of water and soil or vegetation, espe-cially at lower frequencies. Passive microwave can provide global coverage, but the spatial resolution is very coarse (10-50 km), and prevents their use for appli-cations requiring higher spatial resolutions [Prigent et al., 2016]. In addition, at this low spatial resolution, there are large ambiguities in mixture regions of open water bodies and other types of environments (such as soil, or vegetation). To achieve better accuracy, some authors combined passive microwave with active microwave and visible/NIR satellite estimates to develop methodologies produc-ing global surface water maps over long periods [Prigent et al.,2001, 2007, 2012;
Schroeder et al.,2015].
1.2.2 Estimation of surface water height from space
Satellite radar altimetry technique was originally developed for oceanographic applications, and has been proved to be the most successful method for measur-ing continental surface water elevations from space since the early 1990s [Alsdorf et al.,2007]. Then this technique has been found to be a valuable source to monitor surface water variations over large lakes [Birkett,1995] and rivers [Birkett,1998].
Many authors have shown studies using satellite altimetry data for monitoring water height of inland water bodies [Birkett et al., 2002; Coe and Birkett, 2004;
Crétaux and Birkett,2006;Frappart et al.,2006a,b;Papa et al.,2015]. Satellite radar altimeters are nadir-viewing instruments primarily designed to measure the two-way time delay of radar pulses emitted from satellite sensors and reflected from the surfaces as the satellite orbits around the Earth [Birkett et al.,2002], that gives the distance between the satellite sensors and the reflected surface [Crétaux et al.,
2016]. This distance measurement combined with the accurate knowledge of the satellite position (using Laser Retro-Reflector, GPS, or DORIS systems), enables calculation of the surface water height with respect to a reference ellipsoid [ Bir-kett et al.,2002;Frappart et al.,2006b;Crétaux et al.,2016]. Although radar altime-try is independent from weather conditions and has the unique ability to provide data at remote or ungauged locations, there are limitations. Elevation calculations from satellite altimeters and its accuracy can be affected by topography, size and surface roughness of lakes or rivers. To obtain reliable accuracy in surface water level, corrections have to be taken into account (instrument corrections, propaga-tion correcpropaga-tions, atmospheric correcpropaga-tions, geophysical correcpropaga-tions, ect). Current radar altimeters only estimate elevations at the nadir direction along the satel-lite orbit track, therefore, it cannot provide data all over the globe [Alsdorf et al.,
2007]. However, the concept of using a constellation of several satellites at the same time may enable monitoring surface water variation for a large area [ Cré-taux et al.,2015]. In addition, the future joint US-French Surface Water and Ocean Topography (SWOT) mission can provide altimetry estimates on both sides of the satellite track (up to 50 km) due to its ability to observe the Earth surface in near nadir incidence angles (0.6°-3.9°) [Fjrtoft et al.,2014].
1.2.3 Estimation of other hydrological components from space
Other hydrological components can be estimated from space to some extent, us-ing different satellite data and techniques.
Rainfall estimation from low-Earth and geostationary orbit satellites has a long history since 1970s, with different techniques using wavelength ranges from visible/infrared to microwave (both passive and active) to access to different
cloud layers. A complete overview of rainfall estimation from space can be found in a book edited byLevizzani et al.[2007]. Nowadays, there are several satellite-based datasets that provide near-real time global precipitation estimations: the gauge-calibrated Tropical Rainfall Measuring Mission Multi-satellite Precipita-tion Analysis (TMPA, 3B42 V7), or the Global PrecipitaPrecipita-tion Climatology Project (GPCP).
The Gravity Recovery and Climate Experiment (GRACE) satellite, launched in 2002, provides data to monitor global inland water storage. Detailed informa-tion on the GRACE mission, as well as the processes to extract terrestrial wa-ter storage anomalies can be found in review papers, for exampleWouters et al.
[2014] orWahr[2015]. Many studies have successfully used GRACE data to quan-tify water storage changes in many regions all over the globe [Tapley et al.,2004;
Wahr et al.,2004;Leblanc et al.,2009;Famiglietti et al.,2011;Feng et al.,2013]. The surface water volume variations over some river basins in the world have been studied by combining different inundation and altimetry satellite products [Frappart et al., 2005, 2008, 2010, 2011; Papa et al., 2008a, 2013]. Recently, river flow and discharge information of major river basins in all continents have been estimated [Brakenridge and Nghiem, 2017] based on a methodology that uses mainly historical and current passive microwave satellite data [Brakenridge et al.,
2005].
1.3 The study area: The Vietnam Mekong Delta and
the Tonle Sap Lake in Cambodia
1.3.1 Presentation of the region
Most parts of this thesis focus on monitoring surface water extent, surface water height, and surface water volume over the lower Mekong basin using satellite observations. The Mekong river is one of the longest rivers in the world, ranking 12th, at ∼4,350 km in length [MRC, 2011]. The river starts from the Himalayas
Thailand, Cambodia and Vietnam before entering the East Sea [MRC,2011]. The Mekong basin is commonly divided into two parts: the upper Mekong basin, mostly located in China, and the lower Mekong basin, located in other coun-tries [MRC,2011]. The lower Mekong basin is important because there are nearly 61 million people living within the catchment of the river. This corresponds to about 35% of the total population of the four countries. It is even more impor-tant to Cambodia and Laos because 81% and 89% of their population live in the catchment of the Mekong river [MRC, 2011]. This study focuses on the Vietnam Mekong Delta and the Cambodia Tonle Sap Lake as they are two regions affected the most by climate change and global warming. The Vietnam Mekong Delta in Southeast Asia (one of the largest deltas in the world) is a vast triangular plain of approximately 55,000 km2, most of it lower than 5 m above the sea. The Mekong
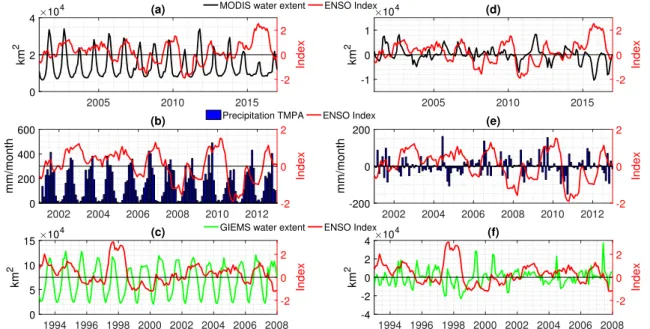
Delta is bounded by the Gulf of Thailand in the southwest, the East Sea in the east, and Cambodia in the northwest. The seasonal variation in water level results in rich and extensive wetlands. For instance, the Mekong Delta region covers only 12% of Vietnam but produces ∼50% of the annual rice (with two or three har-vests per year depending on the provinces), represents ∼50% of the fisheries, and ∼70% of the fruit production. The Tonle Sap Lake (also called the Great Lake), is the largest freshwater lake in Southeast Asia. It is located in the middle of Cam-bodia. The lake and its floodplain are very important for the ecosystems because it is home to nearly 150 fish species, reptiles and birds. The lake is also impor-tant to local inhabiimpor-tants since it supports daily food and livelihood for nearly 3 million people through their fishing and farming activities. In the Mekong Delta and the Tonle Sap Lake, the dry season extends from November to May and the rainy season from June to October. During the rainy seasons, the Tonle Sap Lake is filled with water flowing from the Tonle Sap River, making its water height and flooded surface areas being maximum (10-12 m and ∼ 10,000 km2, respectively).
It is several times higher than that at their minimum states during the dry sea-sons when water throws out from the lake to the Mekong Delta (1-2 m for water height, and ∼ 3,000 km2 for flooded surface areas). An overview of the Mekong
1.3.2 The satellite remote sensing studies so far over the region
The Vietnam Mekong Delta and Cambodia are an attractive region to many au-thors to study the ability of satellite observations in monitoring land surface hy-drology.Sakamoto et al.[2007] used visible/infrared MODIS data whileNguyen and Bui[2001] andKuenzer et al.[2013] used SAR data to detect temporal changes of floods in this region. Water height estimation with satellite altimetry data, as well as water volume variations over the Mekong Delta were introduced in Frap-part et al.[2006b]. Daily discharge records over the main stream of the Mekong river can be found inBrakenridge and Nghiem[2017].
The use of observations from the VNREDSAT-1 satellite, the first optical Earth observing satellite of Vietnam launched in May 2013, is still limited for hydrolog-ical monitoring applications over large areas because of the small satellite swath (17.5 km). In addition, long processes are required to be able to get access to VNREDSAT-1 data. The JV-LOTUSat-1, the first Vietnam radar satellite (work-ing in X-band), is planned to be launched in 2020 with support from Japan. JV-LOTUSat-1 data are expected to be used for many applications (agriculture, land use/land cover, topography, and disaster management).
1.4 Thesis objectives
Monitoring and quantifying the variation of surface water extent is essential to study the water cycle. This thesis is developed to benefit from publicly available satellite observations for water management. The lower Mekong basin in Viet-nam and Cambodia is chosen as the studied area for this thesis. Results from the thesis are distributed for further studies over the Mekong basin (e.g. flood analy-sis and possibly flood warning, studies on the effects of the climate change on the Mekong delta). Thesis results can be used as input for regional climate models to predict the variation of hydrological components over the short- and long-term. Scientific results from this study can be useful for managers, decision makers or insurance companies to understand what is happening in the region, to predict
the changes in the future, and to build plans for mitigation of damages caused by extreme weather events like floods.
In this thesis, four main objectives will be pursued:
• The first objective is to build surface water extent maps over the Mekong Delta and Cambodia based on visible/infrared MODIS/Terra satellite ob-servations. Several classification methodologies will be studied and com-pared to a reference dataset to find the most suitable methodology for the area. Then, the chosen classification method will be applied to provide regu-lar surface water estimates in the region, from January 2001 until the present time.
• The second objective is similar to the first one, but with SAR Sentinel-1 satel-lite observations to benefit from the advantages of SAR data over highly cloudy areas. Free-cloud optical Landsat-8 satellite data are used as targets to train an optimized Neural Network (NN) method. Regular SAR Sentinel-1 surface water extent estimates in the region can be produced since Febru-ary 2015 until the present time.
• In the third objective, a direct application of the surface water extent in the previous chapters is studied. That is the calculation of the variation of the surface water volume over the Mekong Delta and Cambodia. It is calculated as the product of the MODIS-derived surface water extent and the surface water height derived from satellite altimetry data. The validation of the two components, the surface water extent and height, is performed first to check their consistency, then results are evaluated with the variation of the total land surface water volume from GRACE data, as well as with the variation of the in situ discharge estimates of the Mekong River.
• The last objective is to analyze the variation of global surface water extent by comparing mainly two global multi-satellite surface water datasets with monthly time series over the 1993-2007 period. Global comparisons between the two datasets are performed, followed by regional analyses over the 23 largest basins in the world. Ancillary data (river discharge, for example) are used for comparisons when available.
The structure of the thesis closely follows these objectives. Chapter 2 and 3
present the methodologies using optical and SAR satellite observations, respec-tively, to monitor the surface water extent over the lower Mekong basin in Viet-nam and Cambodia. Chapter4focuses on calculation of the monthly surface wa-ter volume changes in the region. Chapwa-ter5focuses on comparisons between two monthly multi-satellite surface water datasets globally and regionally. Chapter6
Surface Water Monitoring within the
Mekong Delta and Cambodia using
Visible and Infrared MODIS Satellite
Observations
2.1 Introduction
In this chapter, the use of visible/infrared satellite observations for surface wa-ter monitoring will be studied. Detecting surface wawa-ter using visible/infrared satellite observations began in the early 1970s with the use of Earth Resources Technology Satellite (ERTS-1, later renamed as Landsat-1) data for flood map-ping in several locations (in Iowa [Hallberg et al., 1973], in Arizona [Morrison and Cooley, 1973], in Virginia [Rango and Salomonson, 1974], and in Australia [Robinove,1978], for example). Since then, many satellites equipped with optical instruments have been launched, proving regional and global imagery at differ-ent spatial and temporal resolutions. Observations from some satellites are free of charge for final users (NOAA/AVHRR, Landsat, MODIS, and Sentinel-2, for ex-ample), and have been used widely for flood and surface water monitoring appli-cations. The Advanced Very High Resolution Radiometer (AVHRR) instrument onboard the National Oceanic and Atmospheric Administration (NOAA) satel-lites was first launched in 1978. The AVHRR instrument was designed to monitor clouds and to measure the thermal emission of the Earth, but then its data were discovered to be suitable for flood detection applications [Islam and Sado, 2000;
Nyborg and Sandholt, 2001; Domenikiotis et al., 2003; Jain et al., 2006]. Similar to the AVHRR instrument, the Moderate Resolution Imaging Spectroradiometer (MODIS) instrument onboard the Terra and Aqua satellites has provided regular long-term remote sensing data (since 2000) for surface water monitoring applica-tions [Martinez et al.,2008;Peng et al.,2009;Sakamoto et al.,2007;Bergé-Nguyen and Crétaux, 2015]. Although NOAA/AVHRR and MODIS instruments have a high temporal resolution (twice a day), global coverage during a long period of time, their spatial resolutions are rather coarse (1100 m for NOAA/AVHRR, and maximum 250 m for MODIS) and limit their data to applications requiring low spatial resolution. Data from the Landsat satellite series, and recently the Sentinel-2 satellite can be a better choice for high resolution applications. Landsat satellites provide global observations at 30 m spatial resolution, but their temporal resolu-tion is 16 days. Landsat-8 is the latest satellite in the series and was launched in 2013. Observations provided by the Operational Land Imager (OLI) instrument onboard the Landsat-8 satellite have been used widely to detect surface water in
many studies [Du et al.,2014;Ji et al.,2015;Acharya et al.,2016]. Long-term Land-sat series data are also used for creation of surface water maps at continental scale [Mueller et al., 2016] as well as at global scale [Yamazaki et al.,2015; Pekel et al.,
2016]. The newest satellite that provides freely visible observations is Sentinel-2 that was launched in 2015. It is a pair of satellites with 5-day temporal resolution (10 days with only one satellite). The MultiSpectral Instrument (MSI) onboard the Sentinel-2 satellites provides observations with different spatial resolutions rang-ing from 10 m to 60 m. Some authors started usrang-ing Sentinel-2 data for mapprang-ing surface water bodies [Du et al., 2016; Yang et al., 2017]. Detailed information of these four "free" satellites are shown in Table2.1.
TABLE2.1: Four commonly used satellites providing freely visible/infrared
ob-servations. Sources: NASA & ESA.
Satellites Agency Number Temporalof bands Res. (day) Res. (m)Spatial Swath(km)
NOAA/AVHRR NOAA(1978-present) 4-6 0.5 1100 2800 MODIS NASA 36 0.5 250-1000 2330 (2000-present) Landsat NASA 4-9 16 30-80 185 (1972-present) Sentinel-2 ESA 13 5 10-60 290 (2015-present)
The principle of detecting surface water using visible/infrared satellite ob-servations is based on the very low reflectance of water compared to other land surface types. Surface reflectance is the amount of light reflected by the Earth surface, and it is calculated by the ratio between surface radiance and surface ir-radiance. It typically has values between 0 and 1. When a body is illuminated by electromagnetic radiation, at the surface of the body, energy will be partly transmitted, absorbed or reflected, depending on the wavelength and the inci-dence angle of the incoming radiation, and on the material and roughness of the surface of the body. Objects having different surface features transmit, absorb or reflect radiation in different ways, therefore, they have different spectral signa-tures. Therefore, by studying these spectral signatures, it is possible to identify different surface features or materials.
Figure 2.1 shows the spectral signatures from visible to mid-infrared (MIR) of three common natural surfaces on the Earth: dry bare soil, green vegetation and clear water bodies. Taking clear water bodies as an example, they absorb effectively all wavelengths longer than the visible range. It causes a very low sur-face reflectivity in the range of infrared wavelengths. Green vegetation has a very special spectral signature since its surface reflectance is low in the visible range but higher for the green light than for the blue and red light due to absorption of chlorophyll before it increases dramatically in the domain of the near-infrared (NIR) wavelengths. In case of the dry bare soil, its surface reflectance rises grad-ually as a function of the wavelengths, reaching the peak in the middle of the MIR range. Based on these basic physical principles, surface reflectance data of NIR wavelengths are often used to detect open water bodies such as lakes or rivers because these water surfaces appear very dark in NIR reflectance images.
Bryant and Rainey[2002] applied a threshold on NIR surface reflectances of the NOAA/AVHRR satellite data to delineate lakes. However, using a single band to detect surface water usually yields large errors because of misclassification be-tween water pixels and other land surface types [Du,2012]. A more effective way to detect surface water with higher accuracy is to use different water indices that are calculated from two or more bands. Several water indices have already been proposed.
FIGURE 2.1: Spectral signatures of soil, vegetation and clear water as a
func-tion of wavelengths from visible to MIR. Numbers 1-7 indicate visible, NIR and MIR wavelength ranges, respectively. Source: SEOS project (http://www.
McFeeters [1996] introduced a technique using the Normalized Difference Water Index (NDWI) to classify surface water bodies. NDWI is calculated as the ratio between the green and the NIR wavelengths (equation2.1) that makes sur-face water have positive values.
N DW I = GREEN − NIR
GREEN + N IR (2.1) Later,Xu[2006] replaced the NIR band by the MIR band to make the Modified of Normalized Difference Water Index (MNDWI). Surface water still has positive values, but this MNDWI is reported to reduce errors between water and build-up land pixels [Rokni et al., 2014]. The Normalized Difference Vegetation Index (NDVI) is the ratio between the NIR and the red wavelengths (equation2.7). This index was developed to study the vegetation canopy, but it can work as a wa-ter index since surface wawa-ter has negative NDVI values [Rouse Jr. et al., 1974;
Domenikiotis et al.,2003; Rokni et al., 2014]. NDVI data are also combined with NIR reflectance data to classify water bodies [Cretaux et al.,2011]. Several indices (the Enhanced Vegetation Index (EVI), the Land Surface Water Index (LSWI), and the Difference Values between EVI and LSWI (DVEL)), are also combined to-gether for flood mapping and flood monitoring [Sakamoto et al.,2007]. Recently, a new water index called the Automated Water Extraction Index (AWEI) was in-troduced byFeyisa et al. [2014] that improves classification accuracy in shadow and dark surfaces. AWEI has two indices used for shadow and non-shadow situ-ations (equsitu-ations2.2and2.3), and surface water has positive AWEI values.
AW EInsh = 4× (GREEN − MIR1) − (0.25 × NIR + 2.75 × MIR2) (2.2)
AW EIsh = BLU E + 2.5× GREEN − 1.5 × (NIR + MIR1) − 0.25 × MIR2 (2.3)
Comparisons between different water indices in different environments using Landsat data are performed in some studies [Yang et al.,2011;Rokni et al.,2014;
Zhai et al., 2015]. It is concluded that the accuracy of each water index depends on studied areas and the reference information. Therefore, there is no best in-dex among all of them, and the selection of the most suitable water inin-dex can be different depending on specific situations. Although using water indices can provide water surface maps with a good accuracy, cloud contamination is still
the greatest limitation for the use of water indices since nearly 60% of the Earth surface is cloud covered at any moment. This makes their applications are only suitable for cloud-free conditions, which is very restrictive in some regions (e.g., in the Tropics). Vegetation can also mask the surface water partly or totally, mak-ing the water detection difficult or even impossible under canopy. In addition, the NIR reflectance over highly turbid water can be higher than over the visible re-flectance, introducing confusions in the indices used for the water detection. De-spite these limitations, flood and surface water mapping using visible/infrared satellite observations can be efficient, and provide good agreements with results derived from aerial photography [Smith, 1997]. Among all available visible/in-frared satellite data, Landsat and MODIS data are widely used because their data are now free of charge, quick to download, and cover a long period of time.
This chapter focuses on using visible/infrared MODIS/Terra observations for detecting and monitoring surface water extent over the Vietnamese Mekong Delta and Cambodia, from 2001 to present time. MODIS images have moderate spatial resolution (500 m) compared to Landsat one (30 m), but the temporal res-olution is much higher (twice a day compared to 16 days) making MODIS data more suitable for monitoring applications. Section2.2provides more details of the MODIS/Terra observations, as well as 4 different methodologies that use MOD-IS/Terra observations for surface water detection. Pre-processing steps applied to the data are described in Section2.3. Results are shown in Section2.4. Section
2.5concludes this chapter.
2.2 Different methodologies using MODIS/Terra
ob-servations for surface water monitoring
2.2.1 MODIS/Terra observations
The Moderate Resolution Imaging Spectroradiometer (MODIS) instrument is one of the key instruments onboard the Terra satellite (launched on 18 December 1999), and the Aqua satellite (launched on 4 May 2002) from NASA. The two satellites are sun-synchronous, near-polar, and are orbiting at an altitude of ∼ 705
km. The two satellites were designed so that the Terra satellite passes the equa-tor from north to south at 10.30 am (local time) and the Aqua satellite passes the equator from south to north at 1.30 pm (local time). MODIS instrument pro-vides global Earth observations in 36 spectral bands ranging from visible (0.4 µm) to infrared wavelengths (14.4 µm). MODIS instrument provides observa-tions at different spatial resoluobserva-tions (250 m, 500 m, and 1 km depending on the wavelength). The two satellites can cover the entire Earth’s surface every 1-2 days. MODIS Terra atmospherically corrected surface reflectance 8-day Level-3 (L3) Global 500 m (MOD09A1) products used in this study are provided freely through the NASA’s Earth Observing System Data and Information System (EOS-DIS;https://reverb.echo.nasa.gov/reverb/). MOD09A1 data provide
atmospherically corrected surface reflectance information of seven different bands from optical to infrared wavelengths in two native spatial resolutions. Band 1 (red) and band 2 (NIR) are at the highest spatial resolution of 250 m, and bands 3-7 are at 500 m spatial resolution. MODIS data are available from 20 Febru-ary 2000 until present. Each MOD09A1 image was created by selecting the best Level-2 gridded (L2G) observation during an 8-day period on the basis of high observation coverage, low view angle, absence of clouds or cloud shadow, and aerosol loading [Vermote, 2015]. Table2.2 shows details of the MOD09A1 seven bands and their main applications. Each MOD09A1 image has the dimension of 2400×2400 (rows/columns) at 500 m spatial resolution. One image covers an area of approximately 10°×10°, projected on the sinusoidal projection.
TABLE2.2: MOD09A1 seven bands and their main applications. Source: NASA.
Band Wavelength Resolution Key
number range (µm) (m) applications
1 0.620-0.670 250 Absolute Land cover TransformationVegetation Chlorophyll 2 0.841-0.876 250 Land cover TransformationCloud Amount Vegetation 3 0.459-0.479 500 Soil/Vegetation Differences 4 0.520-0.600 500 Green Vegetation 5 1.230-1.250 500 Leaf/Canopy Differences 6 1.628-1.652 500 Snow/Cloud Differences 7 2.105-2.155 500 Cloud Properties, Land Properties
2.2.2 Sakamoto et al. [2007] methodology
FIGURE 2.2: Flowchart describing the methodology for detecting the
spatio-temporal changes of flood inundation bySakamoto et al.[2007].
Sakamoto et al. [2007] presented a methodology for detecting the spatio-temporal changes in the extent of annual flooding over the Mekong River Delta in Vietnam using MOD09A1 time series imagery. Details of the algorithm are shown in Figure2.2. First, the Enhanced Vegetation Index (EVI), the Land Surface Wa-ter Index (LSWI), and the Different Value between EVI and LSWI (DVEL) are
calculated at pixel level, from the original atmospherically corrected surface re-flectance data derived from the MOD09A1 8-day composite products. The EVI and the LSWI are obtained using equation2.4 and equation2.5, while the DVEL is calculated from equation2.6:
EV I = 2.5∗ N IR− RED
N IR + 6∗ RED − 7.5 ∗ BLUE + 1 (2.4) LSW I = N IR− MIR
N IR + M IR (2.5) DV EL = EV I− LSW I (2.6) where RED, NIR, BLUE and MIR are the surface reflectance values of visible band 1 (red band; 0.62 - 0.67 µm), NIR band 2 (0.841 - 0.876 µm), visible band 3 (blue band; 0.459 - 0.479 µm) and MIR band 6 (1.628 - 1.652 µm), respectively. Next step, a linear interpolation is used to deal with missing data such as cloud-covered pixels (pixels where surface reflectance values of the blue band are greater than 0.2), then a wavelet transformation is applied to reduce noise for the indices. After this step, all the EVI, LSWI, and DVEL indices are smoothed and ready for the classification step.
For the classification, all pixels with smoothed EVI values greater than 0.3 are classified as non-flood pixels. Water-related pixels are marked when the smoothed DVEL values are smaller than or equal to 0.05 and the smoothed EVI values are smaller than or equal to 0.3. If a pixel has the smoothed EVI value smaller than or equal to 0.05 and the smoothed LSWI value smaller than or equal to 0, it is also marked as a water-related pixel. At the final step, a threshold of the smoothed EVI values is used to distinguish between mixture pixels and fully inundated pixels from water-related pixels. Mixture pixels are defined as pixels that are partly in-undated. The smoothed EVI values in open water bodies such as lakes or the ocean are normally low, therefore, if the smoothed EVI values are smaller than or equal to 0.1, these water-related pixels are set as the fully inundated pixels. If the smoothed EVI values are greater than 0.1 and smaller than or equal to 0.3, then these water-related pixels are marked as the mixture pixels. Based on these conditions, inundation maps over the Mekong River Delta can be re-built. Results are shown in section2.4.
2.2.3 Bergé-Nguyen and Crétaux [2015] methodology
Bergé-Nguyen and Crétaux[2015] also developed a methodology for flood and wetland mapping over the Inner Niger Delta (IND), based on the same MOD09A1 time series imagery . This methodology is simpler thanSakamoto et al.[2007] one since it uses mainly surface reflectance information derived from visible band 1 (red band; 0.62 - 0.67 µm), NIR band 2 (0.841 - 0.876 µm) and NIR band 5 (1.23 - 1.25 µm) to classify surfaces into five different types, including open water, mix water/dry land, aquatic vegetation, vegetation, and dry land. Details of this methodology are described in Table 2.3. First, the Normalized Difference Vege-tation Index (NDVI) for each single pixel is calculated using equation2.7. Since open water bodies absorb most of radiation in the infrared wavelengths, values of surface reflectance of NIR band 5 (1.23 - 1.25 µm) is selected to determine open water bodies. When band 5 surface reflectance value of a pixel is smaller than 0.12, that pixel is marked as a fully inundated pixel. When that value increases to the threshold value of 0.27, that pixel is marked as a water-related pixel, and when it overcomes the threshold of 0.27 that pixel is marked as a non water-related pixel. For these water-related pixels, the NDVI is used to distinguish between mix of water/dry land and aquatic vegetation. If the NDVI of a water-related pixel is smaller than 0.4, the pixel is considered as a mix water/dry land and if the NDVI is greater than 0.4, the pixel is classified as an aquatic vegetation pixel. For these non water-related pixels, the NDVI is tested to detect the presence of vegetation on dry land. If the NDVI of one pixel in this class is smaller than 0.4, this pixel is called a dry land pixel, and if the NDVI is greater than 0.4, then this pixel is considered to be covered by vegetation. Due to its simple criterion, this method-ology is reported to be more suitable for the arid and semi-arid regions (like the Inner Niger Delta), but less precise for the equatorial and boreal regions where the cloud contamination is high [Bergé-Nguyen and Crétaux, 2015]. However, this methodology is still applied over the Mekong River Delta and Cambodia for comparison to results obtained from theSakamoto et al.[2007] methodology. More details will be shown in the section2.4.
N DV I = N IR− RED
TABLE2.3: Threshold values used for classifying terrain surface into five
differ-ent classes byBergé-Nguyen and Crétaux[2015].
Index WaterOpen Mix Water/Dry Land VegetationAquatic Vegetation Dry Land
Band 5 <0.12 >0.12 & <0.27 >0.12 & <0.27 >0.27 >0.27
NDVI No test <0.4 >0.4 >0.4 <0.4
2.2.4 Unsupervised and supervised classification techniques
Beside using criterion and indices to classify, image classification can be done based on two major techniques: unsupervised and supervised classifications. Each technique has its own advantages and disadvantages, and they are used for dif-ferent purposes. More information on classification techniques can be found in re-mote sensing books, such asJensen[1995]. Unsupervised and supervised are per-formed here to calibrate classification results obtained from the two approaches described in the two previous sections.
2.2.4.1 Unsupervised classification
The principle of unsupervised classification methodology is to group pixels within an image that have similar spectral signature together into the same groups. The most popular algorithms used in unsupervised classification are K-means and ISODATA methods. For the K-means classification, the user selects the number of classes to obtain, n classes, for example. At the very first step, n pixels in the image are chosen randomly as n bary-centers. The second step, each single pixel in the image is associated with one bary-center by calculating and comparing the Euclidean distance from all pixel to each n bary-centers. The third step, new n bary-centers are re-calculated based on classification results in the previous step, and again each single pixel in the image is associated with a bary-center. This pro-cess runs several times until all pixels in the image stop changing their classes. Finally, all pixels in the image are classified into n classes (or groups) as expected. The ISODATA algorithm has the same principle as the K-means one, but the num-ber of classes may be varied by splitting a cluster into smaller ones or merging
FIGURE 2.3: Classification results with 8 clusters after applying K-means
algo-rithm to a MODIS image over land areas of Vietnam and Cambodia in February 2007.
several clusters together to create a bigger one. If the distance between two clus-ters is smaller than a given threshold, they will be merged together making a bigger cluster. And if the standard deviation in any dimension is greater than a given threshold for a cluster, it will be split into two different ones. In addition, if a cluster has the total number of individual pixel smaller than a given number, it could be deleted from the calculation. The unsupervised classification method is easy to perform, however, this method is often used when the users do not know very well about the environment of the studied areas.
An unsupervised classification is designed to classify each MODIS image into three clusters (water, mixed and non-water). First, using the K-means algorithm, the image is classified into 8 clusters. Several tests have been made to conclude that classifying into 8-10 clusters is optimal for this purpose. Water-related clus-ters are determined based on the low values of their bary-cenclus-ters, and the spatial
structure of the classification map (see Figure2.3, colors 1 and 7). Then, pixels as-sociated to the other 6 clusters are marked as non-water pixels. Next, the K-means algorithm is used another time to classify the remaining water-related pixels into mixed-pixel or water-pixel clusters. Finally, the image is completely classified, as expected. Bary-centers of the two clusters at the seven MODIS bands derived from the unsupervised classification method are shown in Table2.4.
2.2.4.2 Supervised classification
The supervised classification is guided by a training dataset provided by the user. The user defines "training sites" in the image to be classified. "Training sites" are regions known as a particular land cover type. The algorithm calculates and de-fines the spectral signature of all the pixels within each "training site". Then, based on the spectral signature of each pixel in the image, the algorithm determines possibilities belonging to each land cover type in the training dataset. By compar-ing its possibilities, a pixel is associated with a land cover type it matches most closely. Defining "training sites" is very important for supervised classification be-cause it strongly affects the accuracy of the classification. Classification accuracy increases with accuracy of the training dataset. Supervised classification method is often used when the user knows very well the studied area.
A supervised classification method using the minimum distance algorithm is designed for the same objective to classify MODIS imagery into three classes, as described above. Four surface water maps created based on theSakamoto et al.
[2007] method are used as training dataset. The four images are selected in Jan-uary, April, July and October 2007, to improve the ability to capture the wetland dynamics in a year. The training dataset contains ∼ 9 million pixels already classi-fied into three classes. First, mixed pixels and water pixels in the training dataset are merged into one class, called the water-related class. At this step, the train-ing dataset only has two clusters (non-water and water-related). Then, each pixel in the MODIS image is classified into either non-water group or water-related group, using the minimum distance algorithm. Next, the water-related pixels are classified one more time to put them into the mixed-pixel or the water-pixel
group. The bary-centers of the two clusters derived from the supervised classifi-cation technique are also shown in Table2.4.
Bary-centers of mixed-pixel and water-pixel classes derived from both un-supervised and un-supervised classification techniques are very close, meaning that surface water maps derived from the two techniques are also close. More com-parisons will be shown in section2.4.
TABLE 2.4: Bary-centers of surface reflectance at the MODIS seven bands for
mixed-pixel and water-pixel clusters derived from unsupervised and supervised classification techniques.
Band 1 Band 2 Band 3 Band 4 Band 5 Band 6 Band 7 Mixed pixels Unsupervised 0.08 0.20 0.06 0.08 0.19 0.13 0.07 Supervised 0.10 0.21 0.07 0.10 0.19 0.13 0.07 Water pixels Unsupervised 0.08 0.08 0.05 0.08 0.07 0.05 0.02 Supervised 0.09 0.09 0.06 0.09 0.07 0.05 0.03 2.2.4.3 Hybrid classification
Unsupervised and supervised classifications can also be used together in a pro-cess called hybrid classification. Unsupervised classification can be used first to determine the number of land cover types that can be defined, then supervised classification can be used to classify the image into the land cover classes of in-terest. However, in this chapter, unsupervised and supervised classification tech-niques are applied separately to build surface water maps. The same MOD09A1 products used in Sakamoto et al. [2007] and Bergé-Nguyen and Crétaux [2015] are used to run both unsupervised and supervised classifications.
2.3 MOD09A1 pre-processing
2.3.1 MOD09A1 quality and reliability checking
85%-95% of the Mekong River Delta is often covered by thick clouds during the rainy seasons [Leinenkugel et al.,2013], causing problems to optical sensors like MODIS because these observations cannot penetrate clouds. The relation-ship between the presence of clouds and the variability of MOD09A1 surface reflectance needs to be checked to quantify the quality as well as the reliability of the MOD09A1 products. Surface reflectance pixels located over the ocean are removed from the original data using a land/ocean mask to obtain only surface reflectances over land area. Figure2.4shows land surface reflectance maps from the seven MODIS bands over Cambodia and Vietnam, after applying the land/o-cean mask.
A MOD09A1 data file contains a quality assurance flag (4 states) and two cloud flags. The first cloud flag is the internal cloud algorithm flag (two states: cloud or no cloud), and the second one is the MOD35 cloud flag (four states: clear, cloud, mixed, or not set and assumed clear). Figure2.5shows cloud covered
FIGURE 2.4: MOD09A1 land surface reflectance maps from the seven MODIS