HAL Id: hal-00295821
https://hal.archives-ouvertes.fr/hal-00295821
Submitted on 13 Jan 2006
HAL is a multi-disciplinary open access
archive for the deposit and dissemination of
sci-entific research documents, whether they are
pub-lished or not. The documents may come from
teaching and research institutions in France or
abroad, or from public or private research centers.
L’archive ouverte pluridisciplinaire HAL, est
destinée au dépôt et à la diffusion de documents
scientifiques de niveau recherche, publiés ou non,
émanant des établissements d’enseignement et de
recherche français ou étrangers, des laboratoires
publics ou privés.
pyrolysis of vegetation
J. P. Greenberg, H. Friedli, A. B. Guenther, D. Hanson, P. Harley, T. Karl
To cite this version:
J. P. Greenberg, H. Friedli, A. B. Guenther, D. Hanson, P. Harley, et al.. Volatile organic emissions
from the distillation and pyrolysis of vegetation. Atmospheric Chemistry and Physics, European
Geosciences Union, 2006, 6 (1), pp.81-91. �hal-00295821�
Atmos. Chem. Phys., 6, 81–91, 2006 www.atmos-chem-phys.org/acp/6/81/ SRef-ID: 1680-7324/acp/2006-6-81 European Geosciences Union
Atmospheric
Chemistry
and Physics
Volatile organic emissions from the distillation and pyrolysis of
vegetation
J. P. Greenberg, H. Friedli, A. B. Guenther, D. Hanson, P. Harley, and T. Karl
National Center for Atmospheric Research, Boulder, Colorado, 80307-3000, USA
Received: 4 August 2005 – Published in Atmos. Chem. Phys. Discuss.: 22 September 2005 Revised: 7 December 2005 – Accepted: 9 December 2005 – Published: 13 January 2006
Abstract. Leaf and woody plant tissue (Pinus ponderosa,
Eucalyptus saligna, Quercus gambelli, Saccharum offici-narum and Oriza sativa) were heated from 30 to 300◦C and volatile organic compound (VOC) emissions were iden-tified and quaniden-tified. Major VOC emissions were mostly oxygenated and included acetic acid, furylaldehyde, acetol, pyrazine, terpenes, 2,3-butadione, phenol and methanol, as well as smaller emissions of furan, acetone, acetaldehyde, acetonitrile and benzaldehyde. Total VOC emissions from distillation and pyrolysis were on the order of 10 gC/kgC dry weight of vegetation, as much as 33% and 44% of CO2 emis-sions (gC(VOC)/gC(CO2))measured during the same exper-iments, in air and nitrogen atmospheres, respectively.
The emissions are similar in identity and quantity to those from smoldering combustion of woody tissue and of differ-ent character than those evolved during flaming combustion. VOC emissions from the distillation of pools and endother-mic pyrolysis under low turbulence conditions may produce flammable concentrations near leaves and may facilitate the propagation of wildfires. VOC emissions from charcoal pro-duction are also related to distillation and pyrolysis; the emis-sions of the highly reactive VOCs from production are as large as the carbon monoxide emissions.
1 Introduction
Combustion of vegetation occurs in several consecutive stages: distillation, endothermic pyrolysis, exothermic py-rolysis, ignition, flaming combustion and smoldering com-bustion. Gaseous organic and inorganic emissions, as well as readily condensable compounds (tars), are produced during these stages. However, the composition and rates of emission vary significantly among the different combustion stages. Correspondence to: J. P. Greenberg
Numerous reports have identified and quantified volatile organic compounds (VOC) emissions from wildfire pro-cesses (Andreae and Merlet, 2001; Christian et al., 2003). The regional (e.g. Wotawa and Trainer, 2000) and global (Crutzen and Andreae, 1990) influence of emissions on at-mospheric chemistry and radiation is very large, because many of the gaseous emissions are very reactive and primary and secondary aerosols from fires scatter or absorb solar ra-diation. Emission ratios (expressed relative to CO2 or CO emissions) or emission factors (g emission/kg fuel burned) for VOCs have been derived from laboratory experiments, measurements of fires at ground-level, or by aircraft in smoke plumes. Samples are often collected into canisters and an-alyzed at a remote laboratory by GC-FID or GC-MS (e.g., Greenberg et al., 1984; Friedli et al., 2001) or are analyzed by on-line techniques (Lobert et al., 1991; Yokelson et al., 1996; Bertschi et al., 2003a, b). Smoke plume studies typically do not characterize VOC emissions from different stages of combustion, since most plumes include a combination of all stages.
The work presented is focused on those emissions that oc-cur during the pre-flaming stage of fires. These emissions arise during the initial heating of vegetation up to 300◦C, before exothermic pyrolysis begins. Leaf and woody plant tissue were studied. The emissions measured are used to in-fer their influence on fire propagation. The VOC emissions are then compared with emissions from smoldering combus-tion, which constitutes a large, difficult to characterize VOC source. The emissions are finally applied to charcoal produc-tion, a globally significant form of biomass burning.
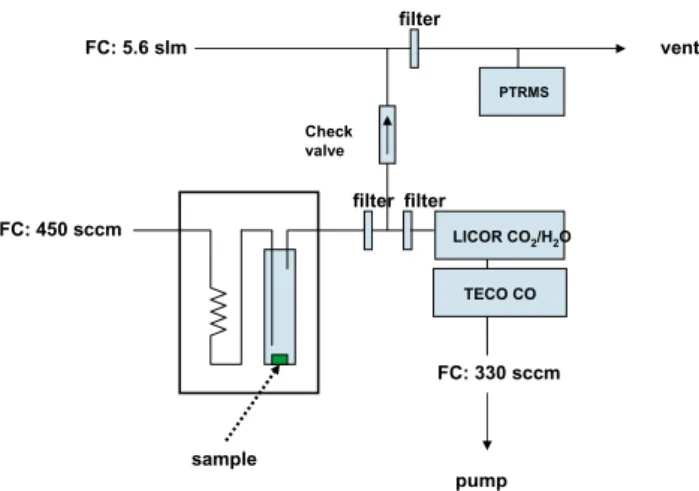
FC: 450 sccm filter FC: 330 sccm LICOR CO2/H2O TECO CO pump FC: 5.6 slm filter PTRMS Check valve sample filter vent
Fig. 1. Experimental setup. Preheated air (or nitrogen) flowed through a cold finger that contained the vegetation sample. The apparatus sat within a temperature programmed oven. The sample flow was measured undiluted by CO2and CO analyzers. Flow was diluted further for PTRMS analysis. Glass fiber filters were placed before analyzers to trap condensable tars.
2 Experimental information
2.1 Experimental setup
The experimental setup is shown schematically in Fig. 1. Vegetation samples were placed at the bottom of a roast-ing chamber (100 ml Pyrex cold froast-inger). Purge gas was in-troduced through the central tube and flow exited through the side tube. Gas flow through the chamber was con-trolled by a mass flow controller (Unit Instrument Com-pany, Yorba Linda, CA). A gas chromatograph oven (model HP5880A, Hewlett-Packard, Palo Alto, CA) was used to enclose and control the temperature of the roasting cham-ber. Purge gas was preheated through a stainless steel coil (2.2 mm ID×4 m), which also sat within the oven. The efflu-ent flow was split into 2 streams: one wefflu-ent directly to ana-lyzers for CO2and CO; the flow rate through this branch was controlled by the mass flow controller of the CO instrument. The second branch was diluted further (approximately 8:1) with purge gas flow by way of another mass flow controller; an aliquot of this flow was continuously sampled for VOCs by proton transfer reaction mass spectrometry. Filters (Pall-Gelman glass fiber Acrodisc, 1 µm pore size) were placed at several points in the sample flow path to trap condensable products (tars) before they entered the analytical instruments. All sample lines were Teflon.
The oven was programmed from 30◦C to 300◦C (higher temperatures were avoided to preclude exothermic pyrolysis) at a program rate of 10◦C/min, with initial and final temper-ature holds of 2 and 15 min, respectively. Only ultra-high purity air or nitrogen was used.
2.2 Vegetation
Experiments were conducted with leaf material from 5 species: Gamble oak (Quercus gambelli), ponderosa pine (Pinus ponderosa), eucalyptus (Eucalyptus saligna), sugar cane (Saccharum officinarum), and rice (Oriza sativa) and woody plant tissue from 2 species (P ponderosa, E saligna). Plant species were chosen to represent genera in landscapes frequently consumed by wildfires or agricultural burning.
Typically three experiments were made with each species in air and one in nitrogen. E. saligna, Q. gambelli, O. sativa and S. officinarum leaves were harvested from young greenhouse-grown plants; P. ponderosa needles and wood were harvested from a mature tree growing outside in Boulder, CO. Green woody tissue from a greenhouse-grown, juvenile E saligna was also tested. Vegetation sam-ples were cut from living vegetation. The fresh cuttings were weighed to the nearest 0.1 mg. Three additional cut-tings were weighed fresh, then placed in drying oven (60◦C) overnight, then reweighed to allow for the calculation of the moisture content of vegetation tested. After experiments, the residue left in the roasting chamber was also weighed. 2.3 Proton transfer reaction mass spectrometry (PTRMS) PTRMS was used to measure many VOCs produced in the roasting process. The lab-built instrument has been described in detail previously (Hanson et al., 2002). In the technique, a proton (from H3O+) was transferred to the VOC reactant by soft collision in a drift tube and the resulting ion passed through an orifice into a quadrupole mass spectrometer. Se-lected masses, corresponding to sample VOCs (parent or fragments ions), were monitored and quantified.
Calibration of responses for target VOCs were determined by several methods. When accurate and stable compressed gas mixtures containing target VOCs were available (ace-tonitrile, isoprene, terpenes, benzene, toluene), these were diluted to sample concentration ranges with a dynamic di-lution system. For some VOCs (methanol, acetaldehyde, and acetone), calibrated permeation tubes (VICI Metronics, Poulsbo, WA) were used in a permeation tube calibration system (Kintek, La Marque, TX) to produce desired con-centrations. For VOCs where no authentic standards were available, responses were calculated using measured PTRMS transmission characteristics and rate constants for the ion re-action of VOC with water ion clusters (Warneke et al., 2003). 2.4 Gas chromatography-mass spectroscopy (GCMS) For each vegetation roasting experiment, VOCs were also determined by GCMS (Hewlett-Packard model 5971MS/5890GC, Palo Alto, CA). Samples were collected into electropolished stainless steel canisters when oven temperatures were 250–300◦C. Canisters were flushed with PTRMS sample stream air for several minutes before sample
J. P. Greenberg et al.: VOC emissions from vegetation pyrolysis 83 flow was captured. Samples were analyzed according to
methods previously described (Greenberg et al., 1999). 2.5 Carbon dioxide (CO2)
CO2was analyzed continuously by a non-dispersive infrared analyzer (model 6262, LICOR Inc, Lincoln, NE) connected in series with the undiluted sample outflow. Sample air was pulled through the analyzer at atmospheric pressure and at constant rate (by way of the pump and flow controller of the downstream CO instrument). CO2concentrations were cali-brated against a commercially prepared compressed gas stan-dard (1428 ppm CO2, Scott Specialty Gases, Plumsteadville, PA).
2.6 Carbon monoxide (CO)
CO in undiluted sample flow was measured by IR absorp-tion (Thermo Electron Corp., Model 48, Franklin, MA). CO concentrations were calibrated against NIST SRM#2612a. 2.7 Thermo-gravimetric analysis (TGA)
Q. gambelli oak leaf and P. ponderosa needle samples were analyzed by thermo-gravimetric analysis (Cahn Instruments, model TGA 131 thermo-graphic analyzer, ThermoElectron Corp., Newington, MA), which tracks mass loss of sam-ples as a function of temperature. Ten to 60 mg of sample were placed in the microbalance of the TGA and heated at 10◦C/min from room temperature to 700◦C. The decrease in
mass and the rate of change of mass as a function of tem-perature were recorded. The heating was carried out in a 450 ml/min flow of air or nitrogen in separate experiments.
3 Results
3.1 GCMS
VOCs emitted during the heating of the vegetation were ana-lyzed and components identified by GCMS. Emissions were dominated by oxygenated volatile organic compounds. Ma-jor emissions from the five species studied were largely the same and include (in order of molecular weight) methanol, acetonitrile, acetaldehyde, acetone, acetic acid, furan, acetol, pyrazine, 2,3 butadione, phenol, furylaldehyde, benzalde-hyde, and terpenes. No major alkane, alkene or aromatic emissions were observed by GCMS or PTRMS at these tem-peratures, consistent with the physics of the pyrolysis pro-cess (Yokelson et al., 1996). It is likely that some VOCs, especially oxygenated VOCs, were not efficiently transferred from canisters to the GCMS system (Friedli et al., 2001). The GCMS method only allowed for the measurement of VOCs eluting between butane and pentadecane. Consequently, sev-eral VOC emissions reported previously (e.g., ethene and
Eucalyptus 0 1 10 100 1000 30 60 90 120 150 180 210 240 270 300 Temperature (oC) e m is s io n/ gC /m in
MeOH acetaldehyde acetone acetic acid furan pyrazine/terpene butadione furylaldehyde methyl acetate
0.0 0.1 1.0 10.0 30 60 90 120 150 180 210 240 270 300 Temperature (oC) m gC em is si o ns/ g C /m in CO2 CO VOC µ g Eucalyptus 0 1 10 100 1000 30 60 90 120 150 180 210 240 270 300 Temperature (oC) e m is s io n/ gC /m in
MeOH acetaldehyde acetone acetic acid furan pyrazine/terpene butadione furylaldehyde methyl acetate
0.0 0.1 1.0 10.0 30 60 90 120 150 180 210 240 270 300 Temperature (oC) m gC em is si o ns/ g C /m in CO2 CO VOC µ g
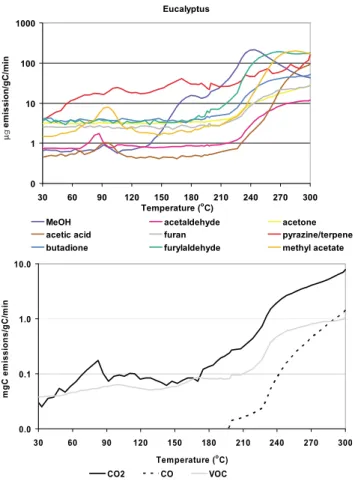
Fig. 2. Emission factors (µgC/gC) of the most abundant VOCs emissions versus temperature (top panel) and total VOC, CO2and CO emission (lower panel) for Eucalyptus leaf tissue.
propene) were not measured in these experiments. Quanti-tative GCMS analysis was not made for samples from canis-ters.
3.2 PTRMS, CO2, and CO
Individual ions for PTRMS analysis were selected through comparison with GCMS analyses. Emissions of VOCs from E. saligna are shown in Fig. 2, which also includes results for CO and CO2experiments conducted simultaneously with PTRMS experiment. In all experiments, CO2emissions were greater than CO and total VOC emissions. At lower temper-atures, VOC emission rates exceed those for CO, but near the higher temperature limit (300◦C) CO and VOC emis-sion rates were approximately the same. Emisemis-sions for most VOCs have similar temperature profiles for the 5 vegetation species (Fig. 3). (Q. gambelli oak was not tested for acetic acid, acetol, phenol or benzaldehyde emissions; P. ponderosa was not tested for benzaldehyde emissions.)
Emissions from woody plant tissue (P. ponderosa and E. saligna) are shown in Fig. 4; the identities and emission
0 1 10 100 1000 30 60 90 120 150 180 210 240 270 300 mpe rature (oC) C e m is s io n /g C/ m in
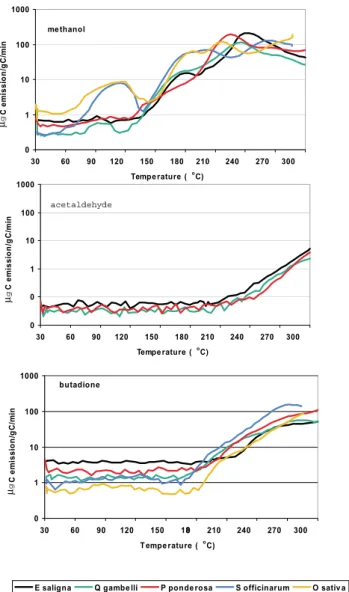
E saligna Q gambe lli P ponde rosa S officinarum O sativ a butadione 0 0 1 10 100 1000 30 60 90 120 150 180 210 240 270 300 mpe rature (oC) C e m is s io n /g C /m in 0 1 10 100 1000 30 60 90 120 150 180 210 240 270 300 Tempe rature (oC) C e m is s io n /g C /m in me thanol acetaldehyde µg µ g µ g T e e T
Fig. 3. Comparison of emission factors (top: methanol, middle: acetone; bottom: 2,3-butadione) versus temperature for leaf tissue of Q gambelli, P ponderosa, E saligna, S officinarun, and O sativa.
factors of most VOC emissions from woody tissue were sim-ilar to those found for leaf tissue, although emission factors for some VOCs were higher in one or the other.
The ion detected (m/z) by PTRMS may correspond, in some cases, to more than one possible VOC emission. Ace-tone, glyoxal, and methylvinylether are detected as m/z 59 in PTRMS. GCMS analysis indicated that acetone was the ma-jor component detected at m/z 59. Christian et al. (2004) also found that acetone was the major emission from laboratory studies of various fuels.
Acetic acid and glycolaldehyde both are detected at m/z 61. GCMS analysis of pyrolysis emissions indicated only acetic acid was present (the suitability of the analytical method for glycolaldehyde was not tested). The acetic acid emission factor, however, may be, on average, six times that of glycolaldehyde (Christian et al., 2004). Similarly, furan
Eucalyptus wood 0 1 10 100 30 60 90 120 150 180 210 240 270 300 Temperature (o C) gC e m iss ion/ g C /m in
MeOH acetaldehyde acetone acetic acid furan acetol pyrazine/terpene butadione furylaldehyde
µ
Fig. 4. Emission factors (µgC/gC) of the most abundant VOCs emissions versus temperature for Eucalyptus woody tissue.
and isoprene are detected as m/z 69 in PTRMS. Isoprene is emitted immediately after it is produced by certain plant species exposed to sufficient sunlight; it is not stored in the leaf or woody tissue. The experiments described here were conducted in the darkness of the oven; consequently, no iso-prene was likely produced. Isoiso-prene was not detected in the GCMS analysis, while furan was easily identified. Although isoprene has been reported as an emissions from fires, its emission factor is 4 to 10 times less than furan (Andeae and Merlet, 2001). Acetol (hydroxyacetone) and methyl acetate are both detected as m/z 75 in PTRMS. GCMS analysis could not identify either product with adequate certainty. Christian et al. (2004) reason that acetol is the major emisison product, however.
In the following discussion and acompanying tables and figures, the major VOC will be used to represent the m/z of detection, but it should be understood that minor contribu-tions from other VOCs may be included also.
3.3 TGA
Qualitatively, the patterns from TGA for Q. gambelli and the P. ponderosa are similar (Fig. 5). Water and some stored organic compounds are distilled below 150◦C. Between ap-proximately 150◦C and 360◦C, VOCs, CO and CO2are re-leased in both nitrogen and air and correspond to the pyroly-sis (pyrolytic decomposition) of hemicellulose and cellulose in the vegetation. Above 360◦C, the behavior of the
pro-cesses in air and nitrogen diverge. In air, exothermic pyrol-ysis proceeds with additional CO2and CO emitted between 400 and 600◦C; above 600◦C only ash remains. A minor, undertermined contribution of oxygenated VOCs may also result from the oxidation of pyrolytically produced VOCs. In nitrogen, there is apparently little release of CO and CO2 at the temperatures above 400◦C because chemisorption of oxygen is needed to promote gasification of the fuel (Yokel-son et al., 1996, Fig. 7).
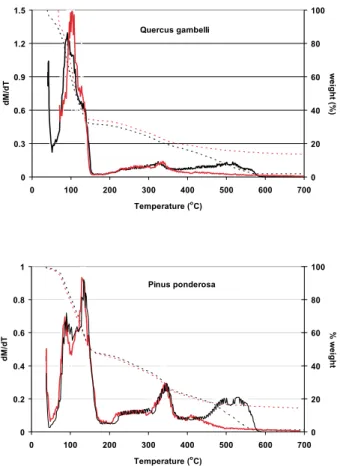
J. P. Greenberg et al.: VOC emissions from vegetation pyrolysis 85 Quercus gambelli 0 0.3 0.6 0.9 1.2 1.5 0 100 200 300 400 500 600 700 Temperature (o C) dM/d T 0 20 40 60 80 100 we ig h t ( % ) Pinus ponderosa 0 0.2 0.4 0.6 0.8 1 0 100 200 300 400 500 600 700 Temperature (oC) dM/d T 0 20 40 60 80 100 % w e igh t
Fig. 5. Thermo-gravimetric analysis of P. ponderosa needle and
Q. gambelli leaf tissue. Experiments were made in air (black line)
and nitrogen (red line). Shown are the rate of change of mass with time (solid line, left scale) and percent weight remaining (dotted line, right scale). Distillation emissions occurred before 175◦C, followed by endothermic pyrolysis emissions (up to approximately 350◦C). Additional emissions from exothermic pyrolysis occurred at higher temperatures. Results were similar for both air and nitro-gen, except at temperatures greater than 400◦C, where the presence of oxygen produces additional CO2and CO emissions.
3.4 Mass balance
Table 1 compiles data for the initial moisture content, emis-sions and residue after heating. Tar collected on the filters was not weighed and is, therefore, not included in the mass balance. The carbon content of the residue was not deter-mined analytically, but was computed to achieve mass bal-ance (assuming that the contribution of tars was negligible). The residue of the air and nitrogen experiments had approx-imately the same carbon content.
3.5 Emission rate uncertainties
Calibrations for several of the VOCs determined (acetoni-trile, terpenes) were made from compressed gas standards; the concentration of these standards was confirmed in com-parison with other compressed gas standards using GC-FID
Table 1. Mass balance.
% moisture1 % emissions2 % C residure2
Q. gambelli, air 51 5 78 N2 3 74 P. ponderosa, air 59 9 94 N2 3 86 E. saligna, air 54 6 72 N2 4 73 S. officinarum, air 83 7 58 N2 4 65 O. sativa, air 77 15 90 N2 7 94 1(gH
2O/g fresh weight) × 100% 2(gC residue/gC dry weight)× 100%
(Apel et al., 1994). The accuracy of these standards was judged to be within 5%. For methanol, acetaldehyde and ace-tone, calibrations were made with respect to calibrated per-meation tubes. Perper-meation tubes were weighed periodically to determine the mass emission rate of the VOCs. The tube emission rates determined agreed within 10% of the emission rates specified by the supplier.
In the cases of most VOCs measured by PTRMS, no pri-mary standard was available. For these VOCs the concentra-tions were calculated (after Warneke et al., 2003) using liter-ature rate constants for the reaction of the VOC with H3O+, mass spectrometer transmission characteristics (determined experimentally), and the reaction time within the drift tube. Since most VOCs have a reaction rate with H3O+determined by collision rate, the rate constants for the reactions are sim-ilar and an average rate constant was used when none was available from literature (Spanel and Smith, 1999, and ref-erences therein). The uncertainty associated with concentra-tion estimates for these VOCs may be as large as a factor of 2.
Any losses of VOCs in the experimental system were as-sumed negligible for the VOCs reported here. Higher molec-ular weight VOCs (tars) that condensed on filters were not measured; their contribution to the total VOC emission fac-tor is therefore not included.
Calibration for CO2 was made using a primary standard of CO2in air (1430±20 ppm, Scott Specialty Gases, Plum-steadville, PA). The concentrations determined were esti-mated to be accurate to within 5%. CO determinations were made with respect to NIST SRM #2612a (9.6±0.12 ppm CO in nitrogen); uncertainties were estimated to be approxi-mately 10%.
Mass flow meters were calibrated against bubble flow me-ters for the lower flow ranges (<500 sccm) and against a wet test meter (Precision Scientific CO, Chicago, IL) for higher flows. The uncertainties in flows are less than a few per-cent. Fresh and dry leaf or wood tissue was measured to the
nearest 0.1 mg for 3 samples of each species to determine moisture content; the uncertainty of the moisture content is within 10%.
Errors were propagated using uncertainties in flow rates, vegetation moisture content and calibration standards. The errors in the emission rates for methanol, acetaldehyde and acetone (determined from permeation tubes) were approxi-mately 15%; for terpenes and acetonitrile, where a dynamic dilution of flow from a compressed gas standard produced calibration mixtures, the uncertainty was also on this order. In the case of those VOCs whose concentrations were cal-culated from rate constants and ion transmission properties of the PTRMS, the uncertainties in the emissions rates were dominated by the uncertainty in the calculation of response factors and were probably on the order of a factor of 2. Un-certainties in CO2and CO emissions are estimated to be ap-proximately 15%.
4 Discussion
4.1 Combustion process
Combustion may be divided into several phases (Browne, 1958; Yokelson et al., 1996), each with distinct emissions and emission rates. Distillation occurs at temperatures up to 200◦C; water, methanol, terpenes and other VOCs stored in liquid pools are emitted during distillation. These emissions are the largest weight loss fraction, since they include wa-ter, which represented 50–80% of the weight of fresh vegeta-tion (Table 1). Endothermic, low temperature pyrolysis (ther-mal degradation of organic compounds) takes place between 200 and 280◦C; methanol, acetic acid, and other oxygenated VOCs are released during this stage. Significant emissions of CO2and CO from the breakdown of hemicellulose and cel-lulose also occur during endothermic pyrolysis (Fig. 2). Be-tween 280 and 500◦C, exothermic pyrolysis occurs; a com-bustible mixture of non-methane hydrocarbons and tars are emitted, but were not quantified or identified in the experi-ments.
Additional CO2and CO emissions observed between 400 and 600◦C are produced in exothermic pyrolysis reactions in-volving oxygen and are not seen in the TGA nitrogen experi-ments (Fig. 5). In both air and nitrogen, water vapor emitted comes not only from distillation of stored water but also from dehydration of cellulose during pyrolysis. Consequently, the residue of pyrolysis has a higher carbon percent composi-tion than the fresh vegetacomposi-tion (approximately 44% by weight for cellulose). The residue (Table 1) was calculated to be enriched to 50–70% carbon for Q. gambelli, E. saligna and P. ponderosa leaf tissue, but enriched to over 80% for S. offic-inarum and O. sativa leaf tissue. At high carbon enrichment, the residue is called charcoal. Charcoal, a black-body radia-tion absorber, has a low temperature of spontaneous igniradia-tion compared to other pyrolysis products. Reactions among
py-rolysis products and with oxygen may be catalyzed by char-coal (Browne, 1958).
An ignition point is finally reached when the process be-comes exothermic and flaming combustion begins. Aro-matic, olefinic and aliphatic organic compounds are released in the flaming stage, along with additional CO and CO2. Af-ter flaming is extinguished, smoldering combustion contin-ues (Yokelson et al., 1997; Bertschi et al., 2003a).
Oxygenated VOCs are almost exclusively released dur-ing the distillation and pyrolysis processes; their emission factors, consequently, may be most easily measured dur-ing these phases alone. Presumably, aromatic and aliphatic hydrocarbon emission factors may be measured during the flaming phase (in a similar TGA experiment, for example). 4.2 Emission comparison among species
For most VOCs, emissions were lowest at the lowest temper-atures and highest near 300◦C (Fig. 3). Methanol, acetalde-hyde, acetone, acetic acid and acetol had local maxima be-tween 90 and 120◦C; from TGA (Fig. 5) and PTRMS (Fig. 2) analyses, we assume that water and these VOCs were present in fresh plant tissue and were distilled early in the temper-ature program (60–150◦C). Most other emissions occurred
at significantly higher temperatures (200–300◦C). Several
VOCs showed at least 2 local maxima in emissions up to 300◦C, indicating that their emission may have more than one source. For example, methanol is both present initially as a dissolved component in leaf water and also is released in the de-methylation of pectin at higher temperatures (Fall, 1999). The two grasses, S. offcinarum and O. sativa, emit-ted little furylaldehyde compared to leaves from the woody plant species. O. sativa emitted more acetic acid than other species, while P. ponderosa emitted more terpene and phe-nol. Q gambelli also emitted significantly more furyl alde-hyde.
Pyrazine and terpenes both give the characteristic m/z 81 in PTRMS analysis. For Q. gambelli, O. sativa, and S. offic-inarum, the ion represents pyrazine exclusively, since these species do not have stored terpenes. For P. ponderosa and E. saligna, which contain stored terpenes, m/z 81 probably represents terpene at temperatures below 200◦C and a mix-ture of pyrazine and terpenes at higher temperamix-tures. Near 300◦C, CO2 was the largest component of emissions; CO2 emissions were also detected even at the lowest temperatures of the experiments.
For all species, VOC emissions in the temperature range 30–300◦C were approximately the same in pattern and
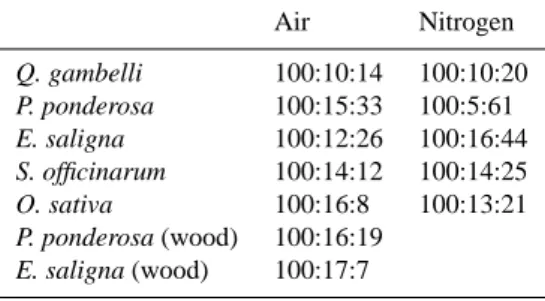
mag-nitude in air and nitrogen experiments. The exception was found for furylaldehyde, which was emitted from the grasses at a significantly higher rate in nitrogen than air. The ratio of VOCs to CO2emissions is higher in the nitrogen experi-ments, while the ratio of CO to CO2remains approximately the same (Table 2). Pyrolysis of plant tissue in oxygen likely contributes to additional CO2and CO emissions.
J. P. Greenberg et al.: VOC emissions from vegetation pyrolysis 87 TGA analyses indicated additional emissions of VOCs up
to 350◦C, above which no substantial emissions were seen
until approximately 500◦C. The additional emissions
be-tween 300 and 350◦C were assumed to be comprised of the same VOCs emitted at 300◦C, since many VOCs had near their maximum emissions at about 300◦C. Emissions above 500◦C are probably CO2and CO emissions from the reaction of oxygen with organic material, since these emissions were not seen in the nitrogen experiments.
Some VOCs may not have been measured by PTRMS be-cause parent or fragment ions were not monitored during ex-periments or because the PTRMS technique was not sensitive to those VOCS (e.g., alkanes). Additional VOCs identified in GCMS analyses were not quantified. The GCMS anal-ysis range was from butane to approximately penta-decane. Tars, which were collected on filters, are not included in the emission totals, nor are any VOCs which may not have been transferred through the Teflon sample tubing (although any loss was likely negligible). Several VOC emissions previ-ously reported for pyrolysis and distillation of leaf and wood tissue were not measured or quantified. For example, Yokel-son et al. (1996) reported emission factors for the distillation and pyrolysis stages for formaldehyde in laboratory experi-ments. The mass balance computed in Table 1 gives a similar percentage carbon in residue as reported for charcoal (Pen-nise et al., 2001); it is assumed, therefore, that VOC emis-sions measured comprise the major weight fraction of total emissions (Table 2).
Emission factors (mgC VOC/kgC fuel dry weight) for the distillation and pyrolysis of the vegetation species studied are given in Table 3.
4.3 Comparison of leaf and woody tissue emissions Woody tissue is composed primarily of hemicellulose, cellu-lose and lignin; leaves are composed largely of hemicellucellu-lose and cellulose. Hemicellulose decomposes between 200 and 260◦C, followed by cellulose at 240 to 350◦C, and finally by lignin at 280 to 500◦C (Browne, 1958). Consequently, the major emissions (in the temperature range 30–300◦C) from woody tissues (Fig. 4) were similar in identity and magnitude to the emissions from leaf tissues for E. saligna and P. pon-derosa. However, there are several exceptions. Methanol and acetic acid emission factors from the pyrolysis of P. pon-derosa and E. saligna woody tissue are similar to those re-ported previously for smoldering woody tissue, but were sig-nificantly higher than emission factors measured for leaf tis-sue (Table 3). Furylaldehyde has a much higher emission factor in P. ponderosa wood than in needles, but, on the con-trary, furylaldehyde emissions from E. saligna wood were much lower than emissions from the leaves. Woody plant tissue for both species had much lower terpene/pyrazine (m/z 81) emissions than leaves or needles; this may result from the lower nitrogen content or the smaller percentage of terpenes in woody tissue compared to leaf tissue.
Table 2. emission ratios (gC (CO2):gC (CO):gC (VOC). Air Nitrogen Q. gambelli 100:10:14 100:10:20 P. ponderosa 100:15:33 100:5:61 E. saligna 100:12:26 100:16:44 S. officinarum 100:14:12 100:14:25 O. sativa 100:16:8 100:13:21 P. ponderosa (wood) 100:16:19 E. saligna (wood) 100:17:7
4.4 Fire induced emissions in forest canopies
Fire propagates when fuel is heated to a temperature where its volatile emissions are of sufficient concentration that they may be ignited by an attached flame, glowing embers, or other adequate energy source. In typical fires, biomass is heated to temperatures on the order of 1100◦C and a large fraction may be gasified at a high rate. Ignition of these emissions may also ignite another volume of gas below the flammability threshold. In the present focus on low tempera-ture distillation and pyrolysis emissions, the concentration of emissions during these combustion phases may be estimated as a function of heating time to determine how quickly con-centrations may reach levels where they may be ignited.
The leaf biomass in mature forests has been estimated at approximately 750 gm−2, with most of the foliage at some level near the middle of the canopy (Guenther et al., 1995). For a well-mixed volume of the mid-canopy (1 m3) con-taining 250 g of foliage (upper limit to what may be ex-pected) heated at 300◦C for 1 min, emission concentrations of <0.02% (volume emissions/volume of air) would result, much lower than the lower flammability limits of individ-ual VOCs in Table 4. Advection in the pre-flaming for-est on the order of 10 ms−1 (Taylor et al., 2004) would significantly reduce the time for heating and decrease con-centrations, even if advected air is from adjacent volumes also heated to 300◦C. However, concentrations of emissions near leaves may be considerably higher than the average for a well-mixed volume of the canopy. Assuming a specific leaf mass of 233 gm−2for P ponderosa and 75 gm−2for Q gambelli and E saligna (Geron et al., 1994), a 1 mm leaf boundary layer, low turbulence and 300◦C, concentration ap-proaching 2% (v/v) may be reached in 20, 50, and 180 s for P ponderosa, E saligna and Q gambelli, respectively. Hence, combustible mixtures may be produced at temperatures be-low 350◦C, much lower than the temperature of exothermic pyrolysis. The result is also consistent with that of Dimi-trakopoulos (2000), who, from TGA measurements of mean volatization rates, concluded that Pinus species should be more combustible than Quercus species.
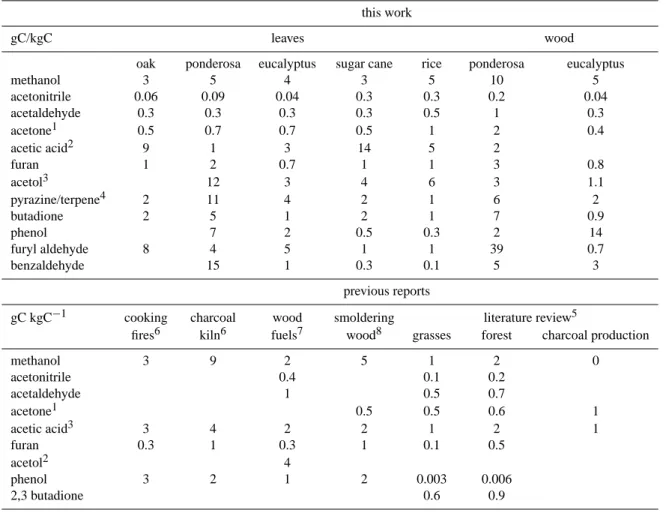
Table 3. Comparison with previously reported emission factors (gC emissions/kgC fuel). this work
gC/kgC leaves wood
oak ponderosa eucalyptus sugar cane rice ponderosa eucalyptus
methanol 3 5 4 3 5 10 5 acetonitrile 0.06 0.09 0.04 0.3 0.3 0.2 0.04 acetaldehyde 0.3 0.3 0.3 0.3 0.5 1 0.3 acetone1 0.5 0.7 0.7 0.5 1 2 0.4 acetic acid2 9 1 3 14 5 2 furan 1 2 0.7 1 1 3 0.8 acetol3 12 3 4 6 3 1.1 pyrazine/terpene4 2 11 4 2 1 6 2 butadione 2 5 1 2 1 7 0.9 phenol 7 2 0.5 0.3 2 14 furyl aldehyde 8 4 5 1 1 39 0.7 benzaldehyde 15 1 0.3 0.1 5 3 previous reports
gC kgC−1 cooking charcoal wood smoldering literature review5
fires6 kiln6 fuels7 wood8 grasses forest charcoal production
methanol 3 9 2 5 1 2 0 acetonitrile 0.4 0.1 0.2 acetaldehyde 1 0.5 0.7 acetone1 0.5 0.5 0.6 1 acetic acid3 3 4 2 2 1 2 1 furan 0.3 1 0.3 1 0.1 0.5 acetol2 4 phenol 3 2 1 2 0.003 0.006 2,3 butadione 0.6 0.9
1may include methylvinylether (<20%) 2may include glycholaldehyde (<20%)
3may include small contribution from methyl acetate 4compute as if 100% pyrazine
5Andreae and Merlet (2001)
6Bertschi et al. (2003a), Zambia RSC
7Christian et al. (2003), Indonesian and African fuels, average 8Bertschi et al. (2003b), smoldering, various domestic fuels
Emission contributions from reservoirs, such as sap (in branches or trunk), were not included in the flammability estimate. The estimate also does not include contributions from any VOC emissions from woody tissue. The ratio of leaf biomass to twig biomass (diameter <5 mm) has been estimated at 2:1 for Picea (spruce) and 1:1 for Populus (bal-sam poplar) species (Yarie and Meade, 1988). Twigs and leaves both are expected to heat rapidly in front of fires and the inclusion of emissions from twigs may increase the con-centrations of VOCs produced and reduce the time for the generation of flammable mixtures.
4.5 Smoldering combustion
Significant emissions of VOCs occur during smoldering combustion, after the flaming stage ends (Yokelson et al., 1997; Bertschi et al., 2003a). After flames have been extin-guished, glowing zones continue to heat adjacent vegetation; the heating produces distillation and pyrolysis emissions.
Emissions from smoldering combustion are usually in-cluded with the emissions measured in smoke plumes (An-dreae and Merlet, 2001); however, smoldering combus-tion may continue for several days after the active flam-ing stage. Smoldering has higher emission factors for oxygenated VOCs than the average factors measured in
J. P. Greenberg et al.: VOC emissions from vegetation pyrolysis 89
Table 4. Lower limit of flammability1.
VOC (v/v %) Methanol 7 Acetonitrile 3 Acetaldehyde 4 Acetone 3 Acetic acid 4 Furan 2 Methyl acetate 3 Phenol 2 Furylaldehyde 2 1Handbook of Chemistry and Physics
smoke plumes. Many emission inventories used in regional and global chemistry-transport models do not differentiate among the various stages of combustion and generally use emission factors for smoke plumes (Liousse et al., 2004). Emission factors for oxygenated VOCs are generally highly uncertain or not reported (Liousse et al., 2004) and, there-fore, may not be included as emissions in biomass burning emission inventories.
4.6 Emissions from charcoal production
Charcoal fuel production typically proceeds with a large vol-ume of organic material (logs, branches, slash) either loaded into a kiln or simply covered with earth. Heat is applied from some external source and heated air (350–400◦C) is
circu-lated through the organic matter (Lacaux et al., 1994). At these temperatures, distillation and pyrolysis emissions are the largest fraction of VOC emissions from charcoal pro-duction (Fig. 5). The carbon content of the residue of the experiments (approximately 70–90% for leaves from woody plants, Table 1) is similar to the carbon content of about 75% for typical charcoal production kilns (Pennise et al., 2001). The emission factors for several VOCs are in agreemnet with previous reported results for charcoal production (Table 3).
Previous estimations of the total VOC emissions from charcoal production may be substantially underestimated. Pennise et al. (2001) calculated greenhouse gas contributions from charcoal production. Their results indicate that VOCs were equivalent to approximately 10% of the carbon emit-ted as CO2in the production process. However, the carbon in VOC emissions may be as high as 30% of the carbon emitted as CO2(Table 2), or even higher if VOCs detected but not quantified or unmeasured are included. Pennise et al. (2001) also report an average ratio of VOC emissions to CO emissions of approximately 0.4 g VOC/g CO; Bertschi et al. (2003b) indicate the ratio at approximately 0.3 g VOC/g CO. Measurements of the species in this study show that VOC emissions equal or exceed CO emissions (Table 2). Several possibilities may explain the higher ratio of VOC to
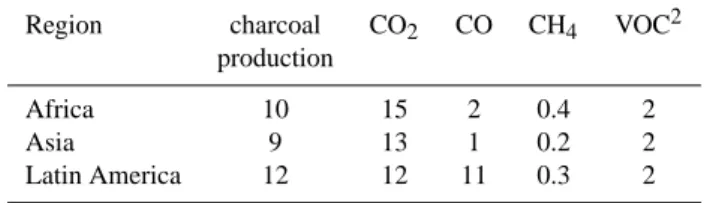
Table 5. Emissions from charcoal production (Tg pollutant yr−1)1.
Region charcoal CO2 CO CH4 VOC2 production
Africa 10 15 2 0.4 2
Asia 9 13 1 0.2 2
Latin America 12 12 11 0.3 2
1after Yevich and Logan (2003) 2this work
CO emissions found here. Pennise et al. (2001) employed a total hydrocarbon analyzer, which converts hydrocarbons to CO2, which alone is measured; since individual hydrocar-bons and oxygenated hydrocarhydrocar-bons are not distinguished, the emission mass may only be estimated from an assumption of the average weight of organic compounds. For example, the ratio of the molecular weight of methanol to methane is 32:16; the ratio for 2,3 butadione to butane is 86:58; in that study, an average molecular weight of 18 was used, which underestimates the weights of some emissions, especially oxygenated VOCs. The Bertschi et al. (2003b) tecchnique did not measure several of the VOCs reported here. Actual kiln temperatures may reach temperatures much higher than 300◦C. Additional CO and CO2, but little VOC, is produced at high temperature (Fig. 5 and Yokelson et al., 1996). This would act to decrease the VOC to CO ratios in previous stud-ies.
Yevich and Logan (2003) estimated global contribution of CO2, CO, CH4from charcoal production. The results of the experiments reported here suggest that VOC emissions from charcoal production are on the order of CO emissions in their estimate, much larger than previously estimated (Table 5).
5 Conclusions
The distillation and pyrolysis of leaf and woody tissue pro-duce mostly the same VOCs with similar emission factors for most VOCs. The VOC emissions from these processes are mostly oxygenated hydrocarbons. The emissions are simi-lar to those from smoldering combustion, a later stage of the combustion process. Emission factors for biomass burning are most often given for fire plumes, which integrate emis-sions from all stages of combustion. The emission factors for several oxygenated VOCs reported here are not described explicitly or are very uncertain in current biomass burning in-ventories. Since smoldering combustion may continue for an extended period after the end of flaming combustion, a sepa-rate treatment of smoldering combustion emissions is needed to include the effect of these reactive VOCs in regional and global air quality simulations.
Calculations indicate that emissions from the distillation and pyrolysis of leaves mixed within the canopy caused by heat from nearby fires would not produce sufficiently high concentrations to reach the lower limit of flammability. How-ever, emission concentrations may be much higher in the small volume around the vegetation under low turbulent con-ditions. Ignition may occur from a glowing ember originat-ing in the fire front or from hot charcoal in the pyrolyzed canopy.
Emissions from charcoal production are rich in oxy-genated VOCs, many of which participate very actively in atmospheric chemistry, producing ozone, other oxidants and carbon monoxide. The chemistry may not only have regional air quality implications, but may also have global effects on the organic carbon budget and the global warming potential of the emitted VOCs. Distillation and pyrolysis during char-coal production produce VOC emissions on the order of CO emissions and greenhouse gas contributions as high as 40% of the carbon emitted as CO2.
Acknowledgements. We wish to thank NCAR internal reviewers
(G. Petrone and C. Wiedinmyer) and ACPD external reviewers (R. J. Yokelson and an anonymous reviewer) for very helpful comments. We also thank S. Nandi for her contributions to the study. The National Center for Atmospheric Research is opreated by the University Corporation for Atmospheric Research and is sponsored by the U.S. National Science Foundation.
Edited by: M. Ammann
References
Apel, E. C., Calvert, J. G., and Fehsenfeld, F. C.: The non-methane hydrocarbon intercomparison experiment, J. Geophys. Res., 99(D8), 16 651–16 664, 1994.
Andreae, M. O. and Merlet, P.: Emissions of trace gases and aerosols from biomass burning, Global Biogeochem. Cycles, 15(4), 955–966, 2001.
Bertschi, I., Yokelson, R. J., Ward, D. E., Babbitt, R. E., Su-sott, R. A., Goode, J. G., and Hao, W. M.: Trace gas and particle emissions from fires in large diameter and be-lowground biomass fuels, J. Geophys. Res., 108(13) 8472, doi:10.1029/2002JD002100, 2003a.
Bertschi, I., Yokelson, R. J., Ward, D. E., Christian, T. J., and Hao, W. M.: Trace gas emissions from the production and use of do-mestic biofuels in Zambia measured by open-path Fourier trans-form infrared spectroscopy, J. Geophys. Res., 108(D13), 8469, doi:10.129/2002JD002158, 2003b.
Browne, F. L.: Theories of the combustion of wood and its control: A literature survey, Forest Products Laboratory, U.S. Department of Agriculture, Report No. 2136, 1–59, 1958.
Christian, T. J., Kleis, B., Yokelson, R. J., Holzinger, R., Crutzen, P. J., Hao, W. M., Saharjo, B. H., and Ward, D. E.: Comprehen-sive laboratory measurements of biomass burning emissions: 1. Emissions from Indonesian, African, and other fuels, J. Geophys. Res., 108(D23), 4719, doi:10.1029/JD003704, 2003.
Christian, T. J., Kleis, B., Yokelson, R. J., Holzinger, R., Crutzen, P. J., Hao, W. M., Shirai, T, and Blake, D. R.:
Comprehensive laboratory measurements of biomass-burning emissions: 2 First intercomparison of open-path FTIR, PTR-MS and GC-PTR-MS/FID/ECD, J. Geophys. Res., 109, D02311, doi:1029/2003JD003874, 2004.
Crutzen, P. J. and Andreae, M. O.: Biomass burning in the trop-ics: Impact on atmospheric chemistry and biogeochemical cy-cles, Science, 250, 1669–1678, 1990.
Dimitrakopoulos, A. P.: Thermographic analysis of Mediterranean plant species, J. Anal. and Appl. Pyrolysis, 60, 123–130, 2000. Fall, R.: Biogenic emissions of volatile organic compounds from
higher plants, in: Reactive Hydrocarbons in the Atmosphere, edited by: Hewitt, C. N., Academic Press, London, 41–96, 1999. Friedli, H. R., Atlas, E., Stroud, V. R., Giovanni, L., Campos, T., and Radke, L. F.: Volatile organic trace gases emitted from North American wildfires, J. Geophys. Res., 15(2), 435–452, 2001. Geron, C. D., Guenther, A. B., and Pierce, T. E.: An improved
model for estimating emissions of volatile organic compounds from forests in the eastern United States, J. Geophys. Res., 99(D6), 12 773–12 791, 1994.
Guenther, A., Hewitt, C. N., Erickson, D., Fall, R., Geron, C., Graedel, T., Harley, P., Klinger, L., Lerdau, M., McKay, W. A., Pierce, T., Scholes, B., Steinbrecher, R., Tallamraju, R., Taylor, J., and Zimmerman, P.: A global model of natural volatile or-ganic carbon emissions, J. Geophys. Res., 100(D5), 8873–8892, doi:10.1029/94JD02950, 1995.
Greenberg, J. P., Zimmerman, P. R., Heidt, L., Lueb, R., and Pol-lock, W.: Hydrocarbon and carbon monoxide emissions from biomass burning in Brazil, J. Geophys. Res., 89(D1), 1350–1354, 1984.
Greenberg, J. P., Guenther, A., Zimmerman, P., Baugh, W., Geron, C., and Davis, K.: Tethered Balloon measurements of biogenic VOCs in the atmospheric boundary layer, Atmos. Environ., 33, 855–867, 1999.
Greenberg, J. P., Guenther, A. B., Madronich, S., Baugh, W., Gi-noux, P., Druilhet, A., Delmas, R., and Delon, C.: Biogenic VOC emissions and chemistry along the EXPRESSO transect in cen-tral Africa, J. Geophys. Res., 104(D23), 30 659–30 671, 1999. Hanson, D., Greenberg, J. P., Henry, B., and Kosciuch, E.: Proton
transfer reaction mass spectroscopy at high drift tube pressure, Int. J. Mass Spec., 12 266, 1–12, 2002.
Handbook of Chemistry and Physics, 85th edition, edited by: Lide, D. R., CRC Press, Cleveland, 2004.
Lacaux, J.-P., Brocard, D., Lacaux, C., Delmas, R., Brou, A., Yoboue, V., and Koffi, M.: Traditional charcoal making: an im-portant source of atmospheric pollution in the African tropics, Atmos. Res., 35, 71–76, 1994.
Liousse, C., Andreae, M. O., Artaxo, P., Barbosa, P., Cachier, H., Gregoire, J. M., Hobbs, P., Lavoue, D., Mouillot, F., Penner, J., Scholes, M., and Schultz, M. G.: Deriving global quantitative estimates for spatial and temporal distributions of biomass burn-ing emissions, in: Emissions of Atmospheric Trace Compounds, edited by: Granier, C., Artaxo, P., and Reeves, C. E.: Advances in Global Change Research, Kluwer Academic Publishers, Dor-drecht, 71–113, 2004.
Lobert, J. M., Scharffe, D. H., Hao, W. M., Kuhlbusch, T. A., Seuwen, R., Warneck, P., and Crutzen, P. J.: Experimental eval-uation of biomass burning emissions: nitrogen and carbon con-taining compounds, in: Global Biomass Burning: Atmospheric, Climatic and Biospheric Implications, edited by: Levine, J. S.,
J. P. Greenberg et al.: VOC emissions from vegetation pyrolysis 91 289–304, MIT Press, Cambridge, Mass, 1991.
Pennise, D. M., Smith, K. R., Kithinji, J. P., Rezende, M. E., Raad, T. J., Zhang, J., and Fan, C.: Emissions of greenhouse gases and other airborne pollutants from charcoal making in Kenya and Brazil, J. Geophys. Res., 106(D20), 24 143–24 155, 2001. Spanel, P. and Smith, D.: Selected ion flow tube studies of the
reactions of H3O+, NO+, and O+2 with several aromatic and aliphatic hydrocarbons, Int. J. Mass Spectrom. Ion Proc., 181, 1–10, 1998.
Taylor, S. W., Wotton, B. M., Alexander, M. E., and Dalrymple, G. N.: Variation in wind and crown fire behavior in a northern jack-pine-black spruce forest, Can. J. For. Res., 34, 1561–1576, 2004.
Wotawa, G. and Trainer, M.: The influence of Canadian forest fires on pollution concentrations in the United States, Science, 288, 324–328, 2000.
Warneke, C., De Gouw, J. A., Kuster, W. C., Goldan, P. D., and Fall, R.: Vaildation of atmospheric VOC measurements by proton-transfer-reacton mass spectroscopy using a gas-chromatographic pre-separation method, Environ. Sci. Tech., 37(11), 2494–2501, doi:10.1021/es026266i, 2003.
Yarie, J. and Mead, B. R.: Twig and foliar biomass estimation eval-uation for major plant species in the Tanana River Basin of in-terior Alaska, Research paper #PNW-RP-401, Pacific Northwest Research Station, U.S. Forest Service, 1988.
Yokelson, R. J., Griffith, D. W. T., and Ward, D. E.: Open path Fourier transform infrared studies of large scale laboratory biomass fires, J. Geophys. Res., 101(D15), 21 067–21 080, 1996. Yokelson, R. J., Susott, R., Ward, D. E., Reardon, J., and Griffith, D. W. T.: Emissions from smoldering combustion of biomass measured by open-path Fourier transform infrared spectroscopy, J. Geophys. Res., 102(D15), 18 865–18 877, 1997.