HAL Id: hal-00481757
https://hal.archives-ouvertes.fr/hal-00481757
Submitted on 10 May 2021
HAL is a multi-disciplinary open access
archive for the deposit and dissemination of
sci-entific research documents, whether they are
pub-lished or not. The documents may come from
teaching and research institutions in France or
abroad, or from public or private research centers.
L’archive ouverte pluridisciplinaire HAL, est
destinée au dépôt et à la diffusion de documents
scientifiques de niveau recherche, publiés ou non,
émanant des établissements d’enseignement et de
recherche français ou étrangers, des laboratoires
publics ou privés.
Distributed under a Creative Commons Attribution| 4.0 International License
Climate effects and benthic-pelagic coupling in the
North Sea.
R.R. Kirby, Gregory Beaugrand, J.A. Lindley, A.J. Richardson, M. Edwards,
P.C. Reid
To cite this version:
R.R. Kirby, Gregory Beaugrand, J.A. Lindley, A.J. Richardson, M. Edwards, et al.. Climate effects
and benthic-pelagic coupling in the North Sea.. Marine Ecology Progress Series, Inter Research, 2007,
pp.31-38. �hal-00481757�
INTRODUCTION
Large-scale changes have occurred in the abundance, distribution and seasonal cycles of plankton in the North Sea in recent years that are apparently climate driven (Beaugrand et al. 2002, 2003, Edwards & Richardson 2004). In particular, there has been an increase in the abundance of the merozooplankton (larval planktonic stages) and decrease in the abundance of the holozoo-plankton (Lindley & Batten 2002). Most of these changes have been detected in the North Sea using samples collected by the Continuous Plankton Recorder (CPR)
survey (see Fig. 2) (Warner & Hays 1994). For example, Table 1 shows the changes in echinoderm larvae (mero-zooplankton, larval planktonic stages) and copepods (holozooplankton) from 1949 to 2002. Measurements of Phytoplankton Colour Index (a measure of phytoplank-ton chlorophyll) derived from the CPR survey (Batten et al. 2003a, Raitsos et al. 2005) have also increased over the whole North Sea since 1987 and chlorophyll levels are now also higher throughout the year (Edwards et al. 2001). All these changes in the plankton have had sig-nificant implications for ecosystem structure, including commercial fisheries (Beaugrand et al. 2003).
© Inter-Research 2007 · www.int-res.com *Email: [email protected]
Climate effects and benthic–pelagic coupling in the
North Sea
Richard R. Kirby
1,*, Gregory Beaugrand
2, John A. Lindley
3, Anthony J. Richardson
3, 4,
Martin Edwards
3, Philip C. Reid
31University of Plymouth, School of Biological Sciences, Drake Circus, Plymouth PL4 8AA, UK 2Station Marine Wimereux, CNRS UMR 8013 ELICO, Lille University, BP 80, 62930 Wimereux, France 3The Sir Alister Hardy Foundation for Ocean Science, The Laboratory, Citadel Hill, The Hoe, Plymouth PL1 2PB, UK
4
Present address: Department of Mathematics, University of Queensland, St. Lucia 4072, Queensland, Australia
ABSTRACT: The North Sea is one of the most biologically productive ecosystems in the world and supports important fisheries. Climate-induced changes occurred in the pelagic ecosystems of the North Sea during the 1980s. These changes, which have been observed from phytoplankton to fish and among permanent (holoplankton) and temporary (meroplankton) plankton species, have resulted in alterations in plankton community composition and seasonality. Until now, the effects of climate-driven changes on biological linkages between pelagic and benthic ecosystems have not been examined. The present study indicates that changes in benthic organisms could have a pro-found effect on the trophodynamics of the pelagos. We demonstrate this by analyses of a long-term time series of North Sea plankton and sea surface temperature data. We discover that pronounced changes in the North Sea meroplankton, mainly related to an increased abundance and spatial dis-tribution of the larvae of a benthic echinoderm, Echinocardium cordatum, result primarily from a
stepwise increase in sea temperature after 1987 that has caused warmer conditions to occur earlier in the year than previously. Key stages of reproduction in E. cordatum, gametogenesis and spawning,
appear to be influenced by winter and spring sea temperature and their larval development is affected by the quantity and quality of their phytoplankton food. Our analyses suggest that a new thermal regime in the North Sea in winter and spring may have benefited reproduction and survival in this benthic species. As a result, E. cordatum may be altering the trophodynamics of the summer
pelagic ecosystem through competition between its larvae and holozooplankton taxa.
KEY WORDS: Benthic–pelagic coupling · Global warming · Echinocardium · North Sea · Plankton ·
Temperature
Resale or republication not permitted without written consent of the publisher
O
PEN
PEN
Mar Ecol Prog Ser 330: 31–38, 2007
Notable among the changes in the North Sea mero-plankton taxa are increases in the relative and absolute abundance of the larvae of benthic echinoderms (Lind-ley & Batten 2002) and an advance by 47 d, over 45 yr, in their timing of peak occurrence; this represents the largest phenological change detected in the plankton of this region so far (Greve et al. 2001, Edwards & Richardson 2004). To determine which echinoderm species are involved in the increase in the meroplank-ton we sampled echinoderm larvae at the time of their peak abundance in June and July 2004 from CPR tow-routes between 53 and 58° N, and 0 and 7° E (Kirby & Lindley 2005). Genetic analysis revealed that larvae of
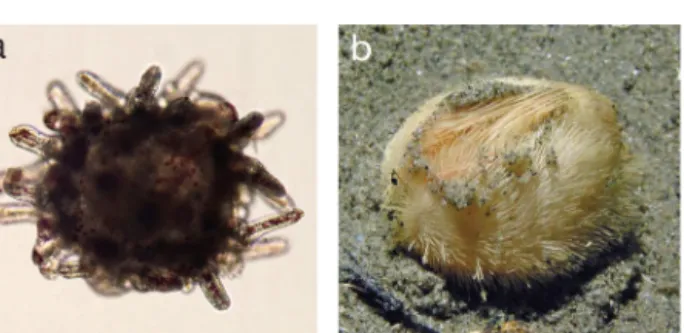
Echinocardium cordatum (Fig. 1), a burrowing
psam-mivorous spatangoid, were overwhelmingly dominant in these samples (Kirby & Lindley 2005). E. cordatum
was also the dominant species of echinoderm larvae in the North Sea plankton from 1949 to 1951 (Rees 1954). Although we cannot rule out changes in echinoderm community composition, changes in the meroplankton between the period 1949 to 1951 and the year 2004 therefore appear to be due to a substantial increase in the larvae of an established species.
The greater abundance of Echinocardium cordatum
larvae in the North Sea plankton could result from enhanced individual fecundity, more adults reproduc-ing or improved larval survival. Temperature, through its influence on physiological processes, has the poten-tial to affect all these life-history stages (Rumrill 1990, Sheader 1996, Fischer et al. 2003, Nunes & Jangoux 2004). The abundance of phytoplankton food will also affect the development of planktonic E. cordatum
lar-vae (Feneaux et al. 1994) and sedimented phytoplank-ton is likely to influence recruitment and growth of the benthic adults (Ólafsson et al. 1994, Millar & Emlet 1999, Nunes & Jangoux 2004). We have therefore examined whether long-term temporal and spatial changes in temperature in the North Sea, and changes in the abundance of phytoplankton food, might explain changes in the abundance of E. cordatum larvae in the
plankton.
MATERIALS AND METHODS
Sampling of North Sea plankton by the CPR. Plank-ton data for the North Sea from 1949 to 2003 were col-lected by the CPR survey (Warner & Hays 1994) (Fig. 2); this data is available upon request from the Sir Alister Hardy Foundation for Ocean Science (www.sahfos.ac.uk) that runs the CPR survey. The CPR is an upper layer plankton sampler towed behind mer-chant ships on regular routes. Seawater enters the ma-chine through a front aperture and the plankton are re-tained on a moving band of silk gauze of mesh size 280 µm that is slowly wound into a tank of formalin (Batten et al. 2003b). In the laboratory the gauze is cut into sections (a CPR sample), each representing the plankton from 3 m3of water taken during 10 nautical
miles (18 km) of tow at an average depth of 7 m, and up to 450 taxa are identified and enumerated visually (Richardson et al. 2006) or by using molecular genetic
32
Echinoderm larvae Copepods 1949–1953 247.3 (57.9) 1231.4 (120.2) 1965–1969 174.5 (46.0) 646.6 (77.6) 1981–1985 220.1 (169.4) 534.5 (220.2) 1988–1992 268.4 (79.7) 629.0 (71.6) 1998–2002 620.2 (87.6) 457.6 (19.2) Table 1. Echinoderm larvae and copepods in the North Sea. Data are means (± SD) of annual total values in the Continu-ous Plankton Recorder (CPR) database for copepods and echinoderm larvae for five 5 yr periods within the area 51 to 61° N, 3° W to 11° E, from 1949 (first year for which data were
available for echinoderms) to 2002
Fig. 1. Echinocardium cordatum. (a) Post-larval stage, which
has increased in abundance in North Sea Continuous Plank-ton Recorder (CPR) samples. Scale bar = 0.1 mm. (b) Adult on sediment surface. Raised sediment around its base is
formed as the animal burrows to 10–15 cm depth, where it normally lives (image © Kåre Telnes, www.seawater.no).
Scale bar = 1 cm
Fig. 2. Continuous Plankton Recorder (CPR) tow-routes and sampling (black dots) in the North Sea between 1946
methods (Kirby & Lindley 2005). The survey has oper-ated in the North Sea and North Atlantic on a routine monthly basis since 1946 and is the largest marine bio-logical time series in the world; data on echinoderm larvae in the North Sea were first recorded in 1949.
Examination of long-term biological change. Long-term change in the echinoderm larvae and the Phyto-plankton Colour Index of North Sea CPR samples were examined by spatialised standardised principal com-ponent analysis (PCA). The Phytoplankton Colour Index of each CPR sample is an index of the amount of chlorophyll that is routinely assessed subjectively by comparison of the silk sample to a colour chart (Batten et al. 2003a). This Phytoplankton Colour Index is corre-lated with fluorimeter and satellite measures of chloro-phyll (Batten et al. 2003a, Raitsos et al. 2005). The PCA analyses were applied on a matrix of 154 geographical squares (latitudes from 50.5 to 60.5° N and from 3.5° W to 9.5° E) × 54 yr (1949 to 2002). Eigenvectors and prin-cipal components were calculated from a correlation matrix of 154 × 154 geographical squares. This analysis allows spatial and temporal changes to be taken into account in a single procedure. Maps of eigenvectors show where the main patterns of temporal variability (represented by principal components) occur. Such analyses have been described in Beaugrand et al. (2001) and are identical to the analysis performed on sea level pressure to identify the main pattern of clima-tological variability (Hurrell & van Loon 1997).
Examination of long-term changes in sea surface temperature (SST). Temperature data for the North Sea were obtained from the COADS 1-degree enhanced dataset provided by the comprehensive NOAA-CIRES Climate Diagnostics Center database (Boulder, Colorado, USA) (Woodruff et al. 1998). The data were analysed by standardised PCA. Therefore, the dispersion matrix S was a correlation matrix. The same equations were used to calculate eigenvectors and principal components. This analysis was per-formed on the matrix 57 yr (1946 to 2002) × 12 mo to identify months for which the year-to-year signal was strongest. The method used here was similar to that previously applied in Beaugrand et al. (2003). A dis-continuity analysis called split moving-window bound-ary analysis (Webster 1973) was applied to detect rapid changes, which are persistent in time series. The prin-ciple of this method is simple and can be summarised in 4 steps: (1) a period of even-numbered size is intro-duced at the beginning of the time series; (2) this period is divided into 2 windows (here a window of 8 yr, which was chosen after examination of the auto-correlation function); (3) an association coefficient (here the Euclidean distance) is used to evaluate the differences between both time periods; and (4) the window is then moved from year to year, repeating
steps 2 and 3 until the end of the time series is reached. The probability of change was estimated by using a Multiple Response Permutation Procedure (Mielke et al. 1981). To determine if the SST or thermal character-istics of the North Sea have changed temporally, we calculated the number of days needed to reach a range of SSTs between 4 and 16°C over the period 1946 to 2002; these temperatures were chosen as they are the minimum and maximum North Sea SST for winter and spring. We used a standardised PCA to examine spa-tial change in North Sea SST; this was performed on the matrix 1° (lat./long.) grid × number of days from the beginning of the year needed to reach a given temper-ature over 57 yr (1946 to 2002).
Examination of the relationship between biological and physical change. The Pearson linear correlation coefficient was used to assess the relationships between long-term changes in the zooplankton and the hydro-climatic environment. Probabilities of signif-icance (p) of coefficients of correlation were calculated, taking into consideration the temporal autocorrelation. A Box-Jenkins (Box & Jenkins 1976) autocorrelation function modified by Chatfield (1996) was used to assess the temporal dependence of years and a Chel-ton (1984) formula was applied to adjust the degrees of freedom. Series were detrended by the use of Singular Spectrum Analysis (Vautard & Ghil 1992). The method uses a principal component analysis performed on an autocovariance matrix (also called a Toeplitz matrix) to decompose a time series into a succession of signals of decreasing variance (Beaugrand & Reid 2003). The long-term trend of each time series was first assessed by using both the eigenvectors and principal compo-nents representing the low-frequency variability; the detrended time series were then calculated by sub-tracting from each original time series its respective long-term trend.
RESULTS
Pronounced increase in winter and spring SST in the North Sea after 1987
A PCA performed on long-term monthly SST for the North Sea indicated that pronounced changes in temperature had occurred in the late 1980s mainly for the months January to May, when the SST is close to the sea bottom temperature in most continental shelf waters (from January to May the eigenvector values varied between 0.626 and 0.915 and from June to December the eigenvector values were between 0.08 and 0.52) (Fig. 3). A discontinuity analysis indicated that a marked stepwise increase in North Sea SST (p<
Mar Ecol Prog Ser 330: 31–38, 2007
Positive covariation between changes in echinoderm larvae and SST
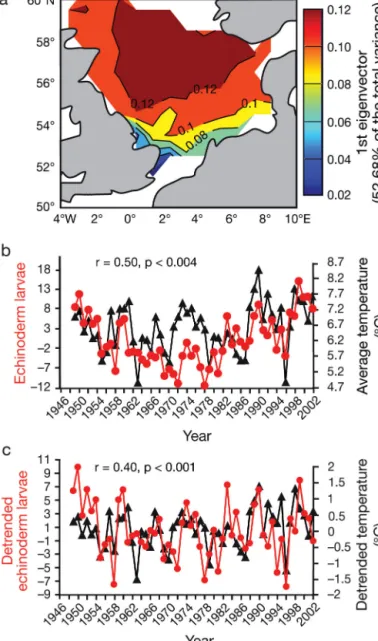
Long-term changes in echinoderm larvae show an in-crease in abundance for most parts of the North Sea, but particularly in the central and northern regions (Fig. 4a). Correlations calculated between SST (in win-ter and spring, January to May) and the abundance of echinoderm larvae (original time series, Fig. 4b; de-trended time series, Fig. 4c) indicated the existence of a significant link between these 2 variables (original data r = 0.50, p < 0.004; detrended data r = 0.40, p < 0.001). After removal of the long-term trend the residuals re-vealed high year-to-year variability between the 2 time series and an immediate response of larval numbers to temperature.
Appearance of warmer conditions earlier in the year in the North Sea
Gametogenesis in Echinocardium cordatum
com-mences when sea temperature exceeds 6°C (Nunes & Jangoux 2004). Fig. 5a shows that any given tempera-ture within the range 4 and 16°C now appears earlier in the year especially for winter and spring temperatures. A correlation analysis indicated that the increase in abun-dance of echinoderm larvae is positively correlated with an increase in the number of days above 6°C (r = 0.70, p < 0.001; probability adjusted for temporal autocorrela-tion). Fig. 5b shows the average North Sea SST from Jan-uary to March for 2 time periods, 1946 to 1987 and 1988 to 2002, which reveals that a larger area of the North Sea is now warmer at this time of year. The mean numbers of echinoderm larvae per sample for these 2 periods were 252.2 ± 132.2 (1949 to 1987) and 403.6 ± 203.4 (1988 to
2002). A PCA on the matrix 1° grid × number of days needed to reach a given temperature over 57 yr (1946 to 2002) confirmed there has been a reduction in the num-ber of squares with temperatures less than 7°C after the mid-1980s (the first principal component explained 58.95% of the variance). There was a highly significant positive correlation between this reduction and in-creased larval echinoderm abundance (r = 0.59, p < 0.001; probability adjusted for temporal autocorrelation).
34
Fig. 3. Variation in North Sea sea surface temperature (SST), expressed as standard deviations from mean North Sea SST (black triangles) for 1946 to 2002. Vertical dashed line = step change in 1987, as determined by discontinuity analysis. Hor-izontal dashed lines = means for the 2 periods, which were –0.538 SD (1946 to 1987) and +1.9530 SD (1988 to 2002)
Fig. 4. Echinocardium cordatum. Spatial correlations be-tween larval abundance (log10(x+1) transformed) and sea
surface temperature (SST) in the North Sea for period 1949 to 2002. (a) Long-term spatial changes in the first eigenvector of larval abundance in the North Sea. (b) Average SST from January to May of each year (m) and first principal component of matrix 54 yr × 12 mo larval abundance (d). (c) Detrended
time series of temperature (m) and first principal component of larval abundance (d)
Correlation between spatial distribution of echinoderms and increasing SST
Fig. 6a,b shows the change in the abundance of echinoderm larvae between the 2 periods 1949 to 1987 and 1988 to 2002. They reveal a pronounced north-ward expansion of echinoderm larvae; this is particu-larly evident when the difference between these 2
periods is examined (Fig. 6c). Spatial correlations pro-vide epro-vidence that the increase in larvae to the north has been influenced by the increase in SST (Fig. 6d).
Long-term changes in phytoplankton and echinoderm larvae
Food availability influences echinoderm larval development and survival (Feneaux et al. 1994). Fig.7a shows the long-term changes in the Phytoplankton Colour Index and in echinoderm larval abundance in the North Sea for the period 1958 to 2002. Correlation analysis between Phytoplankton Colour Index and the abundance of echinoderm larvae indicated there is no significant correlation between the variables over the whole of the North Sea (r = 0.31, p = 0.331; probability adjusted for temporal autocorrelation). However, local correlation analysis indicates a stronger positive rela-tionship between changes in the Phytoplankton Colour Index and echinoderm larvae in the northern North Sea (Fig.7b), where the change in abundance of echino-derm larvae is the greatest (Fig. 6c).
DISCUSSION
The recent dominance of the larvae of benthic echin-oderms in the plankton in summer (Lindley & Batten 2002) represents a major change in the balance between the meroplankton and the holoplankton and is indicative of a shift in resource partitioning between the benthos and pelagos. The abundance of adult
Echinocardium cordatum is influenced by temperature
(Moore 1936, Beukema 1985) and our analyses also suggest that sea temperature has an important influ-ence on the numbers of E. cordatum larvae in the
plankton. Discontinuity analysis indicates that a step-wise change towards a warmer thermal regime occurred in the North Sea after 1987. The strong con-temporaneous link between winter and spring North Sea SST and the abundance of echinoderm larvae in the summer is notable (for example, the cold winter of 1996, which was a year with a negative North Atlantic Oscillation, led to reduced larval abundance in the summer of the same year [Fig. 4b,c]).
Echinocardium cordatum requires 3 yr to reach
maturity in the North Sea (Buchanan 1966) and may live for more than 10 yr, although cold winters can cause high mortality (Beukema 1985). Gametogenesis in adult E. cordatum is initiated towards the end of
winter, when North Sea winter temperature exceeds 6°C (Nunes & Jangoux 2004). We have shown that winter temperatures colder than the 6°C lower thresh-old for the initiation of gametogenesis (Nunes &
Jan-Fig. 5. Changes in sea surface temperature (SST) in the North Sea. (a) Three-dimensional plot of number of days required to reach certain SST in the North Sea each year, showing pronounced shift (dashed line) after 1987. (b) Change in winter (January to March) SST for 2 periods, 1946–1987 and 1988–2002, revealing warmer conditions in winter in
Mar Ecol Prog Ser 330: 31–38, 2007
goux 2004) have been less frequent since 1987 and that the spatial extent of regions in the North Sea in winter above the threshold temperature have also increased. In poikilotherms, temperature can also affect egg size and number, which are phenotypically plastic traits; warmer temperatures during gametogenesis are asso-ciated typically with smaller eggs and larger clutch sizes (Sheader 1996, Fischer et al. 2003). In all these ways therefore, warmer winter temperatures in the North Sea after 1987 may influence both the number of adult E. cordatum that are reproducing in any year and
their individual fecundity. Since spawning in E. corda-tum may also be influenced by temperature, in this
case the achievement of a threshold temperature between 10 and 13°C (Nunes & Jangoux 2004), higher spring temperatures earlier in the year in the North Sea might also explain the phenological shift recorded in peak larval echinoderm abundance (Edwards & Richardson 2004).
In marine invertebrates with planktonic larvae, sea temperature during the larval stage can also influence larval survival, and hence abundance, by reducing the time spent in the plankton, which is a period of high mortality (Rumrill 1990). Growth and development of the planktonic larvae of benthic echinoderms is also affected by the abundance and quality of their phyto-plankton food (Feneaux et al. 1994). We found a rela-tionship with larval echinoderm abundance and the CPR Phytoplankton Colour Index in the northern North Sea, where phytoplankton biomass and chloro-phyll is the lowest historically (Colebrook & Robinson 1965). Together with the phenological changes in the North Sea among phytoplankton and grazing holozoo-plankton that has created a mismatch in the food chain (Edwards & Richardson 2004), changes in phytoplank-ton in the northern North Sea may help support the increase in abundance of Echinocardium cordatum in
this region.
36
Fig. 6. Echinocardium cordatum. Spatial variation in larvae abundance and the correlation with sea surface temperature (SST)
in the North Sea. (a) Abundance between 1949 and 1987; (b) abundance between 1988 and 2002; (c) difference in abun-dance between the 2 periods 1949–1987 and 1988–2002, showing change in abunabun-dance to be greatest in northern North Sea;
Increased larval abundance may improve recruit-ment (Ólafsson et al. 1994, Millar & Emlet 1999) and warmer winters after 1987 may reduce adult mortality (Moore 1936, Beukema 1985). In this way, warmer conditions in the North Sea after 1987, together with increased phytoplankton, may act synergistically to increase the reproductive output, population density and habitat range of Echinocardium cordatum year
after year. The large increase in echinoderm larvae between 1998 and 2002 is entirely consistent with our hypothesis that temperature influences larval abun-dance, since 1998 was the warmest year since the beginning of instrumental records (see Intergovern-mental Panel on Climate Change WGI 2001; their Fig. 5). The rise in abundance of the merozooplank-ton (Lindley & Batten 2002), which comprises pre-dominantly E. cordatum larvae (Kirby & Lindley
2005), may therefore reflect the synergy we propose. This may also explain observations from recent ben-thic surveys (Anonymous 2004) that indicate E. cor-datum has increased in density and extended its
range, particularly in the shallow waters of the Ger-man Bight, the coldest area of the North Sea in win-ter (Lee & Ramswin-ter 1981).
It is hypothesised that the ecological regime shift that occurred in the North Sea plankton during the 1980s is related to changes in hydro-climatic forcing (Beaugrand 2004). This present study found an imme-diate response of echinoderm larval abundance to win-ter and spring sea surface temperature and a stepwise warming in North Sea surface temperature after 1987, particularly in winter and spring. Together, they sug-gest that climate changes are the most likely cause of the increase in echinoderm larval abundance and spatial distribution in the North Sea. The resulting increase in echinoderm larvae could now act to rein-force the new ecological regime by competitive exclu-sion of other holozooplanktonic taxa during spring and summer, such as copepods whose abundance has declined at this time of year.
This North Sea study, which shows the impact of cli-mate on the biological linkages between different ecosystem components, highlights the importance of understanding the interrelated biological changes that will occur if forecasts of global climate change are realised. Our results also clearly suggest new areas of research. Experimental investigation of the effect of temperature on the biology of Echinocardium corda-tum would test our hypothesis of the influence of the
regime shift, which is currently based upon data from observational studies. Laboratory experiments investi-gating competition between E. cordatum larvae and
holozooplankton for phytoplankton food would test our hypothesis regarding the impact of E. cordatum larvae
on plankton trophodynamics.
Acknowledgements. R.R.K is a Royal Society University
Research Fellow. This work was supported by a grant from the Natural Environment Research Council of the UK (NER/B/S/2002/00306). We thank R. Pingree and D. Griffiths in the Ocean Colour and Climate group at the Marine Biolog-ical Association of the UK for advice. We also thank the owners, masters and crews of the ships that tow CPRs on a voluntary basis.
LITERATURE CITED
Anonymous (2004) Report of the study group on the North Sea benthos project. 2000. Copenhagen: ICES Marine Habitat Committee, ICES CM/E:05. (NB not to be cited without prior consultation with the General Secretary: [email protected])
Batten SD, Walne AW, Edwards M, Groom SB (2003a) Phyto-plankton biomass from continuous Phyto-plankton recorder data: an assessment of the phytoplankton colour index. J Plankton Res 25:697–702
Batten SD, Clark R, Flinkman J, Hays G and 7 others (2003b) CPR sampling: the technical background, materials and methods, consistency and comparability. Prog Oceanogr 58:193–215
Fig. 7. Long-term changes in Echinocardium cordatum larval
abundance and Phytoplankton Colour Index in the North Sea for period 1958 to 2002. (a) First principal component of changes in larval abundance (d) and first principal compo-nent of changes in the Phytoplankton Colour Index (m). (b) Spatial variation in the correlation between larval abun-dance and Phytoplankton Colour Index showing greatest correlation in the northern North Sea, where the change in
Mar Ecol Prog Ser 330: 31–38, 2007
Beaugrand G (2004) The North Sea regime shift: evidence, causes, mechanisms and consequences. Prog Oceanogr 60:245–262
Beaugrand G, Reid PC (2003) Long-term changes in phyto-plankton, zooplankton and salmon linked to climate. Glob Change Biol 9:801–817
Beaugrand G, Ibañez F, Lindley JA (2001) Geographical dis-tribution and seasonal and diel changes of the diversity of calanoid copepods in the north Atlantic and North Sea. Mar Ecol Prog Ser 219:205–219
Beaugrand G, Reid PC, Ibañez F, Lindley JA, Edwards M (2002) Reorganization of Atlantic marine copepod biodi-versity and climate. Science 296:1692–1694
Beaugrand G, Brander KM, Lindley JA, Souissi S, Reid PC (2003) Plankton effect on cod recruitment in the North Sea. Nature 426:661–664
Beukema JJ (1985) Growth and dynamics in populations of
Echinocardium cordatum living in the North Sea of the
Dutch north coast. Neth J Sea Res 19:129–134
Box GEP, Jenkins GW (1976) Time series analysis: forecasting and control. Holden-Day, San Francisco, CA
Buchanan JJ (1966) The biology of Echinocardium cordatum
(Echinodermata: Spatangoidea) from different habitats. Mar Biol Assoc UK 46:97–114
Chatfield C (1996) The analysis of time series: an introduc-tion. Chapman & Hall/CRC, London
Chelton DB (1984) Commentary: short-term climatic variabil-ity in the northeast Pacific Ocean. In: Pearcy W (ed) The influence of ocean conditions on the production of salmonids in the North Pacific. Oregon State University Press, Corvallis, OR, p 87–99
Colebrook JM, Robinson GA (1965) Continuous plankton records: seasonal cycles of phytoplankton and copepods in the north-eastern Atlantic and the North Sea. Bull Mar Ecol 6:123–129
Edwards M, Richardson AJ (2004) Impact of climate change on marine pelagic phenology and trophic mismatch. Nature 430:881–884
Edwards M, Reid PC, Planque B (2001) Long-term and regional variability of phytoplankton biomass in the Northeast Atlantic (1960–1995). ICES J Mar Sci 58:39–49 Feneaux L, Strathmann MF, Strathmann RR (1994) Five tests of food-limited growth of larvae in coastal waters by com-parison of rates of development and form of echinoplutei. Limnol Oceanogr 39:84–98
Fischer K, Brakefield PM, Zwaan BJ (2003) Plasticity in but-terfly egg size: Why larger offspring at lower tempera-tures? Ecology 84:3138–3147
Greve W, Lange U, Reiners F, Nast J (2001) Predicting the seasonality of North Sea zooplankton. Senckenb Marit 31:263–268
Hurrell JW, van Loon H (1997) Decadal variations in climate associated with the North Atlantic Oscillation. Clim Change 36:301–326
Intergovernmental Panel on Climate Change WGI (2001) Climate change 2001. The scientific basis. Cambridge
University Press, Cambridge
Kirby RR, Lindley JA (2005) Molecular analysis of Continuous Plankton Recorder samples, an examination of echino-derm larvae in the North Sea. J Mar Biol Assoc UK 85:451–459
Lee AJ, Ramster RW (1981) Atlas of the seas around the British Isles. Fish Res Tech Rep 20
Lindley JA, Batten SD (2002) Long-term variability in the diversity of North Sea zooplankton. J Mar Biol Assoc UK 82:31–40
Mielke PW, Berry KB, Brier GW (1981) Application of multi-response permutation procedures for examining seasonal changes in monthly mean sea-level pressure patterns. Mon Weather Rev 109:120–126
Millar BA, Emlet RB (1999) Development of newly metamor-phosed juvenile sea urchins (Strongylocentrotus francis-canus and S. purpuratus): morphology, the effects of
tem-perature and larval food ration, and a method for determining age. J Exp Mar Biol Ecol 235:67–90
Moore HB (1936) The biology of Echinocardium cordatum.
J Mar Biol Assoc UK 20:655–671
Nunes C de AP, Jangoux M (2004) Reproductive cycle of the spatangoid echnoid Echinocardium cordatum
(Echinoder-mata) in the southwestern North Sea. Invertebr Reprod Dev 45:41–57
Ólafsson EB, Peterson CH, Ambrose WG (1994) Does recruit-ment limitation structure populations and communities of macro-invertebrates in marine soft sediments: the rela-tive significance of pre- and post-settlement processes? Oceanogr Mar Biol Annu Rev 32:63–109
Raitsos DE, Reid PC, Lavender SJ, Edwards M, Richardson AJ (2005) Extending the SeaWIFS chlorophyll data set back 50 years in the northeast Atlantic. Geophys Res Lett 32:L06603, doi:10.1029/2005GL022484
Rees CB (1954) Continuous plankton records: the distribution of echinoderm and other larvae in the North Sea, 1947–51. Bull Mar Ecol 4:47–67
Richardson AJ, Walne AW, John AWG, Jonas TD, Lindley JA, Sims DW, Stevens D, Witt M (2006) Using continuous plankton recorder data. Prog Oceanogr 68:27–74 Rumrill SS (1990) Natural mortality of marine invertebrate
larvae. Ophelia 32:163–198
Sheader M (1996) Factors influencing egg size in the gam-marid amphipod Gammarus insensibilis. Mar Biol 124:
519–526
Vautard RPY, Ghil M (1992) Singular-spectrum analysis: a toolkit for short, noisy chaotic signals. Physica D 58: 95–126
Warner AJ, Hays GC (1994) Sampling by the continuous plankton recorder survey. Prog Oceanogr 34:237–256 Webster R (1973) Automatic soil-boundary location from
transect data. J Int Assoc Math Geol 5:27–37
Woodruff SD, Diaz HF, Elms JD, Worley SJ (1998) COADS release 2 data and metadata enhancements for improve-ments of marine surface flux fields. Phys Chem Earth 23:517–527
38
Editorial responsibility: Otto Kinne (Editor-in-Chief), Oldendorf/Luhe, Germany
Submitted: April 19, 2006; Accepted: June 8, 2006 Proofs received from author(s): January 16, 2007