Publisher’s version / Version de l'éditeur:
Vous avez des questions? Nous pouvons vous aider. Pour communiquer directement avec un auteur, consultez la
première page de la revue dans laquelle son article a été publié afin de trouver ses coordonnées. Si vous n’arrivez pas à les repérer, communiquez avec nous à [email protected].
Questions? Contact the NRC Publications Archive team at
[email protected]. If you wish to email the authors directly, please see the first page of the publication for their contact information.
https://publications-cnrc.canada.ca/fra/droits
L’accès à ce site Web et l’utilisation de son contenu sont assujettis aux conditions présentées dans le site
LISEZ CES CONDITIONS ATTENTIVEMENT AVANT D’UTILISER CE SITE WEB.
Technical Translation (National Research Council of Canada), 1983
READ THESE TERMS AND CONDITIONS CAREFULLY BEFORE USING THIS WEBSITE. https://nrc-publications.canada.ca/eng/copyright
NRC Publications Archive Record / Notice des Archives des publications du CNRC : https://nrc-publications.canada.ca/eng/view/object/?id=72e15cdb-4596-480e-a651-fa769290d3cd https://publications-cnrc.canada.ca/fra/voir/objet/?id=72e15cdb-4596-480e-a651-fa769290d3cd
Archives des publications du CNRC
For the publisher’s version, please access the DOI link below./ Pour consulter la version de l’éditeur, utilisez le lien DOI ci-dessous.
https://doi.org/10.4224/20358507
Access and use of this website and the material on it are subject to the Terms and Conditions set forth at
Soil vibrations and damage criteria
NATIONAL RESEARCH COUNCIL CANADA CONSEIL NATIONAL DE RECHERCHES CANADA
TECHNICAL TRANSLATION
TRADUCTION TECHNIQUE 2072
Authors/Auteurs: Ti tle/Titre:
R. Holmberg, N. Lundborg and G. Rundqvist. Soil vibrations and damage criteria.
Reference/Reference: Translator/Traducteur: Markvibrationer och R85:1981) 1-38, 1981. P.J.E. Glynn. skadekriterier (Report;
Canada Lnsti tut,e for' Sci ent.Lf'Lc
and Technical Information
Institut canadien de l'information scientifique et technique
Ottawa, Canada KlA OS2
PREFACE
Blasting represents an important construction technique for loosening and removal of rock and soil materials. However, the vibrations emanating from the blast area can cause damage to nearby buildings and other structures. Criteria for safe blasting levels are therefore of great importance.
This report by the Swedish Council for Building Research presents an analysis of safe vibration levels applicable to blasting and similar construction vibrations. It also presents data from longterm observations of buildings in Sweden. This should prove valuable to contractors, blasting consultants, and those concerned with the formulation of standards for safe blasting.
The Division thanks P.J.E. Glynn who translated this report and J.H. Rainer of the DBR Noise and Vibration Section who checked the translation for technical accuracy.
Ottawa
December 1983
C.B. Crawford Director, DBR/NRC
4 -Page No CONTENTS SUMMARY 1. 2. 3. 3.1 3.1.1 3.1.2 3.1.3 3.1.4 3.3 3.4
3.5
3.6 3.6.1 3.6.2 3.6.33.7
4 5.RELATIONSHIP BETWEEN VIBRATION, CHARGE AND DISTANCE DAMAGE IN BUILDINGS
EXAMINATION INTO REPORTED DAMAGE IN BUILDINGS AS A FUNCTION OF VIBRATION VELOCITY
Passage of wave fronts Tensile stresses
Shear stresses Flexural stresses
Permissible strains for various building materials and examples of vibration stresses
Comparison between theoretical and practical applied limits
Relationship between the number of additional entries in
post-event inspections and the level of vibration measurements Accuracy of pre-event inspection
Ageing of the building
Results of the investigation
Detached houses - apartment blocks Various construction materials Various types of facades
Statistical analysis DISCUSSION REFERENCES 5 5 12 13 14 14 16
17
19 20 22 22 23 24 24 24 24 28 2933
SUMMARY
The present work is a compilation of a large number of projects in the field of soil vibrations where the vertical vibration velocity is viewed as a function of distance and charge weight. The compilation contains very heterogeneous measurement data since the results are based on various measuring techniques and instruments, and may also depend on individual interpretations of vibration values. Supplementary measurements have been made and one single relationship
has been fit to all values.
An examination of damage in buildings as a function of the magnitude of the vibrations has been carried out and compared with similar non-Swedish investigations. This shows that damage can occur at very low vibration values but that the probability of this occurring is small. At 50 mm/s the
probabili ty is thus 40% that cosmetic damage may occur but the likelihood is only 3 - 4% for larger damage. I t will be observed that the investigations were based on changes between records of pre- and post-event inspections of properties. In post-event inspections the pre-event inspection record is used as a reference; a post-event inspection indicates, therefore, never a smaller number of cracks. For this reason it is very likely that there will be a number of additional entries in the post-event inspection record without an actual increase in the number of instances of damage. New instances of damage caused by ageing of the building have not been considered either.
1. THE RELATIONSHIP BETWEEN VIBRATION, CHARGE AND DISTANCE
In an earlier BFR* report (1) a large number of projects were compiled where the vibrations were presented in the form of vertical velocity in mm/s as a
function of
RI
セL
where R is the distance in metres and Q is the instantaneous charge in kg. Fig. 1.1 shows this relationship. An attempt was6
-which is indicated in fig. 1.4 with the charge weight as parameter. In the case of Q
=
1 kg, (1.3) may be written:From fig. 1.4 the relationship can also be obtained for other charge weights, e.g. 1,000 kg, i.e. (1 .2) ( 1.1) (1 .3) (1.4 ) (1.5 ) R (J V= kOHセI V= 1226/( R )1.579
po
V= 724/(&-)1.52 V セ QRRVOHセI 1.579 V=
546/(&-) 1.579is also incorporated in fig. 1.1.
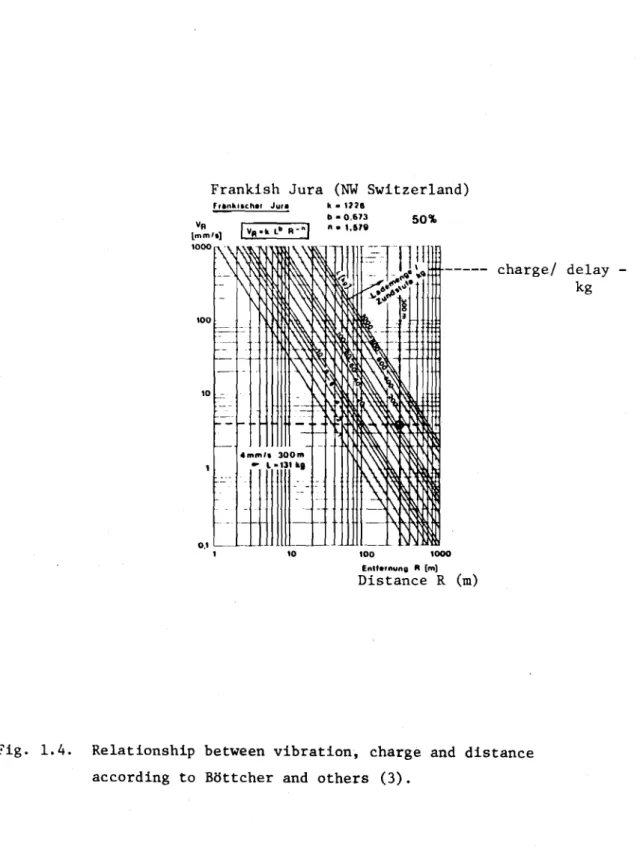
Bottcher, LUdeling and Wurtenhagen (3) stipulate the relationship
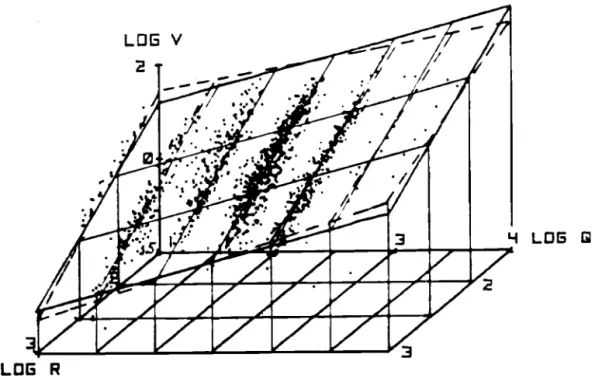
also made to obtain a formula with a better agreement. The principle for this is shown in fig. 1.2. The normal procedure is to adapt straight line bounds or ceilings to the vibration values as function of Rand Q. In the improved f1t the bound is sloped so that the agreement is improved. This fit is, however, complicated and difficult to handle. It furthermore appears that the values at the extremes of the bounded region deviate more from the measured value than with the simpler fit. Because of this and a number of new values it is proposed that the simple fit mentioned above is used, i.e.
(1.4) and (1.5) are incorporated in fig. 1.1.
(1.4) is located significantly above other curves, particularly at short distances, while (1.5) agrees well with other relationships.
where a certain value of R/
(Q
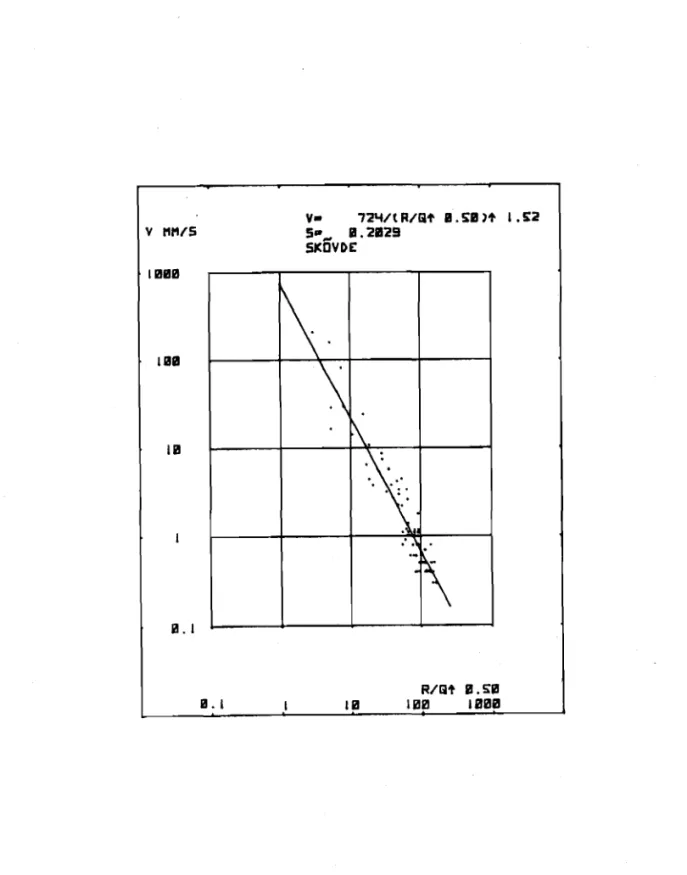
indicates a line having the same "ceiling height" V.Gosta Rundqvist (2) has measured 72 values on vibrations at Cementa AB in Skovde. The values were analyzed on SveDeFo's computer and are shown in fig. 1.3. The charge varied between 40 and 110 kg and the distance varied between 45 and 1,060 metres. This relationship
7
-Medearis (4) states
v
=
388/(&'-) 1.39 ( 1 .6)which also agrees well with the other values.
Vmm'l 1 0 0 0 1 ' \ , t
-\
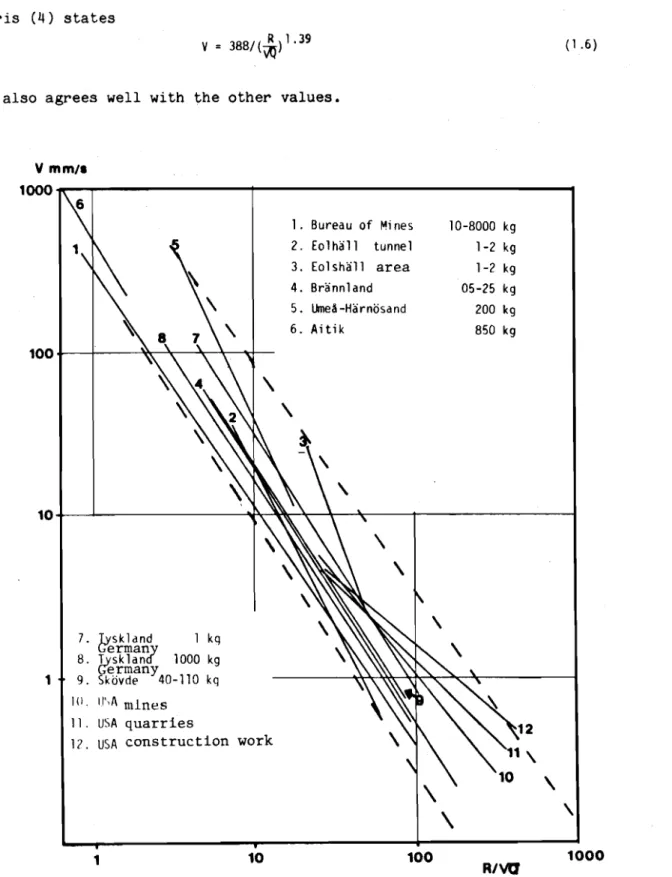
\ 10-8000 kg 1-2 kg 1-2 kg 05-25 kg 200 kg 850 kg 1. Bureau of Mines 2. eッQィセQQ tunnel 3. Eo1ウィセャャ area 4. Brannl and 5. uュ・セMhセイョッウ。ョ、 6. Aitik 7. Tvsk1and 1 kg Germany 8. LYsk1ana 1000 kg Germany 9. Skovde 40-110 kg Io II"A mines 11. USA quarries12. USA construction work
1
10
+---J.
M[Nセ セセイ⦅⦅|⦅セMM⦅⦅エ⦅MMMMMMMMQ100KMMMMKMMセセMMMMMNZ|⦅|⦅[MOMM
1 10 100
RNa
1000Fig. 1.1. Relationship between vibration, charge and distance at various locations. (Editor's note: "9" applies to the line with the arrow).
LOG V
2
LOG R
Fig. 1.2. Threedimensional representation of vibration velocity as a function of
charge weight and distance.
00
Spencer and others (5) indicate various relationships for mines, quarries and factory installations. The mean value for these is
v
=
QSUOHセIoNYX mm/swith R stated in metres and Q in kg.
The following is stated for above mentioned working sites
v
= SQPOHセI 1.rl for mint'sv -
ャooOHセIoNァャ for quarries(1. 7)
(1.8)
(1 .9)
and
v
for construction work (1. 10)The relationships 1.8 - 1.10 are incorporated in fig. 1.1.
Upper and lower limits for the measured relationships have been incorporated in fig. 1.1. The correlation between them is significantly poorer than the spread of the individual values around their mean.
The mean value· from different locations, measured by various authors, is thus less than the scatter in individual measured values at one location when measured by the same person and with the same measuring equipment. (. the spread jn the mean value? - the translator).
The relationships shown in fig. 1. can therefore be considered to provide a good prediction of the vibration which will develop in blasting operations with a certain number of kg (charge) and at a certain distance.
Since the scatter in individual values is greater than that indicated in the figure, it is ineffective to carry out one single trial blasting to obtain a more exact relationship. In locations with varying ground conditions there may, however, be large variations, and there it may be justified to carry out trial blastings. The (observed) scatter should be kept in mind, and a certain number of blastings should be made, using measuring points at various dist.ances and soil types, to obtain an accept.abLe relationship. The magnitude of the spread decides then the size of the margin which must be used to obtain vibrations in subsequent production shots which be below the stipulated limits with some degree of certainty.
fig. 1.3. The relationship between vibration, charge and distance at Cementa AB in Skovde. 10 -R/IU B.!>iI IB2I IBBB IB
1\.
\
t\
|セ
.
:.
..
.
\.:"r\
a ,Ia.
I Iii UIlII 111J1!I11J V 1111/5charge/ delay -kg 100 1000 Entl.,nung RIm] Distance R (m) 10
Frankish Jura (NW Switzerland) f,.nkiuh.r Jur. II. • 1221
b • 0,613 50"
n. \.6111
0,1
I
10
-Fig. 1.4. Relationship between vibration, charge and distance according to Bottcher and others (3).
12
-2. DAMAGE IN BUILDINGS
All existing buildings have different life spans or time periods until damage occurs. The life span depends on the stresses to which the building is exposed, as well as on the resistance of the construction materials to chemical and physical effects. Heat, moisture, loads, settling (subsidence) etc. all cause different movements in the building, and with an optimized selection of construction materials and designs, these movements should take place without a disturbing buildup of stress concentrations in the structural element of the building. If the building design does not achieve this, then cracks will always develop which indicate where these movement-absorbing joints should be installed or where reinforcements should be constructed. This is described in detail by Wilhelmsen and Larsson (15).
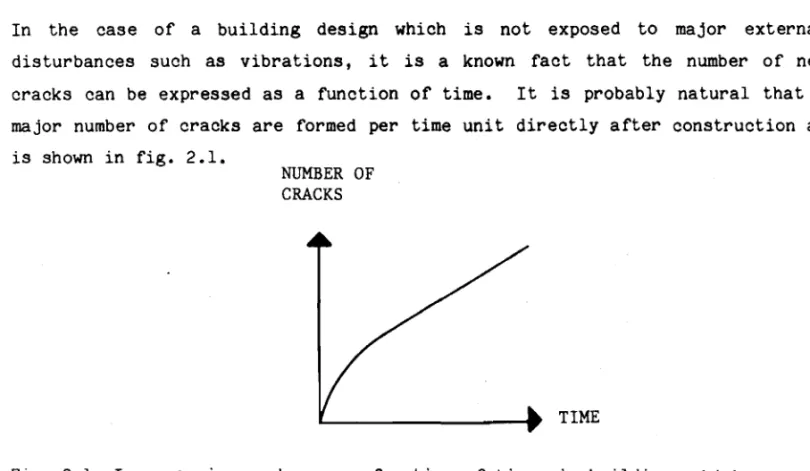
In the case of a building design which is not exposed to major external disturbances such as vibrations, it is a known fact that the number of new cracks can be expressed as a function of time. It is probably natural that a major number of cracks are formed per time unit directly after construction as is shown in fig. 2.1.
NUMBER OF CRACKS
TIME
Fig. 2.1 Increase in cracks, as a function of time, in buildings which are not exposed to external disturbances.
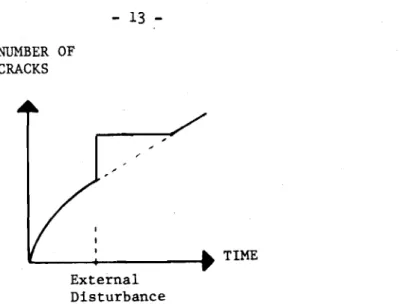
If external disturbances are introduced, then stress concentrations increase, and a number of cracks are triggered instantaneously. Subsequently the natural crack increase per unit of time will probably stagnate until the stress concentrations become once more critical. The formation of cracks will then once more follow the earlier curve according to fig. 2.2.
NUMBER OF CRACKS
セ _ _-+- • TIME
External Disturbance
Fig. 2.2. Crack formation increases instantaneously when the bUilding is exposed to vibrations.
The pre- and post-event inspections, which are compared, usually result in ascribing earlier undetected cracks to vibrations, and it is not taken into consideration that the damage situation would likely be the same after a given unit of time, independent of the introduction or absence of vibrations.
3.
EXAMINATION OF REPORTED DAMAGE IN BUILDINGS AS A FUNCTION OF VIBRATIONVELOCITY
Gosta Rundquist (6) has, by analysis of earlier pre- and post-event inspection recordS, established a relationship between recorded changes and measured vibration velocities.
Because of the relatively limited material (approximately 100 cases) he was only able to study three types of construction materials - wood, lightweight, and regular concrete. He has compared detached houses with apartment blocks and also various cladding materials. This analysis was based on Nitro Consult's archives.
14
-3.1.1 Tensile Stresses 3.1 Passage of Wave Fronts
(3.2)
(3.1 )
0tension is indicated by the relationship
therefore drag = tensile cf =v.[ draq ( O'drag セ L'[ drag
=
tensile E ='l cWhen vibrations have been generated on or in the ground, then the direction of wave propagation in the ground becomes chiefly horizontal; therefore cb and i may be exchanged for c and i in the respective formulae.
b m m
but
When a P-wave is propagated in a material it is exposed to tensile and compression stresses. Since the stress limit for tensile stresses is much lower than for compression stresses, only the former are discussed in the following, although the formulae given apply to both types.
material;
Since vibrations caused by blasting, pile driving, etc. all contain the same types of waves, this section is of general validity. The surface waves of the Rayleigh type are dominant. This wave causes all the types of stresses which are described here. Since i t is, furthermore, surface waves that have the lowest propagation velocity and the highest amplitude, they will expose buildings to the greatest stresses.
The developed stress
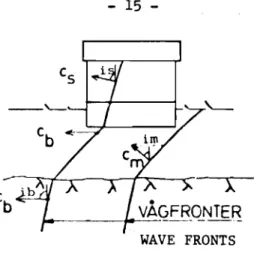
In fact, a similar situation exists in fig. 3.1, where a wave front passes the house foundation with a horizontal velocity component which is of the same magnitude as the propagation velocity c
b in the underlying rock.
15
-)0:
•
__. - -
MM]MZNvセgfrMqnterWAVE FRONTS
Fig. 3.1. Wave fronts for P- or S waves in the ground and in buildings.
Part of the wave energy will be refracted in the structure of the building by an angle i which is determined by the relationship
s sin ; C s ·s;n
;b
(3.3 ) S c b where cb = propagation velocity in rock,c = propagation velocity in the structure, s
independent of the intermediate layer.
The tensile stress in the building structure is then obtained from the relationship Vmax °drag = -c- Estructure s drag
=
tensile (3.4)where V and c are measured in the direction of the wave propagation in the structure.
Along the contact surface of the building and the substratum, a horizontal tensile stress 0h will develop, the magnitude of which will depend both on
or c •s C V <1" or " -2 .Sin i .セッMNNGZ . E II c b b cb structure (3.5)
tensile stress become zero. 16 -3.1.2 Shear Stresses Vmax generally greatest when (3.7) vmax Vmax 'f ma x =-c- .Gst OIlllle; Y = -c-s s
where V and c relate to the particle velocity of the shear wave and to the propagation velocity, respectively. Gstructure
=
shear modulus (Pa) of the building.structure.
sin ゥ「セャL in accordance with the assumptions. c
b
=
the horizontal component (m/s) of the propagation velocity in the rock.c
=
propagation velocity in the structure. sE
=
the modulus of elasticity (Pa) of the bUilding structureThe argument for shear stresses is entirely analogous to that above.
The particle velocity is measured perpendicular to the direction of propagation of the shear wave. Also in this case, two types of stresses are obtained: partly in the lower portion of the ground
Cs . . Vhor Vver t t" =_. ·510 l
b NMセ •Gst Ol111le; y =- c - (3.6) hor cb cb structure b
Rno
pnrt.lyin
the struoture where vhor
=
the horizontal component of vibration velocity (mm/s) in the direction of propagation in the structure.When comparing (3.3) and <3.5) i t is known that V
hor < applies and that c
b > cs; therefore atenSlon. is usually
calculated according to formula (3.4). When the wave front passes through the building i t will be reflected, and at an incident angle of 900 i t will cause a doubling of the particle velocity at the moment of reflection while the
..
17
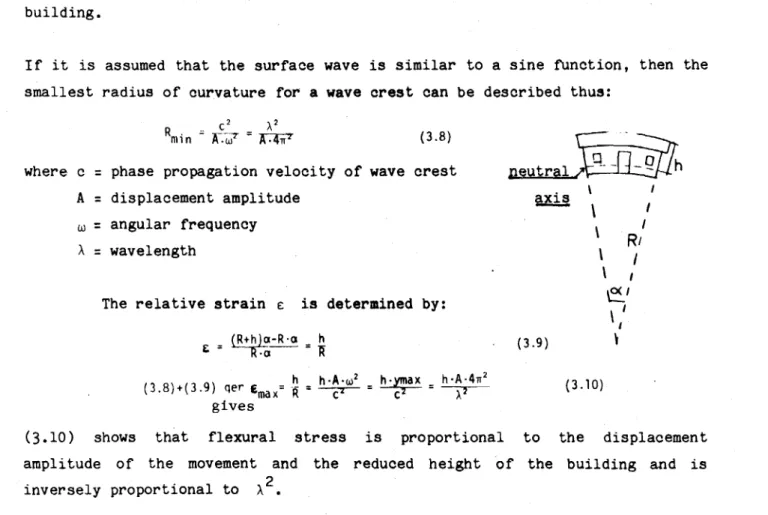
-3.1.3 Bending (Flexural) stressesI t is this type of stress which is presumably dominant in connection with traffic vibrations. It can, however, develop only in low structures. Flexural stresses develop when the bUilding site consists of fairly loose soils, such as clay and sand, where the propagation velocity of the surface wave is low and the wavelength is of the same magnitude as the length of the building.
If it is assumed that the surface wave is similar to a sine function, then the smallest radius of curvature for a wave crest can be described thus:
\
,
'
\
RI
\ I \ I セi \ I I セ (3.10) (3.9)セ
ョ・オエイ。ャセィ
\ I セ (3.8) HrKセャHQMrGHi h & = .(1-- = "R"h h·A·w2 h·ymax h·A·4n2
(3.8)+(3.9) qer £max=
R
=
セ=
セ=
A'gives
The relative strain £ is determined by: where c
=
phase propagation velocity of wave crestA
=
displacement amplitude w=
angular frequency). =
wavelength(3.10) shows that flexural stress is proportional to the displacement amplitude of the movement and the reduced height of the bUilding and is inversely proportional to ).2.
To the flexural stress, as derived above, the tensile and shear stresses must be added; these develop because of the particle motion in the surface wave.
PROPAGATION OF SURFACE WAVE
a b c
A
d .e
*
Editors' note: It is presumed that h here refers to the building height and not to the h in connection with Eqs. 3.9 and 3.10.displacement amplitude A. The figure shows also how a solitary particle moves during this period. It has been assumed that this takes place in the shape of a circle while it is in reality closer to an ellipse. The direction of the velocity vector is also shown for the various phases.
(3.11 )
(3.12)
I t has wavelength A and
18
-Eresultant
Fig. 3.2 shows one period of the surface wave.
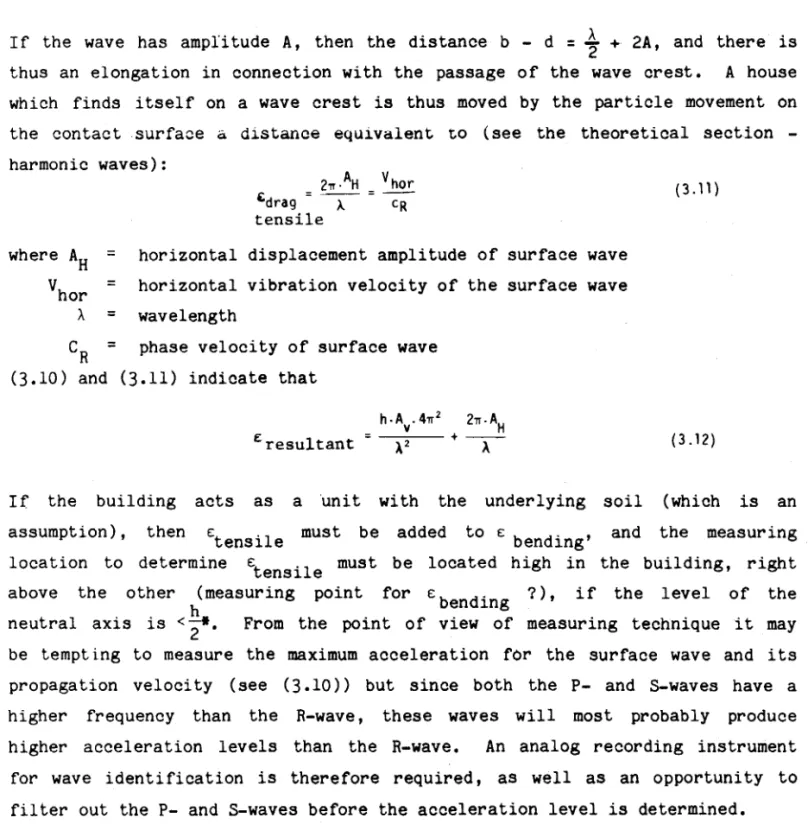
where A
H =
V =
nor
A =
If the wave has amplitude A, then the distance b - d
=
1
+ 2A, and there is thus an elongation in connection with the passage of the wave crest. A house which finds itself on a wave crest is thus moved by the particle movement on the contact surface a distance eqUivalent to (see the theoretical section -harmonic waves):If the building acts as a unit with the underlying soil (which is an assumption), then E:tensile must be added to E: bending' and the measuring location to determine E:t "1 must be located high in the building, right
・ョウセ e
above the other h(measUring point for E: bending ?), if the level of the neutral axis is
<"2*.
From the point of view of measuring technique i t may be tempt ing to measure the maximum acceleration for the surface wave and its pr-opaga tion veloci ty (see (3.10» but since both the P- and S-waves have a higher frequency than the R-wave, these waves will most probably produce higher acceleration levels than the R-wave. An analog recording instrument for wave identification is therefore required, as well as an opportunity to filter out the P- and S-waves before the acceleration level is determined.horizontal displacement amplitude of surface wave horizontal vibration velocity of the surface wave wavelength
C
R = phase velocity of surface wave
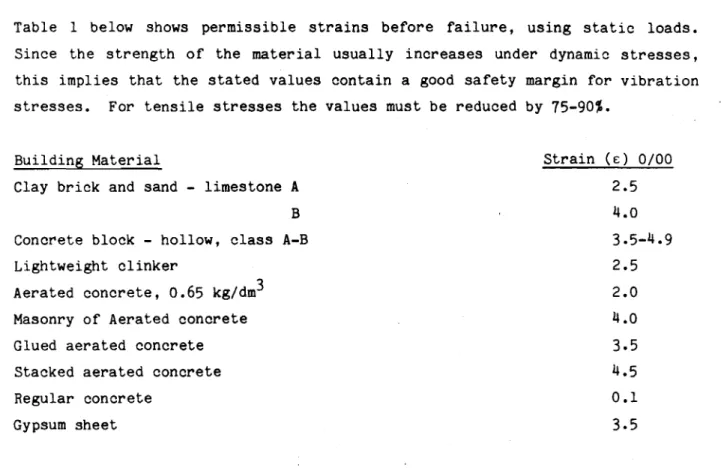
3.1.4 p・セュゥウウゥ「Q・ sエセ。ゥョウ ヲッセ カ。セゥッオウ Building m。エ・セゥ。Qウ and Examples of vゥ「セ。エゥッョ sエセ。ゥョウ
Table 1 below shows per-mi as i.bLe strains before failure, using static loads. Since the s tr-engt.h of the material usually increases under dynamic stresses, this implies that the stated values contain a good safety margin for vibration stresses. For tensile stresses the values must be reduced by 75-90%.
Building Material
Clay brick and sand - limestone A
B
Concrete block - hollow, class A-B Lightweight clinker
Aerated concrete, 0.65 kg/dm3 Masonry of Aerated concrete Glued aerated concrete Stacked aerated concrete Regular concrete Gypsum sheet Strain (£) 0/00 2.5 4.0 3.5-4.9 2.5 2.0 4.0 3.5 4.5 0.1 3.5
Table 1. Permissible compressive strains for various building materials.
Some examples of the strains which may develop in various building materials with different soil- and wave types are shown in table 2 below. The height of
the building structure is assumed to be four metres •
• !lV indicates that the vibration level must be measured relative to the direction of wave propagation in the structure.
20
-Table 2. Shear in building materials for various foundation soils and vibration levels.
Ground/ Wave type Vibration Shear strain Structure P
ground/ level (0/00/ radians)
S (mm/s) structure (m/s) PM =Ps =4500 70 V/HV* 0,016 Rock concrete SM =Ps =3000 70 V/HV 0,023 Rock/ ligh t- PM =4500 30 H 0,007 weight concrete Ps セ 2000 30 HV 0,015 Ss =1500 30 HV 0,020 Moraine/ pイセ = Ps =4500 50 H/HV 0,011 concrete R M
=
1500 50 V/H20 HZ 0,045 Clay/concrete PM=
Ps=
4500 20 H/HV 0,004 RM=
400 20 V/H 10 HZ 0,082 Clay/light- PM =4500 10 H 0,002 weight concrete Ps=
2000 10 HV 0,005 RM=
400 10 V/H 10 HZ 0,041The stated wave propagation velocities are very approximate, and there are in fact large variations. Especially the R-wave may have a very low propagation velocity which has been found to be lower than 50 m/s in some instances.
3.2 Comparison between Theoretical and Practical Applied Limits
The load figures in the preceding table agree well with the actual limit values for permissible vibration stresses. In practical risk assessments a more detailed classification of the foundation soil types, structural materials etc. is used however, and age - as well as the condition of the building - are considered. Unfortunately it was found difficult to obtain information on the shear- or tensile stresses tolerated by various bUilding
materials. The calculated shear stresses for various loads therefore lack test results for comparable materials. The tests deal generally with the compressive strength of the material, and in the case of concrete, also with the fracture limit for flexural tensile stress. Usually it can, however, be assumed that the tensile strength is 10-15% of the compressive strength. In dynamic processes it is not unlikely that a greater strain can be tolerated than in a static process. Table 2 shows that the given examples of loads produce strains which are 10 - 20 times lower than the tolerance of the material under static loading. Concrete is an exception; i t has properties close to the 1imit , Concrete is, however, always reinforced so that it can absorb tensile stresses. As a result of the reinforcing the strain is uniformly distributed and permissible values are as provided. In projects
(12) and (l3), where blasting was continued until the building started to
crack, very high values were recorded before the aerated concrete cracked. The vibration level was then approximately 350 rom/so With a propagation velocity of the P-wave in aerated concrete of approximately 2,000 m/s the following result is obtained:
(3.13)
This has a strain limit of 0.4 0/00 in tension.
Age and possible accumulated stresses may explain the difference. Brick-constructed basement apartments are one of the main uses for aerated concrete. Backfilling against the wall is arranged after completion, and an earth pressure develops against the wall. This produces tensile stresses which are so large that tension cracks are often initiated on the inside of the wall. This has been partly corrected by reinforcing the joints. Nevertheless it may happen that only small additional stresses are needed to increase the total tensile stress to a level where cracks develop.
22
-3.4. Accuracy of the Pre-event Inspection
3.3. Relationship between the Number of Additional Entries in Post-Event Inspections and the Level of Vibration Measurements
2 20 3 2 4 3
Missed instances of damage, in percent
1-2 3-5 6-10 10-15
2
0-0.3 Number of consultations who provided above instances
The mean value is approximately
7%.
It was shown in the preceding section that it is very difficult to determine theoretically a useful value for maximum permissible vibration velocities. The existence of accumulated stresses implies that there is always a potential risk of new cracks when the vibration stresses are larger than those that occur in normal use; to this the climatological factors must be added. The limits, which are used, must therefore always be a compromise where a certain risk is accepted that new cracks may develop. One way to estimate this risk is to attempt to outline a statistical relationship between the number of additional entries and the measured vibration level on the respective site, and by analyzing inspections and vibration measurements.- This examination has been made possible thanks to Nitro Consult's inspection procedure where a form is completed for each inspected site, containing soil type, foundation etc. There are, however, two primary sources of errors. To start with, it is almost impossible to pick up every crack in a pre-event inspection, and secondly some damage is always added in the course of time as a result of the "ageing" of the building.
Table_3. Estimate of missed damage in percent.
The pubLtcat.i.on "Appraisal - Crack Inspection of Buildings" (14) contains records of an inquiry dealing with attempts to estimate the proportion of existing damage which was missed in the pre-event inspection.
In post-event inspections, the pre-event inspection records are used as a reference; thus there are never fewer number of cracks in a post-event inspection record. It is therefore very likely that there will be a number of additional entries in the post-event inspection records without an increase in the number of incidents of damage.
3.5.
Ageing of the BuildingWi th a view to investigating to what extent the number of cracks increases with time, the inspection records of two apartment blocks were examined; these had been inspected three times on various occasions since their construction in 1965. Their designs were identical, and they had similar foundations.
Fig. 3.3 shows that there is a continuous increase in the instances of damage. In the case of the premises marked (0) this happens very uniformly while the rate of increase in the number of cracks is more irregular for the other property (x ) , The mean increase in the number of cracks is, however, very similar and amounts to 12-13 instances per year.
It must, however, be emphasized that these figures apply only to this particular case, and that it is very likely that other buildings age quite differently and at a different rate. It is quite obvious that, generally speaking, changes occur with time.
NUMBER OF INCIDENTS OF DAMAGE 200
•
x 100•
x APARTMENT BLOCK 1 0 APARTMENT BLOCK 2•
•
1965 '70 -75 -80 TIMEFig.
3.3.
Relationship between ageing of premises and the number of instances of damage.24
-3.6. Results of the Investigation
3.6.1. Detached Houses - Apartment Blocks
The majority of the examined properties are constructed on rock. Only a small number of detached houses are bui l,t on sand - clay. Figures
3.4
show thetotal number of newly detected instances of damage in apartment blocks constructed on rock and in detached houses built on rock and clay, respectively. It is seen that there is a considerable scatter of the values but in the case of the detached houses built on clay it is noted that there are no additional entries where the vibration level was below 10 mm/s. The total number of properties is, however, on the low side to permit reliable conclusions.
There appears to be a clear trend in the case of detached houses and apartment blocks that the number of additional entries increases with the level of vibrations. In both categories there is a large proportion of properties with 0-1 additional entries where the levels of vibration are under 20 rom/Sa Most properties show additional entries at higher levels of vibration.
3.6.2. Various Construction Materials
In the case of properties built on rock the significance of the construction material was also examined. Figures
3.5
show results for structures of wood, lightweight concrete, and regular concrete, respectively. Surprisingly, it appears that lightweight concrete is associated with the lowest number of additional entries for vibration levels below 100 mm/s while wooden structures seem to involve a risk of additional entries above 5-10 mm/s.3.6.3.
Various Types of FacadesVarious types of facades were also examined without taking into account foundations. Three different cladding materials were reported in fig. 3.6, i.e. plaster, sand-limestone and brick. In most instances there were no additional entries reported for cladding materials.
The analysis shows that the greatest number of newly detected instances of damage occurs in the wall-covering material inside the premises and not in the facades.
NUMBER OF ADDITIONAL ENTRIES 20
•
15•
a. Apartment block on rock 10•
• • ••
• • 5 ••
• •
•• •
...
セN 1 10 100 mm/sNUMBER OF ADDITIONAL ENTRIES
2
• •
•
• ••
•
•
•
5.
セ•
•
•
••
1 10 100 mm/sNUMBER OF ADDITIONAL ENTRIES
セN
__
N⦅MセMセMMMMM ....b. Detached houses on rock
5
c. Detached houses on clay •
•
•
•
1 10 100 mm/s
Figures 3.4 a,b,c. Relationship between newly detected damage in post-event inspections and the measured levels of vibration.
Fig. 3.5. a,b,c. Relationship between newly detected damage in post-event inspections and the measured levels of vibration.
:.. 26
-NUMBER OF ADDITIONAL ENTRIES
a. Rock - wood
b. Rock - lightweight concrete
c. Rock - regular concrete
•
•
•
t •e.
•
•
••
•
1 10 100 mm/. 20•
15•
10•
•
•
•
5••
•
•
•
._1. •• 1 10 100 mm/.NUMBER OF ADDITIONAL ENTRIES
2(} 15-
•
•
1(}•
•
5•
•
•
••
•
-1 10 100 mm/. 5 15 1(}c. Brick facade b. Limestone facade a. Plaster facade 100 mm/I 100 mm/8 100 mm/I
•
10 10 10 -1 1 1 5 5•
•
15 10 5 20NUMBER OF ADDITIONAL ENTRIES NUMBER OF ADDITIONAL ENTRIES NUMBER OF ADDITIONAL ENTRIES
Fig.
3.6.
a,b,c. Relationship between the number of newly detected instances of damage at post-event inspections and measured levels of vibration.28 -100
so
b. Vibration level (mm/s)o
1030
20
1.0[L
20
NUMBER OF PREMISES / FREQUENCY INTERVALS
Itlhrlk
o
5 10a. Number of newly detected incidents of damage
20
10
30
{,o
Fig. 3.7. Histograms showing the distribution of the number of properties which received a certain number of additional entries at post-event inspections and the distribution of measured vibration levels.
There is a lack of extreme values, both as far as the highest number of entries and measured vibration levels are concerned. A total of 91 properties were examined.
3.7. Statistical Analysis
With a view to establishing whether it is common that certain vibration levels and a certain number of additional entries are obtained on adjacent properties, the two histograms shown below were prepared - see fig. 3.7.
The figure shows that for over half of the post-event inspected properties at most one instance of newly detected damage was reported. Approximately the same proportion of properties were exposed to vibration levels lower than 20 rom/so From the point of view of this project i t would have been better i f the examined properties had been distributed more evenly between the frequency intervals, i.e. if the results of the investigation had produced (histogram) blocks of an equal magnitude.
Fig.
3.1
shows that during the time period that had elapsed between a pre-event and a post-event inspection - when work on the ground is in progress - approximately one instance of newly detected damage was recorded on the average. Fig.3.3
shows that for two properties which were investigated over a fairly long time, the number of newly detected instances of damage is 12-13 per annum. It is thus evident that a post-event inspection ususally results in a number of neWly detected instances of damage which are most often associated with external disturbances and not with the ageing of the property that would have been expected (verbatim: which should have been the case).4. discussioセ
It was somewhat unexpected that there is so little difference between various building materials in the structure and also between detached houses and apartment blocks. All properties were therefore included in one combined comparison in fig. 4.1. Some properties were added which had not been reported earlier because of incomplete information concerning foundation and construction. Two lines have been drawn into the figure: The left one indicates the greatest number of additional entries which may be expected on a property when i t is exposed to a certain vibration leveL The right line shows the lowest number of entries which may be expected for a given vibration level.
The material under investigation has been insufficient to obtain absolute limits. The results give, however, a good indication that it is likely that damage must be expected with vibration disturbances.
30
-Siskind (7) carried out a similar analysis in an American investigation. Because of more comprehensive material it was possible to determine the relationship between the likelihood of damage arid vibration velocity more accurately - see fig. 4.2. Similar work was carried out by Medearis (4) who likewise compared vibration velocity with the response spectrum of the vibration in an analysis of the most suitable criteria. His results agree well with Siskind's (7).
From an economic point of view a balance must always be found between the costs associated with keeping below a certain maximum vibration level on the one hand
&
the expenses which must be expected for repairs of future damage on the other hand. A limiting value must therefore be determined which ensures that a reasonable distribution between these costs is obtained.The authors extend their thanks to Goran Lande, Nitro Consult AB, for valuable opinions and a critical scrutiny of the manuscript, as well as to Burnis Lidmark for transcribing the manuscript.
NUMBER OF ADDITIONAL ENTRIES
•
20•
18 16•
14 12•
10•
8•
6•
•
•
It•
4•
•
•
•
•
2•
•
..
"
..,.
1 10 100 mm/.Fig. 4.1. Relationship between the number of additional instances of damage at post-event inspections and the measured vibration level.
32
-• Cosmetic damage II Minor damage • Maj or damage 99 95 90 Q) 80 eo Cll セ 70 "0 セ 60 0 >. 50 +J •..l rl 40 '.-i ..0 Cll 30 ..0 0 I-l Po< 20 10 5•
•
GMMMMMGセMMMヲMMMlNiNNNNlNiNNjNセMK⦅ 10 1 - I I 1 I I 1 ' 1 . --J-tJ..Ld_-_-L--L
.LI-L-L....L1J-IJ,L....I
セ 100 1000Maximum vibration velocity in mm/s
33
-References
1) Lundborg, N., Holmberg, R. and Persson, P.A. "The dependence of soil
vibrations on distance and charge". BFR Report R 11:1978.
2) Rundqvist, G. "An analysis dealing with the generation of vibrations
near the town of Vambs by blasting with varying hole diameters and
charging methods in the northern quarry at Cementa AB, Skovde"; Nitro
Consult Report ATG 8019, Stockholm, 1980.
3) Bottcher, G., Ludeling, R. and Wurtenhagen, K. "Noise protection in
blasting vibrations". Hobelhefte 45 Heft 2, 1979.
4) Medearis, K. "The Development of Rational Damage Criteria for Low-Rise
Structures SUbjected to Blasting Vibrations". Report, National Crushed
Stone Association, Washington, 1976.
5) Spencer, S., Lucole, P.E. and Dowding, C.H. "Statistical Analysis of
Blast Emission Records from Quarrying, Mining and Construction Operations
in the State of Illinois". Report from the Illinois' Institute of Natural
Resources, 1979.
6) Rundqvist, G. "Damage Criteria". Nitro Consult Report, partial report
from SveDeFo's project "Soil Vibrations and Damage Criteria", 1980.
7) Siskind, D.E., Stagg, M.S. and Stachura, V.J. "Safe Ground Vibration and
Airblast Criteria". 51st Annual Meeting, Eastern Section, Seismological
Society of America, 1979.
8) Langefors, U., Westerberg, H. and Kihlstrom, B. "Damage effect due to
soil vibrations in blasting operations". Technical Communication,
Nitroglycerin AB, Gyttorp. 1964.
9) Holmberg, R. Abstract dealing with a number of soil vibration
measurements. SveDeFo Report DS 1977:9, Stockholm, 1977.
10) Lundborg, N. "Measurement of soil vibrations in Eolshall". SveDeFo
Report DS 1977:1. Stockholm, 1977.
12) Bogdanoff, J., Larsson, T. and Nilsson, R. "Lightweight concrete houses
exposed to blasting vibrations". BFR Report R 42:1975.
13) Bergling, J.D., Eklund, K. and Sjoberg, C. "Concrete - lightweight
concrete houses exposed to blasting operations". BFR Report R 32:1977.
14) Stridh, S. "Appraisal examination of cracks in buildings
a
34
-15) Wilhelmsen, A.M. and Larsson, B. "Sonic booms and building damage". BFR
Report R 43:1972. Snodgrass, Blasting" • Wiss, J. Mining" • 16 ) 17)
J.J. and Siskind, D.E. "Vibration from
US Bureau of Mines. RI 7937, 1974.
"Control of Vibration and Blast Noise from
US Bureau of Mines - Contract No J0255022, 1978.
Underground
Surface Coal
Editor's Note: The term "vibration velocity" corresponds also to "particle