HAL Id: cea-02529379
https://hal-cea.archives-ouvertes.fr/cea-02529379
Submitted on 2 Apr 2020
HAL is a multi-disciplinary open access
archive for the deposit and dissemination of
sci-entific research documents, whether they are
pub-lished or not. The documents may come from
teaching and research institutions in France or
abroad, or from public or private research centers.
L’archive ouverte pluridisciplinaire HAL, est
destinée au dépôt et à la diffusion de documents
scientifiques de niveau recherche, publiés ou non,
émanant des établissements d’enseignement et de
recherche français ou étrangers, des laboratoires
publics ou privés.
Gram-type Differentiation of Bacteria with 2D Hollow
Photonic Crystal Cavities
R. Therisod, M. Tardif, P. Marcoux, E. Picard, J.-B. Jager, E. Hadji, D.
Peyrade, R. Houdré
To cite this version:
R. Therisod, M. Tardif, P. Marcoux, E. Picard, J.-B. Jager, et al.. Gram-type Differentiation of
Bacteria with 2D Hollow Photonic Crystal Cavities. Applied Physics Letters, American Institute of
Physics, 2018, 113 (11), pp.111101. �10.1063/1.5037849�. �cea-02529379�
Gram-type Differentiation of Bacteria with 2D Hollow
Photonic Crystal Cavities
R. Therisod1, M. Tardif2,3, P. R. Marcoux4, E. Picard3, J.-B. Jager3, E. Hadji3, D. Peyrade2 and R. Houdré1
1École Polytechnique Fédérale de Lausanne (EPFL), Institut de Physique, Station 3, CH-1015 Lausanne, Switzerland 2 University Grenoble Alpes CNRS,LTM – Micro and Nanotechnologies for Health, 38054 Grenoble Cedex 9, France
3University Grenoble Alpes, CEA, INAC, PHELIQS, Laboratoire SINAPS, F-‐38000 Grenoble Cedex 9, France 4University Grenoble Alpes, CEA, LETI, Minatec-‐Campus, 17 Avenue des Martyrs, 38054 Grenoble Cedex 9, France
e-mail address: rita.therisod@epfl.ch
Abstract:
Fast and label-‐free techniques to analyze viruses and bacteria are of crucial interest in biological and bio-‐medical applications. For this purpose, optofluidic systems based on the integration of photonic structures with microfluidic layers were shown to be promising tools for biological analysis, thanks to their small footprint and to their ability to manipulate objects using low powers. In this letter, we report on the optical trapping of living bacteria in a 2D Silicon hollow photonic crystal cavity. This structure allows for the Gram-‐type differentiation of bacteria at the single cell scale, in a fast, label-‐free and non-‐destructive way.
During the last decade, optical resonators integrated with microfluidic layers arose as suitable structures for biological analysis1, thanks to their small footprint and especially thanks to their ability to trap objects with low
powers2-‐5, beneath the damage threshold of biological entities. The trapping of biomolecules6-‐8, viruses9 and
bacteria10,11 was reported. Moreover, the resonant nature of the optical cavities enables for the simultaneous
acquisition of information on the trapped object such as size, refractive index and morphology, thanks to a feedback effect induced by the trapped specimen on the trapping field itself11-‐17. In parallel, the massive and
inappropriate use of antibiotics since the 1950s has led to antimicrobial resistance18. Because of multidrug
resistant pathogens, in a near future, common infections and minor injuries could kill once again. This misuse of antibiotherapy is partly due to long, compelling and / or expensive diagnostic tools based on the analysis of a large number of bacteria (typically 106 to 108). The initial step in this diagnostic consists in determining the
bacterium responsible for the infection and the rapidity in its identification is of crucial importance. Currently, the first test performed in hospital environment is the Gram staining procedure of the specimen under study, so as to yield a very first characterization of the pathogen to be identified. This differential staining allows for the classification of bacteria in two groups, Gram-‐positive and Gram-‐negative, depending on the chemical and physical properties of the cell wall19,20. Gram staining method is widely used21 but it is a restrictive and
destructive technique that requires carcinogen dyes 22 and a large number of bacteria23. Other Gram-‐type
identification techniques were suggested, based on KOH for marine bacteria24, on pyrolisis-‐mass spectrometry25
or on the reaction between polymyxin B and lipolysaccharides26. Gram negative bacteria were also identified
through a functionalized porous silicon microcavity detecting lipolysaccharides27. Here we propose a method
based on resonant trapping in a 2D hollow photonic crystal (PhC) cavity. With this structure, we implemented a fast, label-‐free and nondestructive technique to distinguish the Gram-‐type of bacteria at the single-‐cell level.
The photonic crystal structures are fabricated on Silicon-‐On-‐Insulator substrates with conventional electron beam lithography techniques and inductively coupled plasma etching12,28,29. The silica sacrificial layer is then
removed via wet etching. The PhC cavity is designed to have a resonant frequency around 1550 nm and is evanescently excited via a W1 waveguide in an end-‐fire setup. The lattice holes measure 250 nm in diameter and they are hexagonally arranged with a lattice constant of 420 nm; the defect hole is 700 nm in diameter. More details on the photonic crystal cavity can be found in Ref. [12]. The entire set of measurements was performed on the same optical cavity, featuring a Q factor of 4500 in water.
To enable the transport of bacteria in the vicinity of the PhC structures, a polydimethylsiloxane (PDMS) frame (100 µm in thickness) is placed on the sample, and it acts as a container for a drop of the bacteria suspension in deionized water. A glass coverslip, 170 µm thick, is then attached to avoid evaporation.
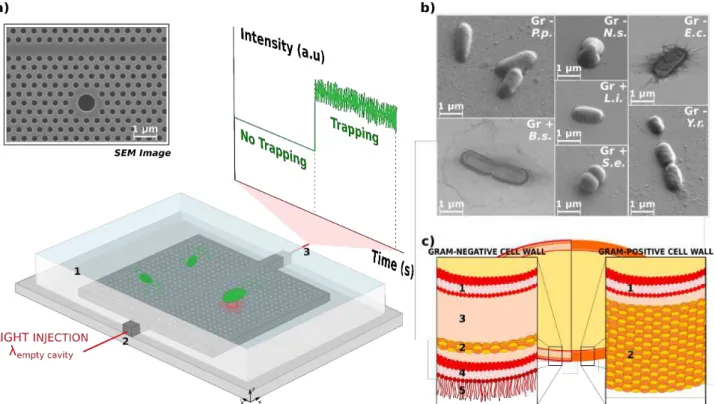
Light from a tunable laser is injected with a polarization maintaining lensed fiber, and the transmitted power through the waveguide is collected with a microscope objective and detected by a photodiode. A visible camera placed on the top of the sample allows for imaging and visual checking of the trapping events. The device and the optical structure we developed are shown in Fig. 1a.
The bacteria that were investigated are shown in Fig. 1b : Escherichia coli (ATCC 11775), Yersinia ruckeri (ATCC 29473), Pseudomonas putida (ATCC 31483), Neisseria sicca (ATCC 29193), Staphylococcus epidermidis (ATCC 12228), Bacillus subtilis (ATCC 11774) and Listeria innocua (ATCC 33090). These strains were chosen as they are all classified as nonpathogenic (biosafety level 1), but are biologically close to pathogen species of importance in clinical field. For example, L. innocua and Y. ruckeri are close to L. monocytogenes and Y.
enterocolitica respectively. Bacteria strains were obtained from KwikStik lyophilized reference strains
(Microbiologics, St. Cloud, MN). They are grown on an agar medium (COS or TSA, bioMérieux). After 24 hours of incubation (37°C), a suspension of 3 McF (Densimat, BioMerieux) is prepared in an API Suspension medium (bioMerieux). This corresponds to a bacterial concentration of 2.109 cfu/mL for the Gram-‐negative rods such as E. coli or P. putida. The different types of bacteria were selected so that every of the four main pathogen
categories (Gram-‐positive cocci, Gram-‐positive bacilli, Gram-‐negative cocci, Gram-‐negative bacilli) included at least one strain. E. coli, Y. ruckeri and P. putida are Gram-‐negative bacilli, whereas N. sicca is a Gram-‐negative coccus. S. epidermidis is a Gram-‐positive coccus, whereas B. subtilis and L. innocua are Gram positive bacilli.
Fig. 1 (a) SEM image of the 2D hollow photonic crystal cavity and experimental setup. The photonic crystal structures are immersed in water (1) thanks to a PDMS frame that allows for the Brownian motion of bacteria in the proximity of the optical cavity. Light from a tunable laser is injected at the resonance wavelength into the access waveguide (2) in an end-‐fire setup. The transmitted light is collected from the other facet of the sample (3) via a microscope objective and its intensity is monitored with an oscilloscope. (b) SEM pictures of the seven bacteria under study. P.p. stands for Pseudomonas putida, N.s. for Neisseria sicca, E.c. for Escherichia coli, Y.r. for Yersinia ruckeri, B.s. for Bacillus
subtilis, L.i. for Listeria innocua and S.e. for Staphylococcus epidermidis. The Gram-‐type of these bacteria is also indicated: Gr – for Gram-‐ negative and Gr + for Gram-‐positive bacteria. (c) Depiction of the structural differences in the cell wall for Gram-‐negative and Gram-‐positive bacteria. Gram – bacteria show two membranes (plasma 1 and outer 4) separated by a liquid periplasmic space (3) and by a thin (5-‐10nm) peptidoglycan layer (2). Moreover, lipopolysaccharides (LPSs, 5) projects from the outer membrane. On the contrary, Gram + bacteria exhibit a less complex structure, with a single membrane (plasma 1), surrounded by a thick cell envelope (20-‐80 nm) made of a peptidoglycan layer (2) and no LPSs.
The differences in the cell wall composition outlined by the differential Gram staining are shown in Fig. 1c: Gram-‐positive bacteria show a plasma membrane surrounded by a thick (20-‐80 nm) peptidoglycan layer, while Gram-‐negative ones exhibit two membranes separated by a periplasmic space (30-‐70 nm thick) containing a thinner (5-‐10 nm) peptidoglycan layer. Moreover, Gram – cell wall presents large molecules, the lipopolysaccharides (LPSs), that projects from the outer membrane. Regarding the morphology, N. sicca and S. epidermidis are classified as cocci: they have an oval shape and they aggregate in diplococci resulting in a size from 0.5 x 1 µm to 1 x 2 µm. The other bacteria under analysis are classified as bacilli and they are rod-‐shaped with different sizes ranging from 1 x 2 µm to 1 x 3 µm.
For every type of bacteria, a drop of suspension is inserted in the PDMS frame, allowing for the bacteria to move in Brownian motion and eventually to be trapped, while passing in the vicinity of the excited resonant
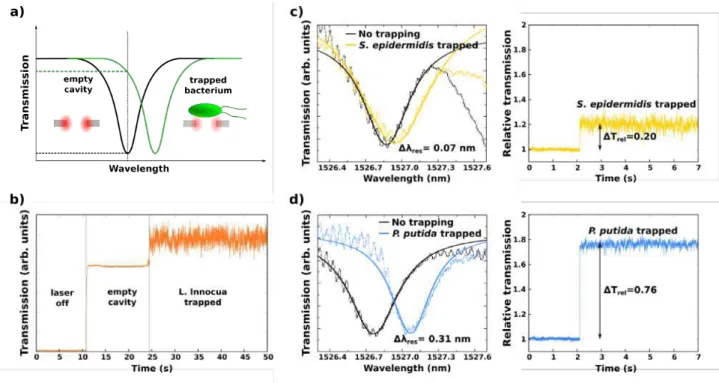
cavity. Infrared light at the resonance frequency is injected into the input waveguide and the evanescent coupling between the W1 waveguide and the optical cavity allows for the excitation of the electromagnetic mode supported by the cavity itself. This results in a maximum of the field confined in the resonant cavity and consequently in a minimum of the detected power through the waveguide. When a bacterium is trapped, a variation of the refractive index overlapping with the confined field occurs and this leads to a redshift in the resonance wavelength (Fig. 2a). If the tunable source is kept at the initial wavelength, an enhancement in the transmission is observed (Fig. 2b), that is correlated to the resonance shift and can hence be used to acquire information on the trapped specimen.
Fig. 2 (a) Representation of the redshift induced in the resonance frequency by a trapped bacterium. (b) Transmission recorded for L. innocua. (c) Minimum shift observed for S. epidermidis and minimum relative transmission augmentation. (d) Maximum shift observed for P. Putida and maximum relative transmission enhancement.
Bacteria are stably trapped over minutes, but a few seconds are sufficient to obtain information. After recording the transmission signal for five seconds, the excitation laser is thus turned off. The bacteria are then free to move by Brownian motion and to step away from the cavity region, while other ones will move in its proximity. The laser is turned on again and a new transmission record is performed. For every type of bacteria, this procedure was repeated ten times to obtain a statistical representation of the response of the bacterial population.
Additionally, for S. epidermidis (Gram +) and for P. putida (Gram -‐) five measurements were performed to determine the resonance shift corresponding to the transmission increase. A second tunable laser was used as a probe in the following way: the two sources were injected in the waveguide via a 1.55 μm 50/50 fiber-‐optic coupler30. The first source was kept at the empty cavity resonance wavelength and it was responsible for the
trapping of bacteria. The second one, inversely, was used to measure the transmission spectrum in the presence of trapped specimen. The comparison between the spectra obtained in the two cases (empty cavity/trapped bacteria) permits the determination of the induced resonance shift. The mean resonance shift found for S.
epidermidis is 0.12 nm, while for P. putida it is 0.28 nm. In Fig. 2c are depicted the minimum shift observed for S. epidermidis (0.07 nm) and the minimum relative transmission augmentation observed (0.20 in average). In Fig.
2d the maximum shift for P. putida (0.31 nm) and the maximum relative transmission enhancement (0.76 in
average) are plotted.
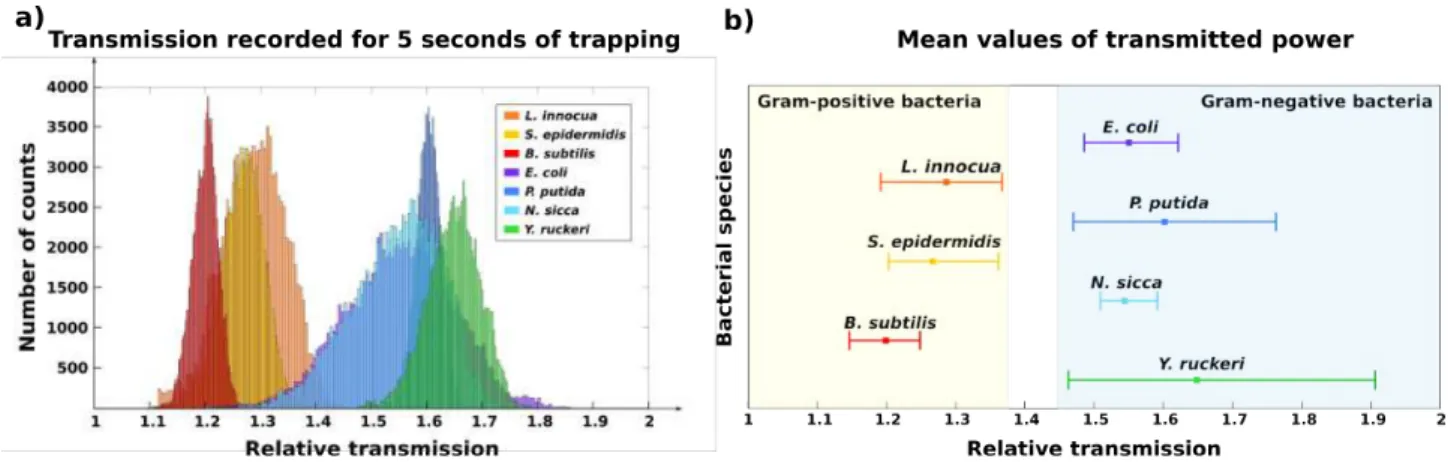
The analysis of the transmitted power measured for the seven different bacteria is completed through the calculation of the histogram functions of the transmitted signals. The histograms are calculated for ten trapping events for every bacterial species and normalized to the relative transmission with respect to the empty cavity one for better comparison. A mean histogram is deduced for each bacteria type and is shown in Fig 3a.
Fig. 3 (a) Histogram functions of the average relative transmission enhancement over 10 measurements for seven types of bacteria. (b) Mean values of the transmitted power over 10 measurements. Bars indicate the minimum and maximum mean transmission value obtained for each bacterial species.
The results show differences in the FWHM and in the mean value of the histograms: in particular, Gram-‐negative bacteria (E. coli, P. putida, N. sicca and Y. ruckeri) exhibit a larger transmission enhancement with respect to Gram-‐negative ones (L. innocua, S. epidermidis and B. subtilis). In Fig. 3b, the average values of the relative transmission augmentation (corresponding to the peak value of the average histogram functions) are plotted for the seven types of bacteria. These results are based on the analysis of ten measurements (five seconds long) for each bacteria species. The variability in the transmission increase is indicated by bars showing the minimum and maximum average transmission value obtained for each type of bacteria, not to be confused with the FWHM of the average histograms. Gram-‐positive bacteria present a relative transmission comprised between 1.15 and 1.37, while for Gram-‐negative ones it is comprised between 1.47 and 1.91. A demarcation value appears to be around a relative transmission of 1.40. These transmission ranges are correlated to the resonance wavelength shift of the cavity in the presence of the bacterium, (Fig. 2). Indeed, we observed that the shift induced by the trapping of a Gram-‐positive bacterium (S. epidermidis, 0.12 nm) is under 50% of the one caused by the trapping of a Gram-‐negative bacterium (P. putida, 0.28 nm). It was previously shown that the resonance shift depends on the refractive index of the trapped specimen and on the overlap with the cavity mode volume12,30. On this
structure, the structural differences in the cell wall that differentiate Gram-‐positive and Gram-‐negative bacteria (Fig. 1c) are responsible for the differences observed in the transmission enhancement. In particular, the larger shift induced by Gram-‐negative bacteria agrees with the greater deformability of the cell wall31, resulting in a
larger overlap with the confined field and hence in a stronger feedback effect. The LPS (lipopolysaccharides) might also be an explanation for the observed differences. These large and complex molecules indeed project from the surface of the outer membrane (4 in Fig. 1c) of Gram-‐negative bacteria but are absent from the cell envelope (2 in Fig. 1c) of Gram-‐positive bacteria.
Furthermore, information on some trapped bacteria can be obtained by combining the relative transmission range with the FWHM of the histogram functions. For instance, it is possible to distinguish B. subtilis in Gram-‐ positive group and N. sicca in Gram-‐negative one, due to the fact that their FWHM is lower than the one of their Gram-‐type homologue (Fig. 3a). Differences in FWHM are in agreement with previous results on bacteria identification using a SOI 1D microcavity11. The FWHM is linked to the stability of the trapped specimen in the
trap and future work will be performed to provide information on the mobility of the bacteria, such as the presence or absence of flagella.
In conclusion, we report on the optical trapping in a 2D Silicon hollow photonic crystal cavity as a nondestructive characterization method on single cells. This technique is illustrated here on seven species of living bacteria, featuring different morphologies, motilities (presence or absence or flagella) and Gram staining properties. We showed that Gram-‐type could unambiguously be determined on this set of species, in a fast and label-‐free way. The system can be integrated into a lab-‐on-‐a-‐chip platform for fast discrimination of Gram-‐type, allowing for the possibility to use the same cells for further analyses. This possibility is currently prevented because of the destructive nature of the Gram staining procedure. Moreover, it is conceivable to extend this method to Gram-‐ variable and Gram-‐indeterminate bacteria. The small amount of suspension required, together with the rapidity of a simple transmission measurement, make this technique a promising tool for fast, label-‐free and non-‐ destructive identification of bacterial species at the single-‐cell scale.
Acknowledgments
References
1 X. Fan and I.M. White, Nat. Photonics 5, 591 (2011).
2 N. Descharmes, U.P. Dharanipathy, Z. Diao, M. Tonin, and R. Houdré, Phys. Rev. Lett. 110, 1 (2013). 3 M. Tonin, F.M. Mor, L. Forró, S. Jeney, and R. Houdré, Appl. Phys. Lett. 109, (2016).
4 S. Lin, E. Schonbrun, and K. Crozier, Nano Lett. 10, 2408 (2010).
5 M.L. Juan, R. Gordon, Y. Pang, F. Eftekhari, and R. Quidant, Nat. Phys. 5, 915 (2009). 6 S. Mandal, J.M. Goddard, and D. Erickson, Lab Chip 9, 2924 (2009).
7 M.R. Lee and P.M. Fauchet, Opt. Express 15, 4530 (2007).
8 H. Zhu, I.M. White, J.D. Suter, P.S. Dale, and X. Fan, Opt. Express 15, 9139 (2007). 9 P. Kang, P. Schein, X. Serey, D. O’Dell, and D. Erickson, Sci. Rep. 5, 1 (2015). 10 T. van Leest and J. Caro, Lab Chip 13, 4358 (2013).
11 M. Tardif, J.B. Jager, P.R. Marcoux, K. Uchiyamada, E. Picard, E. Hadji, and D. Peyrade, Appl. Phys. Lett. 109, (2016). 12 N. Descharmes, U.P. Dharanipathy, Z. Diao, M. Tonin, and R. Houdré, Lab Chip 13, 3268 (2013).
13 C.F. Carlborg, K.B. Gylfason, A. Kaźmierczak, F. Dortu, M.J. Bañuls Polo, A. Maquieira Catala, G.M. Kresbach, H. Sohlström, T. Moh, L. Vivien, J.
Popplewell, G. Ronan, C.A. Barrios, G. Stemme, and W. van der Wijngaart, Lab Chip 10, 281 (2010).
14 M.G. Scullion, A. Di Falco, and T.F. Krauss, Biosens. Bioelectron. 27, 101 (2011).
15 O. Levi, M.M. Lee, J. Zhang, V. Lousse, S.R.J. Brueck, S. Fan, and J.S. Harris, 64470P (2007). 16 A.F. Koenderink, M. Kafesaki, B.C. Buchler, and V. Sandoghdar, Phys. Rev. Lett. 95, 1 (2005). 17 L. Neumeier, R. Quidant, and D.E. Chang, New J. Phys. 17, (2015).
18 C.L. Ventola, P T A Peer-‐Reviewed J. Formul. Manag. 40, 277 (2015).
19 T. Silhavy, D. Kahne, and S. Walker, Cold Spring Harb. Perspect. Biol. 2, 1 (2010).
20 J. Willey, L. Sherwood, and C.J. Woolverton, Prescott’, Harley & Klein’s Microbiology, Seventh ed (Mc Graw Hill, 2008). 21 T.J. Beveridge, Biotech. Histochem. 76, 111 (2001).
22 S. Mani and R.N. Bharagava, in Rev. Environ. Contam. Toxicol. Vol. 237, edited by W.P. de Voogt (Springer International Publishing, Cham, 2016),
pp. 71–104.
23 P.R. Murray and E.J. Baron, Manual of Clinical Microbiology (ASM Press, Washington, D.C., 2007). 24 J.D. Buck, Appl. Environ. Microbiol. 44, 992 (1982).
25 F. Basile, K.J. Voorhees, and T.L. Hadfield, Appl. Environ. Microbiol. 61, 1534 (1995). 26 J. Wiegel and L. Quandt, J. Gen. Microbiol. 128, 2261 (1982).
27 S. Chan, S.R. Horner, P.M. Fauchet, and B.L. Miller, J. Am. Chem. Soc. 123, 11797 (2001). 28 M. Loncar, T. Doll, J. Vuckovic, and A. Scherer, J. Light. Technol. 18, 1402 (2000).
29 D. Peyrade, Y. Chen, A. Talneau, M. Patrini, M. Galli, F. Marabelli, M. Agio, L.C. Andreani, E. Silberstein, and P. Lalanne, Microelectron. Eng. 61–62,
529 (2002).
30 M. Tardif, E. Picard, P.R. Marcoux, V. Gaude, J.B. Jager, E. Hadji, and D. Peyrade, Under Submiss. (n.d.). 31 V. Vadillo-‐Rodriguez, S.R. Schooling, and J.R. Dutcher, J. Bacteriol. 191, 5518 (2009).