HAL Id: hal-02437767
https://hal-amu.archives-ouvertes.fr/hal-02437767
Submitted on 13 Jan 2020
HAL is a multi-disciplinary open access
archive for the deposit and dissemination of
sci-entific research documents, whether they are
pub-lished or not. The documents may come from
teaching and research institutions in France or
abroad, or from public or private research centers.
L’archive ouverte pluridisciplinaire HAL, est
destinée au dépôt et à la diffusion de documents
scientifiques de niveau recherche, publiés ou non,
émanant des établissements d’enseignement et de
recherche français ou étrangers, des laboratoires
publics ou privés.
Distributed under a Creative Commons Attribution - ShareAlike| 4.0 International
Development of Wavelet Based Tools for Event related
potentials’ N400 detection: Application to visual and
auditory vowelling and semantic priming in Arabic
language
Nadia Mountaj, El-Mehdi Hamzaoui, Mohamed Himmi, Mireille Besson
To cite this version:
Nadia Mountaj, El-Mehdi Hamzaoui, Mohamed Himmi, Mireille Besson. Development of Wavelet
Based Tools for Event related potentials’ N400 detection: Application to visual and auditory vowelling
and semantic priming in Arabic language. Advances in Science, Technology and Engineering Systems
Journal, Advances in Science Technology and Engineering Systems Journal (ASTESJ), 2019, 4 (4),
pp.414-420. �hal-02437767�
Development of Wavelet Based Tools for Event related potentials' N400 detection: Application to visual
and auditory vowelling and semantic priming in Arabic language
Nadia Mountaj1, El-Mehdi Hamzaoui2*, Mohamed Majid Himmi1, Mireille Besson3
1LIMIARF Laboratory, University Mohammed V, Faculty of Sciences, Rabat 10000, Morocco.
2National Centre for Nuclear Energy, Science and Technology (CNESTEN), Rabat 10001, Morocco.
3
Cognitive Neurosciences Laboratory, CNRS — Aix-Marseille University, Pôle 3C, Marseille 14000, France.
A R T I C L E I N F O A B S T R A C T
Article history:
Received : 08 December, 2017 Revised : 09 February 2017 Accepted : 12 February 2017
Neurological signals are generally very weak in amplitude and strongly noisy. As a result, one of the major challenges in neuroscience is to be able to eliminate noise and thus exploit the maximum amount of information contained in neurological signals (EEG, ERP, Evoked Potentials, ...). In our project, we aim to highlight the ERP's N400 wave which the behavior, the amplitude and the latency may reflect the effects of vowelling and semantic priming in Arabic language. For that reason, we consider a nonlinear filtering method based on discrete 10th order Daubechies discrete wavelet transform combined to principal component analysis, to improve the quality of the recorded ERP signals. Thus, among all tested wavelets, the Daubechies one allows a significant improvement of the signal to noise ratio while using only 10 ERP trials. In addition, we compare and illustrate the effectiveness of this method to that obtained using the averaging technique implemented on EEGLab toolbox. In a second step, the Mexican Hat function have been used to achieve continuous wavelet analysis of the filtered signals. This method permits us to get an alternative representation of the ERPs and to detect avec more accuracy the N400 wave. Keywords : Daubechies ERP signals N400 Wavelets Vowelling priming Semantic priming 1. Introduction
The event related potential (ERP) N400 wave is a negative deflection elicited by the brain as a reaction to semantically unexpected words in sentence contexts. Thus, for many languages, such as English, French, Mandarin Chinese, ..., it has been demonstrated that orthographic depth has measurable effects on the morphology, amplitude and time occurrence of this negative ERP component which reflects the interruption of ongoing sentence processing due to the existence of inappropriate words making it senseless [1,2]. In our project, we aim to determine whether semantic priming effects are found in the Arabic language.
Written Arabic could be characterized as shallow (i.e unvowelled words) or deep (i.e, vowelled words) depending on how its orthography reflect the phonology. Arabic written words
are composed from consonant and long vowels in addition to diacritic, the role of those diacritic is vowellisation of the written word, and enable the reader to infer the specific pronunciation. Arabic is characterized by a non-concatenative morphology whereby every surface form is analyzable into a consonantal root, that conveys semantic meaning, and a word pattern (made up of vowels and of a subset of consonants) conveying morphosyntactic and phonological information.
For that reason, we try to improve the quality of the ERP signals recorded while a semantic judgment task with Arabic words is accomplished. Indeed, as many neural signals, ERPs are very weak signals and strongly corrupted by noise. Many studies tackled the improvement of ERP signals using statistical methods [3,4], linear and nonlinear adaptive filtering [5], neural network based techniques [6] and wavelets denoisng techniques [7,8].
ASTESJ
ISSN: 2415-6698 Advances in Science, Technology and Engineering Systems Journal Vol. 2, No. 1, XX-YY (2017)N. Mountaj et al. / Special Issue on Advancement in Engineering and Computer Science Vol. 2, No. 1, XX-YY (2019)
In the present article, discrete wavelet is combined with principal component analysis were used as nonlinear filtering tool which allowed us to improve the signal to noise ratio and thereby to highlight the N400 wave. In addition, we used the Mexican hat function to achieve the time-scale analysis of the filtered ERPs in order to detect the N400 with more accuracy.
2. Material and methods 2.1. Experiment
In our experiment, which was approved by the Ethics Committee of the Mohammed V University, a total of 20 Master and PhD students (10 women), aged between 20 and 34 years old, were tested after giving their written consent to participate in the experiment. They were all right-handed and without neurological disorders. They all use Arabic daily.
Each participant was comfortably seated in a Faradized room and was asked to silently read two words that were successively presented at the center of a computer screen. Indeed, we have used as stimuli a total of 256 Arabic prime target word pairs. 128 pairs were presented in the vowelled condition and the others were presented in the unvowelled condition. For each condition, 64 pairs were semantically related and 64 pairs were semantically unrelated. For both vowelled and unvowelled pairs, two lists were constructed so that across lists, the same target word was paired once with a semantically related prime and once with a semantically unrelated prime [2]. The order of presentation of the two lists was balanced across participants.
EEG data was continuously recorded using 24 electrodes (impedance < 5kΩ) mounted on an elastic head cap according the 10/20 International EEG System [9]. The signals were amplified using SAI amplifiers (San Diego) and recorded at a sampling frequency of 250 Hz. The Electro-Occulogram (EOG) was recorded from an electrode placed under the right eye to detect eye blinks. Finally, two reference electrodes were placed on the left and right mastoids. The experiment was conducted in a Faraday’s cage in order to reduce external interference [10].
The analyzed ERP signals correspond to the electrodes F3, F4, C3, C4, P3, P4, Fz, Cz and Pz. Thus, several studies have shown that the N400 waveform is very ample on the centro-parietal regions of the right hemisphere than on the frontal regions.
At the end of the experiment, we have excluded three participants because of the ocular and muscular artifacts that contaminated their corresponding EEG signals.
2.2. Data analysis
In the last decades, the wavelet transform has emerged as mathematical tools for a number of promising applications: geophysics, biomedical engineering, telecommunications, image and video compression, etc. [11,12]. One advantage of wavelet analysis is the ability to perform a multiresolution analysis of data [13,14]. The multivariate de-noising procedure, used in our study, was developed first, by AminGhafari M. et al., [15] in order to denoise multivariate signals using wavelet and principal component analysis (PCA) taking into account the correlation structure of the noise. The algorithm combines univariate wavelet
denoising in the basis, where the estimated noise covariance matrix is diagonal with noncentered PCA on approximations in the wavelet domain or with final PCA.
The first step of the method consists of wavelet decomposition at level K of each column of matrix X (n×p) containing p signals. This results in details coefficients matrices Dk and approximation coefficients matrices Ak at level 1 to K of
the p signals.
Changing the basis is performed from the diagonalization of a robust estimate of the noise covariance matrix given by the minimum covariance determinant estimator based on the matrix Dj of finest details. The second step consists of a classical one-dimensional soft thresholding applied to Dk. The PCA step is
used to select an appropriate number of useful principal components from both the detail and approximation coefficients matrices. The best number for your principal components is automatically defined using the Kaiser criterion which retains components associated with eigenvalues exceeding the mean of all eigenvalues. From the simplified matrices D and A, inverting the wavelet transform provide a new matrix containing the main features of the original matrix X (p filtered signals).
In our study, we tested 8 wavelet functions belonging to 5 wavelet families which are Daubechies of order 10 (db10) [16,17], Coiflets of order 5 (coif5) [18], Symlets of order 4 and 8 (sym4 and sym8 respectively) [19], Biorthogonal (bior1.1) [20] and Reverse Biorthogonal (rbio1.5) [18].
To evaluate the performance of the above different wavelets, we have calculated automatically the signal-to-noise ratio (SNR) via a MATLAB® routine. This signal processing metric is commonly used to assess the performance of denoising methods. It is defined as the ratio of signal power to the noise power, often expressed in decibels as [21,22]:
(1)
where and σ denote the original and the noise signals respectively.
In the case of closer SNR values, we also used the mean square error (MSE), given by the following equation 2, as second metric to evaluate the accuracy of the chosen wavelet. The value of the MSE, the closer the filtered signal is to the original one and thus the better filtering method is [6,10,21,23].
(2)
where and denote the original and the filtered signals respectively. N is the length of x(n).
In the second step, we used the continuous wavelet transform (CWT) as an alternative method to the classical signal time representation. Indeed, it is proved that wavelet analysis can provide accurate and specific time-frequency decomposition of neurologic signals. It has been applied to EEG denoising [18,24,25], ERP component separation [26], spindle and spike detection [27,28,29], etc. Indeed, the used method allows an automatic processing of the signal and provides both qualitative and quantitative information.
The continuous wavelet transforms convert a continuous signal into extremely redundant signal of dual continuous variables which are the translation and the scale. The resulting changed signal is easy to interpret and valuable for time-frequency or time-scale analysis [30]. In general, CWT of a signal s(t) is defined as:
(2)
where α and β represent respectively the scaling and dilation factors, whereas ψ* is the complex conjugate of the mother wavelet function.
The scale α is associated to the wavelet's central frequency Fc and varies according to frequencies (in Hz) by:
(3)
ΔT is the sampling period.
For time-scale analysis, we represent the modulus of the CWT coefficients, which corresponds to the energy density of the analyzed signal, according to log2(α) (ordinate axis) and time
(abscissas axis) [12]. In this graphical representation, called scalogram, a color map is used to quantify the energy density of the transformed signal. The highest value of the energy corresponds to the white color whereas the lowest is represented by black color [31,32,33].
In our application, ψ is chosen to be the Mexican Hat (equation 4), which is calculated as the second-order derivative of the Gaussian function. This last is not a wavelet, but all its derivatives can be used as wavelets, particularly the first derivative and the second derivative [34][35]. In practice, the Mexican Hat is expressed by the real function of equation (5) and represented by the figure 1 below.
(4)
where 0<δ<1 represents the wavelet width [35]
(5)
Figure 1. Plot of real function of the Mexican Hat function.
As illustrated by this figure, the Mexican Hat waveform looks like most of the waves that compose our ERPs (Figure 2). This justify our choice to use it to achieve the time-scale analysis of our data set. In addition, this function is too easy to implement under the MATLAB environment.
Figure 2. Example of recorded ERP.
3. Results and discussion
The following table 1 regroups averaged values of the performance metrics, SNR and MSE, corresponding to the application of the Aminghafari’s algorithm with different DWT functions to our signals. For this reason, we have recorded …… (how many ERP signals per electrode?) EEG signals from each subject as described in Materials and Methods section (9 electrodes and 20 participants). We have processed 5, 10 and 15 trials to evaluate the efficiency of the filtering algorithm and thus to define the most accurate DWT function allowing filtering ERPs.
The obtained results show that the 10th-order Daubachies wavelet (db10) yielded the best results in terms of accuracy of de-noising ERP signals. In fact, this DWT function have the highest SNR values the lowest MSE ones, in all test conditions. In addition, its application to filter our ERPs shows good improvement of the visual quality of waveforms’ plots as illustrated in the following figure 3.
We have compared these results to those obtained by the classical averaging method implemented under the EEGLab Toolbox. We have found that, for each electrode, the same visual quality of plots is obtained via EEGLab while averaging all recorded signals for SNR values of about 3.5. However, using our db10-PCA fltering method, 5 to 10 ERP trials are sufficient to improve the SNR value and thus to obtain a good results highlighting the N400 wave. This can be explained by the fact that our filtering method is a nonlinear technique which takes into consideration some statistics of the signal and the noise affecting it whereas the averaging method is a linear method that assumes the noise is additive, white and Gaussian.
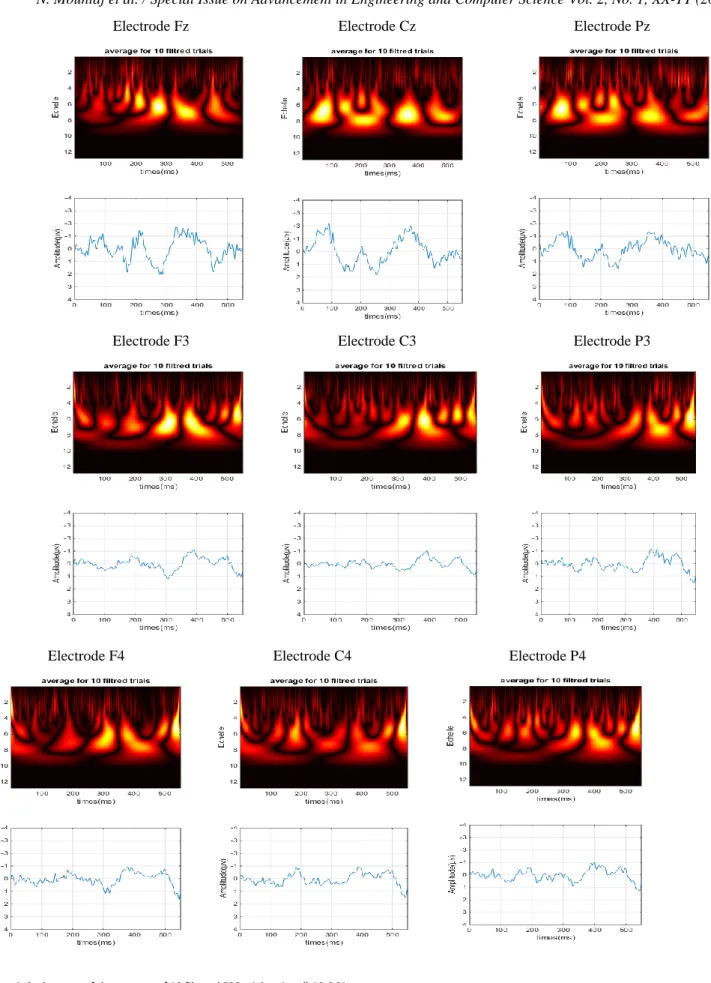
In order to reach more accuracy in N400 waveform detection, a time-scale representation of the ERP signals have been performed on the base of the Mexican hat CWT function. The following figure 4 show an example of the obtained results for the 9 recorded electrodes.
N. Mountaj et al. / Special Issue on Advancement in Engineering and Computer Science Vol. 2, No. 1, XX-YY (2019)
Visual reading of these scalograms reveals the presence of a light-colored vertical bands for medium and small scales depicting smaller changes throughout the ERP signal. In particular, high energy concentrations are observed in the time range [360; 470msec] and for scales between 3 and 8. These regions corresponds to a maximum energy around the position of the N400 wave in the temporal representation of the ERP signal.
Based on these results and similar ones obtained by processing the entire set of data available for this study, the maximum energy localization in time and scale allowed us to
define a qualitative criterion to detect the N400 existence and position. Moreover, we have demonstrated in our previous scientific works, that the primed Arabic words elicit smaller N400 components than unprimed Arabic words [2]. This result has been greatly enhanced by the use of the CWT technique. Indeed, for primed Arabic words, a high energy band is detected around 380 to 410 millisecond, which is a narrow range of about 30 milliseconds, whereas in for unprimed words, this energy region is of very low intensity.
Table 1: Averaged values of metrics obtained using 5, 10 and 15 EEG trials.
Wavelet Name 5 ERP trials 10 EEG trials 15 EEG trials
MSE SNR MSE SNR MSE SNR
Daubachies db10 62,84 7,90 74,96 7,10 68,61 6,13
Coiflets coif5 70,19 6,64 92,70 6,50 79,73 5,66
Symlet sym4 67,63 7,19 86,94 6,77 78,32 5,66
sym8 68,64 7,20 89,95 6,63 78,05 5,75
Mery dmey 102,60 5,42 141,43 5,82 114,99 4,49
Biorthogonal wavelet bior 1.1 73,68 6,59 84,64 6,38 85,34 5,08
Reverse biorthogonal rbio 1.5 67,19 7,26 88,92 6,65 77,26 5,77
Electrode Fz Electrode Cz Electrode Pz
Electrode F3 Electrode C3 Electrode P3
Electrode F4 Electrode C4 Electrode P4
N. Mountaj et al. / Special Issue on Advancement in Engineering and Computer Science Vol. 2, No. 1, XX-YY (2019)
4. Conclusion
In this study we have exploit the wavelets, as signal processing tools, to enhance the quality of the ERP signals recorded during a visual and auditory vowelling and semantic priming in Arabic language experiment. Indeed, we used the discrete wavelet transform to denoise the recorded signals. The filtering procedure combines the DWT and the PCA methods to form a nonlinear filter which allowed us to improve the visual quality of ERP plots on the basis of only few trials. Indeed, 10th-order Daubachies wavelet (db10) was found to be the most efficient one which permits to improve the SNR and thus to more highlights the N400 wave. In addition, our results have been compared to those obtained using EEGLab tools. We have found that the db10-PCA method is more efficient and accurate.
In a second part, we have used the continuous wavelet transform based on the Mexican Hat function to perform the time-scale analysis of our filtered ERPs. The resulting scalograms allowed us to define qualitative and quantitative criteria to detect the presence of the N400 waveform in the auditory and visual evoked signals. The qualitative criterion consists of visual reading of the energy density representation; whereas the quantitative one is based on defining with acute precision the maximum of the N400 energy within time and scale positions. In this case, we have found that, for primed Arabic words, a high energy band is detected between 3 and 8 on scale axis and in the time range [380; 410msec]. This last corresponds to the normal position of the N400 wave in the temporal representation of an ERP. In the case of unprimed Arabic words, a very low intensity energy region is present in the time range [360; 470msec].
Conflict of Interest
The authors declare no conflict of interest.
Acknowledgment
This work was supported by the French-Moroccan Research Consortium (GDRI-Neuro), coordinated by Dr Driss Boussaoud and supported by the French Government and the French Institute of Life Sciences.
References
[1] M. Kutas, S. A. Hillyard, “Reading senseless sentences: brain potentials reflect semantic incongruity” Science 207, pp. 203-205, February 1980.
[2] N. Mountaj, R. El Yagoubi, M. Himmi, F.L. Ghazal, M. Besson, S. Boudelaa. “Vowelling and semantic priming effects in Arabic”. International Journal of Psychophysiology, 95(1), 46-55,2015 [3] Giuseppinalnuso, “Wavelet-ICA methodology for efficient artifact
removal form Electroencephalographic recordings” in International Joint Conference on Neural Networks, Orlando, Florida, USA, August 12-17, 2007.
[4] D. Kang, L. Zhizeng, “A Method of Denoising Multi-channel EEG Signals Fast Based on PCA and DEBSS Algorithm” Computer Science and Electronics Engineering (ICCSEE), vol. 3, pp. 322-326, 23-25, March 2012.
[5] A. Garcés Correa, E. Laciar, H. D. Patiño et H. D. Valentinuzzi, “Artifact removal from EEG signals using adaptive filters” 16th Argentine Bioengineering Congress and the 5th Conference of Clinical Engineering, 2007.
[6] G. Kaushik, H. Sinha, L. Dewan, “Biomedical signals Analysis by Dwt Signal Denoising with Neural Networks” International Journal of Recent Trends in Electrical & Electronics Engg, Dec. 2013.
[7] M. Balamareeswaran, D. Ebenezer, «Denoising of EEG signals using Discrete Wavelet Transform based Scalar Quantization” Biomedical & Pharmacology Journal, vol. 8(1), pp. 399-406, 2015.
[8] R. Princy, P. Thamarai et B. Karthik, “Denoising EEG signal wavelet transform” IJARCET, Vols. 1 sur 21, Issue 3, March 2015.
[9] H. Jasper “The ten-twenty electrode system of the International Federation” Electroenceph. clin. Neurophysiol, pp. 10: 371-375, 1958. [10] N. Fathima, K. Umarani “Reduction of Noise in EEG Signal using Faraday’s Cage and Wavelets Transform: A comparative Study” International Journal of Engineering Science and Computing, July 2016.
[11] S. P. Suhas, K. P. Minal, “Quality advancement of EEG by wavelet denoising for biomedical analysis” International Conference on Communication, Information & Computing Technology (ICCICT)., 2012.
[12] P. Addison, “The Illustrated Wavelet Transform Handbook: Introductory Theory and Applications in Science, Engineering, Medicine and Finance” Bristol: Institute of Physics Publishing, 2002. [13] H. Li, H. Hu, T. Kobayashi, T. Saga et N. Taniguchi, “Wavelet
Multi-Resolution Analysis of Dual-plane Stereoscopic PIV Measurement Results in a Lobed Jet” 4th International Symposium on Particle Image Velocimetry, G¨ottingen, Germany, September 17-19, 2001. [14] A. Drissi, E. Maliani, M. El hassouni, Y. berthoumieu et D.
aboutajdine, “multi-model approach for multi component texture classification” ICISP'12 Proceedings of the 5th international conference on Image and Signal Processing, pp. 36-44 , June 28 - 30, 2012.
[15] M. Aminghafari, N. Cheze et J. Poggi, “Multivariate denoising using wavelets and principal component analysis” Computational Statistics & Data Analysis, pp. 50, 2381-2398, 2006.
[16] M. Vetterli, “Wavelets and Filter Banks: Theory and Design” Report no. CU/CTR/TR 206/90/36, Center for Telecommunication Research Dept. of Elect. Engg. Columbia University, New York, August, 1990. [17] I. Daubechies, “Ten lectures on wavelets” SIAM, CBMS-NSF,
Philadelphia , 1992.
[18] S. Mallat, “A wavelet tour of signal processing” New York, Academic Press, 1999.
[19] M. S. Chavan, N. Mastorakis, M.N. chavan et M. Gaikwad, “Implementation of symlet wavelets to removal of gaussian additive noise from speech signal” Recent Researches in Communications, Automation, Signal Processing, Nanotechnology, Astronomy and Nuclear Physics.
[20] Z. G. S. İ. D. D. F. KARŞILAŞTIRMASI, “Comparison of wavelet
families for mental task classification” The Journal Of
Neurobehavioral Sciences, vol. 3, N°112, May 2016.
[21] A. Sundar “A Comprehensive Assessment of the Performance of Modern Algorithms for Enhancement of Digital Volume Pulse Signals” International Journal of Pharma Medicine and Biological Sciences, vol. 5, N°11, January 2016.
[22] A. Dixit et S. Majumdar, “Comparative analysis of coiflet and daubechies wavelets using global threshold for image de-noising” International Journal of Advances in Engineering & Technology, Nov. 2013.
[23] P. Khatwani et A. Tiwari, “Removal of Noise from EEG Signals Using Cascaded Filter – Wavelet Transforms Method” International Journal of Advanced Researche in Electrical, Electronic and Instrumentation Engineering, Vols. 1 sur 21 sur 23, Issue 12, December 2014. [24] C. Yongjian, “Neural Network Based EEG Denoising” chez 30th
annual International IEEE EMBS Conference Vancouver, British Columbia, Canada, August , 2008.
[25] LanlanYu, “EEG De-Noising Based on Wavelet Transformation” Bioinformatics and Biomedical Engineering, 2009. ICBBE 2009, in 3rd International Conference, pp. 1-4, 11-13, June 2009.
[26] J. Raz, L. Dickerson et B. Turetsky, “A wavelet packet model of evoked potentials” Brain and Language, 1999.
[27] T. Kalayci, O. Ozdamar et N. Erdol, “The use of wavelet transform as a preprocessor for the neural network detection of EEG spikes” Proceedings of the IEEE Southeastcon’94, p. 1–3, 1994.
[28] S. J Schiff, J. Heller, S. L. Weinstein, and J. Milton.” Wavelet transforms and surrogatedata for electroencephalographic spike and seizure detection”. Optical Engineering, 1994. “ 33,2162–2169” [29] Z. W. Tang, and N. Ishii. “The recognition system with two channels
at different resolu-tion for detecting spike in Human’s EEG”. IEICE Transactions on Information and Sys-tems, 1993, E76-D(3), 377–387
[30] T. Kristjansson et J. Hershey, “High Resolution Signal
Reconstruction” IEEE, 2003.
[31] F. R. M. B. J. A. H. Drissi, « Traitement Numérique du Potentiel Evoqué Visuel par la Méthode des Ondelettes : Application au cas de la Sclérose en Plaques » in International Wavelets Conference "Wavelets and Multiscale Methods, Tangier, Morocco, April 13-17, 1998.
[32] R. M. B. J. A. H. Drissi, “Wavelet Transform analysis of Visual Evoked Potentials: Some preliminary results” ITBM-RBM, pp. 22-91, 2000.
[33] F. R. M. B. J. A. H. Drissi, « Analyse du Potentiel Evoqué Visuel par la Méthode des ondelettes: Application au PEV Masqué par l'EEG,» in International Wavelets Conférence "Wavelets and Multiscale , Tangier, Morocco, April 13-17, 1998.
[34] R. M. Rao, AS. Bopardikar “Wavelet Transforms”. Addison-Wesley; 1998.
[35] S. J. Schiff, “Resolving time-series structure with a controlled wavelet transform”. Optical Engineering, 31(11), 2492–2495
References
Citations in the text should be identified by numbers in square brackets. The list of references at the end of the paper should be given in order of their first appearance in the text. All authors should be included in reference lists unless there are 10 or more, in which case only the first 10 should be given, followed by ‘et al.’. Do not use individual sets of square brackets for citation numbers that appear together, e.g., [2,3, 5–9], not [2], [3], [5]–[9]. Do not include personal communications, unpublished data, websites, or other unpublished materials as references, although such material may be inserted (in parentheses) in the text. In the case of publications in languages other than English, the published English title should be provided if one exists, with an annotation such as “(article in Chinese with an abstract in English)”. If the publication was not published with an English title, cite the original title only; do not provide a self-translation. Font size of references are Time New Roman, normal, size 8. Capitalize only the first word in a paper title, except for proper nouns and element symbols. References should be formatted as follows (please note the punctuation and capitalization):
Note that you should include DOI of correspondence reference at the end. No need to categorize the references into journal, conference and thesis headings. References should be cited in text in ascending order.
Journal articles: Journal titles should be abbreviated according
to ISI Web of Science abbreviations.
[1] M. Uzunoglu, M. S. Alam, “Dynamic modeling, design, and simulation of a combined PEM fuel cell and ultracapacitor system for stand-alone residential applications” IEEE Trans. Ener. Conv., 21(3), 767–775, 2006. https://doi.org/10.1109/TEC.2006.875468
Conference Papers:
[2] S. Mumtaz, L. Khan, “Performance of Grid-Integrated Photovoltaic/Fuel Cell/ Electrolyzer/Battery Hybrid Power System” in 2nd International Conference on Power Generation Systems and Renewable Energy
Technologies, Islamabad Pakistan, 2015.
https://doi.org/10.1109/PGSRET.2015.7312249
Thesis:
[3] H. Lihua, “Analysis of Fuel Cell Generation System Application,” Ph.D Thesis, Chongqing University, 2005.
Books:
[4] X. Li, Principles of Fuel Cells, Taylor and Francis Group, 2006.
[5] M. H. Nehrir, C. Wang, Modeling and Control of Fuel Cells: Distributed Generation Applications, Wiley-IEEE Press, 2009.