HAL Id: hal-02555158
https://hal.inrae.fr/hal-02555158
Submitted on 8 Jul 2020
HAL is a multi-disciplinary open access
archive for the deposit and dissemination of
sci-entific research documents, whether they are
pub-lished or not. The documents may come from
teaching and research institutions in France or
abroad, or from public or private research centers.
L’archive ouverte pluridisciplinaire HAL, est
destinée au dépôt et à la diffusion de documents
scientifiques de niveau recherche, publiés ou non,
émanant des établissements d’enseignement et de
recherche français ou étrangers, des laboratoires
publics ou privés.
Flows in Agro-food Networks (FAN): an agent-based
model to simulate local agricultural material flows
Hugo Fernandez Mena, Benoit Gaudou, Sylvain Pellerin, Graham Macdonald,
Thomas Nesme
To cite this version:
Hugo Fernandez Mena, Benoit Gaudou, Sylvain Pellerin, Graham Macdonald, Thomas Nesme. Flows
in Agro-food Networks (FAN): an agent-based model to simulate local agricultural material flows.
Agricultural Systems, Elsevier Masson, 2020, 180 (180), pp.102718. �10.1016/j.agsy.2019.102718�.
�hal-02555158�
OATAO is an open access repository that collects the work of Toulouse
researchers and makes it freely available over the web where possible
Any correspondence concerning this service should be sent
to the repository administrator:
tech-oatao@listes-diff.inp-toulouse.fr
This is an author’s version published in:
https://oatao.univ-toulouse.fr/
2
6297
To cite this version:
Fernandez-Mena, Hugo and Gaudou, Benoît
and Pellerin, Sylvain and
Macdonald, Graham K. and Nesme, Thomas Flows in Agro-food Networks (FAN):
an agent-based model to simulate local agricultural material flows.
(2020)
Agricultural Systems, 180. 102718. ISSN 0308-521X.
Official URL:
https://doi.org/10.1016/j.agsy.2019.102718
Flows in Agro-food Networks (FAN): An agent-based model to simulate local
agricultural material
flows
Hugo Fernandez-Mena
a,b,c,d,*
, Benoit Gaudou
e, Sylvain Pellerin
a, Graham K. MacDonald
c,
Thomas Nesme
baINRA, UMR 1391 ISPA, France
bBordeaux Sciences Agro, University of Bordeaux, UMR 1391 ISPA, France cDepartment of Geography, McGill University, Montreal, QC, H3A 0B9, Canada
dMontpellier SupAgro, UMR SYSTEM (CIHEAM-IAMM, CIRAD, INRA, Montpellier SupAgro, Univ. Montpellier), Montpellier, France eIRIT, Université Toulouse Capitole, Toulouse, France
Keywords: Agro-food networks Material exchanges Biomass and nutrientflows Circular economy Agent-based model
A B S T R A C T
Agro-food networks are characterized by complex material exchanges among farms, processors, consumers, and waste managers involved in fertilization, food, feed and bioenergy production. Better coordination of material exchanges at the local scale can facilitate more efficient resource use. Here, we present a new agent-based model, “Flows in Agro-food Networks” (FAN), which simulates the processing and exchange of fertilizers, feed, food and wastes among farms and multiple upstream or downstream partners (feed and fertilizer suppliers, food in-dustries, waste processors, and anaerobic digesters) in small farming regions. FAN includes a series of en-vironmental indicators that can be used to assess alternative scenarios in terms of ecosystem services, nutrient cycling, and resource autonomy. We use a French case study to demonstrate FAN’s dynamics and to explore the sensitivity of key parameters. We show a strong influence of spatial distance between agents, their disposition to exchange, and their preference for specific materials on local agro-food network simulations. FAN is powerful theoretical tool to explore and assess opportunities for a circular economy in small farming regions and to unravel interactions between recycling, environmental performance and food production.
1. Introduction
Improving resource use efficiency in agriculture is crucial to redu cing pressures on natural resources while simultaneously enhancing agricultural productivity (Erb et al., 2016; Foley et al., 2011). Food systems in many regions are increasingly comprised of highly specia lised farms connected to global markets, which can create spatial dis connects between food consumers and agriculture’s environmental impacts (Liu et al., 2013). Globalization has also resulted in massive exchanges of food, feed, forage, and fertilizers in agriculture (Lassaletta et al., 2014a,2014b;MacDonald et al., 2015), and such‘linear’ flows among regions can exacerbate reliance of local farming systems on external inputs by decreasing the potential for local recycling (Schipanski and Bennett, 2012;Tittonell, 2013). The reliance of agri cultural management on external inputs of fertilizers is especially per vasive in livestock farming systems (Herrero et al., 2013), and has been acknowledged as a key driver of aquatic eutrophication (Leip et al., 2015) and greenhouse gas emissions (Carlson et al., 2016). While the
increasing connectivity created by global materialflows via trade may support increased access to resources at lower prices, it does so po tentially at the cost of decreased local self sufficiency and import de pendency (Fader et al., 2013;Le Noë et al., 2017). In contrast, greater reliance on local materials exchange (‘circular’ flows) can help to pro mote crop livestock integration (Moraine et al., 2014; Regan et al., 2017), efficient waste recycling (Alvarenga et al., 2015;Bodirsky et al., 2014;Metson et al., 2016) and biogas energy production (Lorenz et al., 2013). Circular economy reflects the ideal of maximizing the circularity
of the materialflows involved in the economic activities by the use of local resources and recycling that minimizes waste (Ingrao et al., 2016;
Smith et al., 2016). Similarly, bioeconomy reflects the goal of sub
stituting fossil fuel dependency by the use of organic renewable re sources (El Chichakli et al., 2016; Scarlat et al., 2015,Lainez et al., 2017). Both circular economy and bioeconomy approaches are key for developing more sustainable and autonomous organic and circular materialflows.
Designing and assessing alternative scenarios of material flows
⁎Corresponding author at: Montpellier SupAgro, UMR SYSTEM (CIHEAM-IAMM, CIRAD, INRA, Montpellier SupAgro, Univ. Montpellier), Montpellier, France.
2. FAN model overview
In this section, the Overview Design concepts and Details (ODD) protocol for agent based model descriptions (Grimm et al., 2005,2010) is used here to outline the FAN model purpose, scope, and agents’ characteristics. We also introduce the mechanisms involved in the material exchanges through individual decision making processes. Each of the sub sections further describes more precisely the modelling choices implemented in FAN, including design concepts, submodels and input data.
We developed the FAN model in GAMA 1.7 platform (Drogoul et al., 2013;Grignard et al., 2013;Taillandier et al., 2010), an open sourced coding environment that supports the use of geographical information systems within the agent based language GAML. The GAML code for FAN and its linkedfiles are provided in a linked dataset, the FAN Model v1 Dataset (Fernandez Mena, 2017).
2.1. Purpose
We developed FAN in order to simulate material flows among
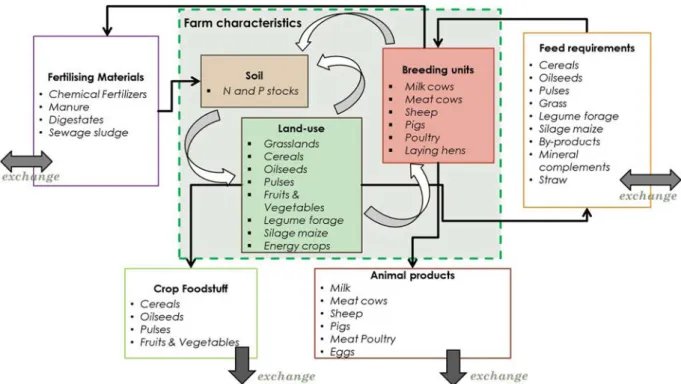
economic agents in local agro food networks. We define agro food networks as encompassing various activities related to food production and consumption at local scales (Fig. 1). They include farming activities and losses to the environment at the farm scale, interactions between farms and their partners through material exchanges, as well as waste and by product recycling. In FAN, food, feed and wastes are processed and exchanged among farms, and their upstream (input providing) and downstream (output using) partners that have direct connections to farms across the agro food network. These partners include feed and fertilizer suppliers, food industries, waste processors, and anaerobic digesters. Their features are presented in the next section.
The theoretical background of the present work is inspired from circular economy principles aiming to reduce waste production by re cycling locally and bioeconomy principles aiming to maximize the use of organic materials instead of non renewable ones. Those concepts call for alternativeflows of materials at the district scale, in particular to better close the nutrient cycles. The key foundations for developing more closed loop agro food systems can be simulated by focusing on individual agent choices (e.g., about material sourcing) across the local network or via exchanges with global markets. The main parameters driving these exchange processes in FAN are choices between organic versus chemical fertilizer use, use of crop products for human food, animal feeding or biomass based energy production, and by product and waste management strategies. In turn, the model can be para meterized in order to simulate alternative scenarios that capture the consequences of different material flows on agricultural production and environmental properties at both the farm and the district scales. Scenarios towards improved closure of organic material cycles can be explored by the user, either by enhancing the willingness of economic agents to exchange organic material at the local scale (through the coefficient preferences) or by altering the organic materials supply or demand properties of agents.
In turn, alternative materialflows impact agricultural production (crops and animals) and nutrient losses associated with resource use efficiency and pollution. To asses these impacts, FAN makes use of various environmental indicators, including greenhouse gas emissions, nutrient losses, and proxies for ecosystem service that result from ma terial exchanges among agents. In FAN, they operate at both the agent and the district scale depending the user goal. Individual indicators are helpful to obtain graphical results displayed in the platform such as forage deficit, or nitrogen accumulation in a specific farm. Collective indicators are useful to summarize the environmental and agricultural performance of the whole group of farms when simulating scenarios and comparing them with the current situation.
within local agro food systems can help decision makers to identify the feasibility and pathways to move towards a circular economy. However, assessment of alternative scenarios is challenged by the complex nature of agro food networks (Fernandez Mena et al., 2016), which involve flows and relationships among different economic agents in the food production sector (e.g., farms, fertilizer and feed suppliers, slaughterhouses, food processors, and waste managers). Modelling in teractions by simulating material exchanges among economic agents in agro food networks is an approach that helps to design, quantify and assess the potential socioeconomic and ecological benefits of social change towards circular economy patterns (Elsawah et al., 2015;
Filatova et al., 2013; Le Page et al., 2013). Agent based modelling is a particularly important as a tool that enables simulation of complex networks of agents in farming systems (Huber et al., 2018).
At present, a relatively small number of studies have applied agent based modelling to agro food systems, and typically focus on specific system components. For example, past agent based modelling has been applied to the study of environmental changes in farming systems (Acosta Michlik and Espaldon, 2008; Murray Rust et al., 2011;
Schreinemachers and Berger, 2011); agricultural markets and policies (Bert et al., 2015; Schouten et al., 2014); land use change (Groeneveld
et al., 2017; Le et al., 2010); agricultural water management (Becu et al., 2003; Gaudou et al., 2014); urban and agricultural waste man agement (Bichraoui et al., 2013; Courdier et al., 2002; Xu et al., 2016); and smallholders farming, rural livelihoods and self sufficiency (Iwamura et al., 2014; Magliocca et al., 2013; Villamor et al., 2014;
Grillot et al., 2018). To our knowledge, agent based models have not yet been applied to simulate material flows across a broader range of components in agro food networks, including multiple agents and ma terials. Such holistic analysis is key to addressing alternative agri cultural development strategies, waste recycling, and environmental impacts related to the circular economy.
Here, we present an agent based model, “Flows in Agro food Networks” (FAN), which facilitates the simulation of organic material exchanges across upstream and downstream agents in agro food net works. One of the distinctive goals of FAN is to be able to simulate all the diverse organic flows at the local scale, i.e. taking place in a specific small farming region. Within this local scale, multiple types of biomass materials containing nutrients are considered in FAN, i.e. fertilizers, forage, feed, food and wastes. By changing agent attributes and agent behavior (such as the disposition to exchange, fidelity or material preference), FAN users can explore scenarios of different material ex changes. The scenarios simulated are assessed through a set of agri cultural and the environmental indicators included in the model that are linked to material flows. Indicators support calculation of the food production (crops, animals and wastes) and environmental perfor mance (resource use, nutrient losses and greenhouse gas emissions). Thus, FAN potential application can produce outcomes assessment arising from multi agent interactions in terms of local food and bioe nergy production, nutrient cycling, greenhouse gas emissions, and other indicators of environmental quality under user defined scenarios. FAN is particularly useful in small farming regions characterized by in tensive agriculture (i.e., high intensity of nutrient inputs and resulting productivity), such as in Western Europe, where pathways for re connecting livestock and arable crops are important for enhancing agricultural sustainability.
In this article, we present and illustrate FAN’s features, by ex plaining its conceptual background, simulation features and ultimate purpose. We describe the agents involved in the model, the assumptions involved in farming production and the indicators. Likewise, we use a district in France as a case study to examine the model sensitivity for key input parameters in the exchanges mechanism. Finally, we discuss the originality and validation of the FAN model, as well as its main limitations and perspectives for improvement.
2.2. Entities, state variables and scales
FAN was developed for application to local scales or small regional case studies (e.g., ≈1000 km2). Although many agent based models have been developed for applications to specific geographical contexts, FAN can be adapted for its use in a variety of rural and agricultural case studies where core input data is available. Key requirements include data on land use, livestock numbers and feed rations, as well as crop yields and fertilization rates. Here, we conduct sensitivity analysis by applying FAN to an agricultural case study for a small farming region of southwestern France with about 835 farms (Ribéracois district in the department of Dordogne, ∼1000 km2; see Section3.1). Although we carried out surveys of major farm partners such as feed and food col lectors and food industries in order to guide the development of FAN, the scale and number of farms is large enough to make comprehensive surveys of individual farmers unfeasible. Therefore, data on farm characteristics comes from public census statistics (Agreste, 2013), in cluding land use and livestock data. This farm‘typology’ data was then completed with observed data through surveys for the rest of agent classes (upstream and downstream partners). Finally, FAN generates a synthetic population of farms of different sizes (ha) and animals (heads). This population follows a normal distribution centered on the observed average land use and livestock characteristics of each farm type in the census.
In FAN, points and vectors are used to represent agents andflows, rather than as raster grid cells that are common in agent based models (e.g.,Grimm et al., 2005;Rebaudo et al., 2011). As a result, agent at tributes, such as the land use of each farm, are stored as attributes. The model is therefore able to take into account the geographic location of the agents (represented as points),flows between agents (represented as vectors), and to distribute these points according to specific addresses
or randomly. Simulation of larger and smaller areas is also possible with FAN, as well as the use of different numbers of agents.
The agent population is composed of eight main types of agents, as represented by the agent class diagram inFig. 2. They include different type of farms and their partners upstream and downstream, feed and forage collectors, food industries (milk & cheese industries, slaughterhouses, and fruits & vegetables industries), waste managers (anaerobic digesters, wastewater treatment plants), and fertilizer wholesalers.
We additionally used an intermediary conceptual agent (‘Partner’, white box inFig. 2) as a modelling tool to allow these agents to si multaneously demand and supply materials on each round of ex changes. Although farms are classified into eight different functional groups according to their characteristics (crops and livestock), all farm agents are capable of a set of defined actions while their annual pro duction is based on their individual agent attributes. For instance, during a simulation, all farms conduct the action of animal feeding at the same time (regardless of the farm type), but farms that do not have animals remain unchanged by this action.
Materialflows represented in the model include different groups of organic wastes and fertilizers, crop and animal products, and other biomass and feedstuff. In general, most of the material categories are flowing in and out of farms (Fig. 3), and only some specific food pro
cessing wastes that are being digested for bioenergy do not come to farms until they are transformed in digestates for fertilizing soils. Ma terials include a range of subcategories such as (i) fertilizing materials (manure, sewage sludge, digestates from anaerobic digestion and che mical fertilizers); (ii) crop products (cereals, oilseeds, pulses, fruits & vegetables, grass, legume forage, silage maize and energy crops); (iii) by products from milk and fruits and vegetables; (iv) straw; and (v) bio wastes from meat and grain processing.
In FAN, the eight farm functional groups are created based on local
Fig. 1. Conceptual framework of the nutrient and biomassflows involved in FAN’s agro-food network. FAN’s system boundaries are indicated by the dotted box. Solid arrows represent material exchanges and dotted arrows represent losses to the environment. Adapted fromFernandez-Mena et al. (2016).
farming typologies, each one having its own surface, land use and li vestock number of heads. Each farm agent may find partners to ex change with, depending on whether they are supplying or demanding specific materials (boxes inFig. 3) and if these materials are exchanged in the network or not. Although the model focusses on local scale ex changes within the specified study area, agents can also exchange with global markets outside of the system boundaries. Global markets in FAN supplies with (i) fertilizers, competing with local organic fertilizers; (ii) feed (cereals, oilseeds and pulses) and forage (such as dry alfalfa), compensating local deficit for feed requirements; and (iii) digestible biomass, compensating local deficit for anaerobic digestion. When local agents are connected to the global market, FAN assumes that they have access to an unlimited supply (e.g., fertilizer supply from the global markets is not initially constrained).
In FAN, each agent has a potential (Ψ ), in kg, for any given material. Agents with a positive potential (internal production > internal re quirements) are considered as‘suppliers’ (ΨS) that can produce mate rial outflows, whereas agents with negative potential (internal pro duction < internal requirements) are considered as‘demanders’ (ΨD) who may receive material inflows. Suppliers representing global supply chains (such as fertilizer or animal feed suppliers) are assumed to have unlimited potential supply and local industries and collectors are as sumed to have unlimited potential demand. On each round of
exchanges, agents search for materials in the network until local re sources are exhausted. In general, an agent’s objective is to maximize their production and to source as much materials as needed to meet this production. Farms aim to both satisfy their fertilizing material, animal feed, forage and straw requirements by collecting appropriate materials from suppliers and to avoid animal manure accumulation on their land by exchanging their surplus. Regarding their partners, food industries, grain collectors and slaughterhouses aim to collect as much food, feed and biomass materials as possible while anaerobic digesters aim to complete their collection capacity. Finally, all partners aim to get rid of their wastes and avoid their accumulation.
2.3. Process overview and scheduling
Since the core purpose of FAN is to simulate local scale material flows in agro food networks, here we present how the related processes are scheduled and what rules govern the types and magnitude of these flows. The steps of the model represent different production and ex change activities during a simulation cycle, equivalent to a year (Fig. 4).
The simulation cycle begins with the production of fertilizing ma terials such as manure, digestates and sewage by farms, anaerobic di gesters and wastewater treatment plants. Excess manure may be saved
Fig. 2. Class diagram in UML (Unified Modelling Language). Agents are represented in boxes with their attributes listed in the middle and their typical actions in the bottom. The eight farm agent functional groups are depicted in green. Solid arrows with hollow white ends represent belongings to a more general category (e.g., an ‘arable farm’ is an extension of the broader ‘farm’ class). Dashed arrows indicate actions as specified in angle quotation marks (< < > >) (For interpretation of the references to colour in thisfigure legend, the reader is referred to the web version of this article.).
Fig. 3. Farm agent entities in the model and their possible interactions and material exchanges with the local and global markets. Solid boxes represent the various types of farm features and white boxes represent the materials that farm agents (8 functional groups) can exchange within the local network. White arrows represent in-farm interactions, black thin arrows stand for interactions between the farm and the market network (supplying or demanding materials) and large black arrows stand for exchanges or actualflows in and out the farm. Note that some exchanges are bidirectional (fertilizers and animal requirements) while some are uni-directional (foodstuff).
Fig. 4. Process schedule along a cycle of one year. Linear arrows represent materialflows interacting at different steps. Arrow loops at steps 1, 2, and 4 represent the materials exchange processes between agents within the network.
for bioenergy production by anaerobic digesters. Locally produced or ganic fertilizer materials are then exchanged with the aim to satisfy nitrogen demand of each farm and avoid excess. If the application of organic fertilizers is insufficient and the scenario allows this type of external input, farms will use chemical fertilizer. Subsequently, each farm’s crop production is calculated as a function of fertilizing material inputs to soils through a simple linear yield response model. Animal feed requirements are estimated according to species specific feed de mand, and crop products are exchanged in order to meet these animal requirements. Once feed and forage requirements are satisfied, live stock production is performed. Livestock production is estimated as a function of feed supply, in particular, as fodder for ruminants. Farming, energy and waste production are explained in submodels Section (2.5). After total crop and animal production has been computed, fruits, vegetables, and animal products are exchanged with local food in dustries, where they are processed, generating processed food and food wastes. Finally, once food wastes have been exchanged with livestock farms and anaerobic digesters, the latter results in bioenergy produc tion. Note that global markets can create competition with local ma terials (e.g., imported chemical fertilizers can compete with local manures for fertilizing soils) or can compensate local production defi cits (e.g., in feedstuff and forage to meet animal requirements).
When exchanging each material, the choice of partners to do each material exchange in the network is made based on the‘weight’ calcu lated according to Eq.(1). Calculating this‘weight’ helps to rank each pair of agents combining a supplier (i) and a demander (j) willing to exchange a specific material (k).
Weighti,j= Proximityi,j * Supply Demand Ratioi,j * Preference coeffi
cientk (1)
Where:
•
´Proximity’ = (Distances1i j,a);‘Distanceij’ is the distance in km between agents i and j and‘a’ is a user defined exponential of distance ac counting for local transportation issues and a key factor when al locating biomass (Görgüner et al., 2015;Metson et al., 2016);
•
‘Supply Demand Ratio’ =min ΨS ΨD max ΨS ΨD(| |, | |)
(| |, | |)
i j
i j ; As explained in Section2.2,
each of those agents exhibits a‘potential to supply’: ΨS( i),and a‘po tential to demand’ (ΨD ),j representing the quantity, in kg of materials,
that could be potentially supplied or demanded, and therefore ex changed, by each of those agents. The ratio accounts for matching potentials among agents, which has been acknowledged to be sig nificant driver of material exchanges (Zhao et al., 2017). This ratio is only applied to local biomass exchanges (i.e., it is not applied to commodities that are sourced from the global market);
•
‘Preference coefficients’ [0 1] are simulation artefacts that we created to orient agents in a context where a specific material type or use is preferred, (e.g., because markets make it cheaper or regulation compulsory). These preference coefficients are used to represent agent behaviour in a context where different material types can serve the same usage (e.g., both mineral fertilizers and animal manure can be used to fertilize soils) or a given material can serve different usages (e.g., animal manure can serve to fertilize soils and to be used as substrate by anaerobic digesters).The parameters that we have established (e.g., distance, supply demand ratio, preference coefficients) drive the possibilities to choose an agent in the network and therefore initiate an exchange. While in theory Eq.(1) applies to any potential supplier or demander of the network, we added three additional parameters to better mimic real world processes and to limit the duration of calculations, for each biomass material type (organic fertilizers, forage, straw and recycled wastes), described as follows:
•
The‘Disposition to exchange’ parameter assumes the possibility that not all farmers are interested in exchanging products (e.g., due to lack of clear prices for some of the biomass products). The ‘dis position to exchange’ is defined by the user, and it applies to the whole agent population. If the disposition to exchange is lower than 100%, a virtual population of disposed to exchange farms randomly chosen is created. The weighting and the selection of the partners exchanging biomass are then performed within that virtual popu lation.•
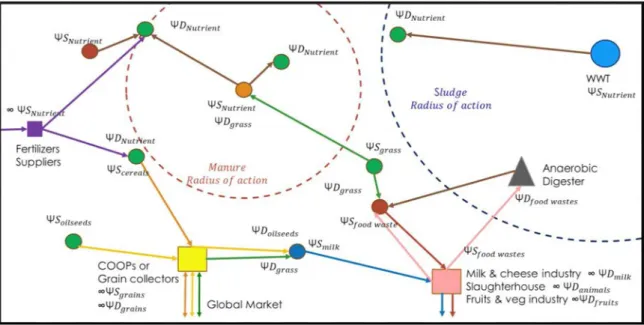
The‘Fidelity’ parameter accounts for the farms keeping the sameFig. 5. Representation of materialflows in FAN. Farms are represented as small circles (green for arable, red for cattle, blue for dairy and orange for monogastrics). Arrows representflows of materials: manure flows are in brown, chemical fertilizers in purple, grass flows in green, cereals flows in orange, oilseeds in yellow, milk in blue, meat in red and food processing wastes in pink. Flows crossing the system boundary represconductingent inflows and outflows with the Global Market. Examples of the radius of action for manure and sewage sludge are show by the dotted circles. ΨS ,i is the‘potential to supply’ and ΨDjthe‘potential to demand’, in kg
of materials, that could be exchanged by a supplier or a demander agent respectively. WWT stands for Wastewater Treatment plant (For interpretation of the references to colour in thisfigure legend, the reader is referred to the web version of this article.).
partner as the previous year for a given product to exchange. The rationale for thefidelity parameter is the potential for small tem poral variability among partners in some farming regions, resulting in a low exploration of alternative exchanges. The‘fidelity’ para meter is user defined, and it applies to a fraction of the whole farm agent population. If a farm presents a true‘fidelity’ parameter, the farm will allocate its biomass materials to the same partners as the previous year, otherwise the weighting and the selection of the partners starts over.
•
The‘Radius of action’ parameter sets the maximum distance over which a given material can be transported. The‘radius of action’ is user defined for each exchangeable product and applies to the whole agent population. The radius of action is applied to bulky biomass materials including manure, sewage sludge, grass, silage maize, and legume fodder that are costly to transport. For a given supplier (or demander), this radius of action de facto excludes any potential demander (or supplier, respectively) that is located beyond its value (Fig. 5).Another process used to govern exchanges is the adaptation of our local network market to either a buyers’ or a sellers’ market depending on the relative number of ‘suppliers’ (ΨS) versus ‘demanders’ (ΨD) present in the network. For instance, if forage demanders are more numerous than suppliers, FAN lets suppliers initiate the material ex change process, and vice versa.
In FAN, we aimed to calculate the probability of all possible ex changes before starting allocating materialflows. Yet, the exchanges carried out are not always the optimum ones. Although the occurrence of the exchanges is proportional to the probability of becoming partners (Eq.(1)), we introduced a stochastic element to make vary farm choices slightly randomly. This stochasticity is a typical characteristic of agent based models, aiming to simulate social complex behavior (Bonabeau, 2002), and in the case of FAN it represents randomness inherent to social interaction between farms. We used the Mersenne Twister algo rithm included in the GAMA platform, the most popular pseudorandom number generator (Matsumoto and Nishimura, 1998). The model cal culates the weights according to Eq.(1)for any potential pair of sup pliers and demanders. Once all possible weights are calculated, pairs of agents are stochastically selected by the model following a probability distribution proportional to the series of weights obtained. Therefore, the corresponding material flows occur one by one, allowing to re calculate weights with the remaining of the agents in the network if they still need to exchange materials.
Note that FAN does not explicitly include prices or economic fac tors, since many biomass materials (e.g., forage, manure, food proces sing wastes) do not have a clear market value. Further consideration of economic modelling processes was considered beyond the scope of the model at this stage, and so our focus is on the biophysical and social factors that may drive materialsflows at the local level. Instead, we included various simulation mechanisms and decision making para meters that can mimic market contexts when prices, costs, subsidies and farming strategies may interact. These parameters include the radius of action, farmfidelity to their partners, their relative disposition to ex change and the set of preference coefficients for specific material uses (Table 1). Note also that the exchange processes are organized to allow for different uses for a given material depending on agent preferences. Preference coefficients integrate in FAN the substitutability of inter changeable materials for the same use and, symmetrically, the partition of a given material into different uses. Such substitutability was applied in our model to chemical fertilizers and organic wastes, grains, forage, other crops and animal products and food wastes (see Section2.5). The pre ference coefficients are a user defined tool helping to fine tune sce narios in FAN. Being more qualitative than quantitative, they serve as additional weighting to the weights calculated for each pair of agents combining a supplier and a demander willing to exchange. To the best of our knowledge, there is no specific data that could be used to derive
precise values for these coefficients. However, our sensitivity analysis described below helps to verify their behaviour.
2.4. Design concepts
Model presentations following the ODD protocol commonly include design concepts (Grimm et al., 2010), which we describe below with specific focus on those relevant to FAN.
2.4.1. Basic principles
The FAN model design follows an intermediate geographic scale in which farms and their partners are connected through a series of rules that govern decisions about materials exchange. The concept and theory behind FAN are related to the fact that agents exchange a series of materials based on their (negative or positive) potential, becoming suppliers or demanders. In FAN, we hypothesised that this potential results from both agronomic constraints (which are well represented) together with economic constraints (only considered through proxies). 2.4.2. Emergence
The model provides emergent, poorly predictable results about competition among agents and among uses related to materialflows. Other emergent results are related to deficits that may occur as a result of competition phenomena, or accumulation of wastes by specific agents (e.g., accumulation of animal manure within livestock farms that did not identify demanding partners). Such emergent results may also arise due to altering system attributes by the user, i.e., by modifying farm behaviour or farm features.
2.4.3. Objectives
Basically, the objective of each agent is to get the materials that are needed for its specific activity and avoid waste accumulation. That is, for suppliers to maximise the amount of materials that can be supplied,
Table 1
User-defined parameters and their default values in the model. Parameters can be adapted to any case study in which FAN is applied.
Parameter name Units Default value
Network features
Exponential of the distance (a) in Proximity Eq.(1)
– a = 1
Fidelity % farms 50
Farm disposition to exchange % farms 50
District capacity of anaerobic digestion kg of materials Specific to the case study
Number of farms – Specific to the case study
Chemical and organic fertilizers Sludge for fertilization preference
coefficient
[0-1] ratio 0.5
Manure for direct fertilization preference coef.
[0-1] ratio 0.5
Manure for anaerobic digestion preference coef.
[0-1] ratio 0.5
Chemical fertilizer pref. coef. [0-1] ratio 0.5 Digestates pref. coef. [0-1] ratio 0.5 Radius of action for manure km 15 Radius of action for sewage sludge &
digestates
km 80
Forage & feed Grass forage-digestion
preference coef.
[0-1] ratio 1
Radius of action for grass km 50 Radius of action for silage maize km 20 Food wastes
Fruits & vegetables wastes for digestion preference coef.
[0-1] ratio 0.5
Fruits & vegetables wastes for animal by products pref. coef.
set to the observed fertilizer application or be adjusted according to a N budget calculated at the farm scale. Farm gate N crop needs are esti mated by summing the N needs of all crop categories within the farm. The farm gate N budget is calculated as of the difference between total N inputs (organic and mineral fertilization, Nfixation by legumes, at mospheric deposition and crop residues mineralization) and total N outputs (harvested crops, crop residues, NO3−leaching, NH3volatili zation and N2O denitrification). N supply from soils is not accounted for since N pools in soils are considered to be on steady state for N. Crop yield response to N application was considered to be linear up to a certain N application level, after which it reaches a plateau corre sponding to the observed regional yields. If positive, the surplus of the N budget corresponds to N losses that are estimated to occur as NO3 leaching. Note that NH3volatilisation from organic fertilizing material storage and application and N2O emissions from soils to the atmosphere are calculated by using emission factors (IPCC, 2013). Users can define the fertilization application rates by defining crop N uptake (we provide values for our case study sample), by using observed fertilization rates, or by setting fertilization restriction policies.
2.5.3. Livestock feed, forage, bedding and production
Once crops are produced, animal requirements are estimated based on observed feed rations, forage use for ruminants, and straw for bed ding that are applied in France (Agreste, 2011). These requirements are first supposed to be satisfied with inner farm production. However, if inner farm production fails to satisfy those animal requirements, the model simulates exchanges with others farms, feed suppliers or with the global market. In FAN, forage requirements per ruminant are linearly proportional to their production within a range of variation of ± 10% around the average forage consumption reported in statistical data (Devun and Guinot, 2012). Finally, ruminant (cows, sheep and goat) meat and milk production are proportional to the forage consumption. In contrast, for monogastric livestock (i.e., pig and poultry), an average feeding ratio per type of animal (piglet, sows, laying hens and chicken) is assumed to be satisfied first by inner, then by local and finally by global (outside the district) feed production.
2.5.4. Waste and by product production
Waste and by product production from food industries can be de termined by using food processing ratios (in %) both from local surveys and national data and by applying these ratios to the amount of raw products (e.g., live animals, raw milk, grains, fruits and vegetables) entering food industries. Although food processing wastes are de manded for energy production by the anaerobic digesters, non animal food wastes such as fruits and vegetable wastes are also demanded by farms for animal feeding. In addition, animal manure production was determined by using excretion rates per animal type (in kg N per animal and per year) collected from national databases (Table 2) that were multiplied by the number of livestock on each farm. Fresh digestates from anaerobic digesters were estimated proportionally to the amount of materials entering anaerobic digesters.
2.5.5. Bioenergy production
In FAN, the number and capacity of anaerobic digesters can be defined by the user. Anaerobic digesters are supplied according to average composition of the feedstock observed in France. According to the French environmental and energy agency‘ADEME’, in 2013, the average composition of feedstock was 68% manure, 17% green biomass (grass, energy and inter crops), and 15% food processing wastes. The energy produced by anaerobic digesters was modelled proportionally to the digestible potential of material inputs. We estimated a production of 42.02 m3of biogas, with 34% of electric yield equivalent to 85.73 kW h of electricity per tonne of feedstock mix (ADEME, 2013;Pöschl et al., 2010).
and, for demanders, to maximise the amount of material that can be collected. For instance, farms aim to both satisfy their fertilizing ma terial, animal feed, forage and straw requirements by collecting ap propriate materials from suppliers and to avoid animal manure accu mulation on their land by exchanging their surplus. Regarding their partners, anaerobic digesters aim to complete their capacity, while food industries, grain collectors, wastewater treatment plants and slaugh terhouses aim to get rid of their wastes and avoid their accumulation. 2.4.4. Sensing
Any agent in the model can sense any of the parameters used in Eq.
(1). These parameters relate to the potential supply and demand of all
the agents and for all the considered materials, the geographic location of all the agents (calculated by Euclidian distance), their history of material exchanges and their preference related to substitutable pro ducts. The fact that each agent can sense these parameters helps to identify the best partnership and to maximise material exchanges. 2.4.5. Interaction
Most interactions among agents are direct, through material ex changes among agents. However, some interactions can also be indirect through some specific resources for which competition among agents occurs. Considering these two types of interaction is key to reveal un expected processes and material exchanges.
2.4.6. Stochasticity
Although the model is clearly deterministic, we added a small sto chastic effect in the process related to the selection of pairs of partners. A random choice of pair of partners is made by the model proportion ally to the weights determined for the whole set of potential pairs of partners. While we considered that the set of parameters used in Eq. 1 is relevant to mimic the fact that two agents become partners, we ac knowledge that this set may not capture all the socio economic pro cesses that determine such relationships. These un captured processes
which we consider beyond the scope of FAN are accounted for by adding stochasticity to the model.
2.4.7. Observation
At the end of each cycle (year), a set of outputs is generated by the model, including food and energy production on one side and green house gas emissions, nutrient cycling and resources use on the other side. Outcomes for these environmental indicators are described in next section, and some of them are used in the Sensitivity Analysis, in Section 3.
2.5. Submodels 2.5.1. Initialisation
In order to initialise FAN, a synthetic farm population was created based on the average features of different farm types. Farms were in deed classified according to their main agricultural productions into different farm types and, for each farm type, we calculated the mean and standard deviation of (i) the total farm area; (ii) the farm’s land use distribution and (iii) the farm’s livestock number. Then, to create the synthetic population of farms, for each farm type, we first used a normal distribution of the farms’ area centered on the mean observed value. We then distributed land use and livestock numbers to the farms proportionally to their area. Other existing partners are placed using points (as a shapefile). Each agent is supposed to have a null stock at the initialisation.
2.5.2. Crop production, fertilization and N balance
Although in some minor cases crop production could be phos phorus limited, we considered that nitrogen (N) was the main limiting factor of crop production (Schils et al., 2018). In FAN simulations, crop yields vary with N applications to soils. Soil N application can be either
2.5.6. Carbon balance
Greenhouse gas (GHG) emissions from agricultural activities were estimated by using the IPCC methods (IPCC Guidelines, 2006; IPCC, 2013), including for livestock enteric fermentation and emissions re lated to organic fertilizing material storage and application. GHG emissions from material transportation were estimated based on emis sion factors from average truck and boat emissions per kg of material transported and per km, for local and global materialsflows respec tively (ADEME, 2017). Additionally, GHG emissions avoided by biogas production and substitution to fossil energy are estimated (European Environmental Agency, 2015). For estimating soil C sequestration, we consider a separate calculation of C from organic fertilizers, C from crop residues and C from grasslands grazing. The C content from organic
fertilizer applications was estimated by using generic C/N ratios of manure, digestates and sewage sludge. The C content added by crop residues is estimated using C content in crops and aerial biomass ratios by a simple soil organic matter dynamics model, followingHénin and Dupuis (1945), that accounts for mineralization and humification pro cesses. Grasslands production and grazing was not simulated, however, we incorporated the generic C net sequestration capacity of European grasslands, followingChang et al. (2016), in the total C balance. 2.5.7. Food and feed district autonomy
Human average food consumption equivalents was used as a proxy to estimate a food autonomy indicator (FAOSTAT, 2010). Feed au tonomy is calculated by the model at the farm and at the district level
Activity or environmental component
Indicators calculated by the model Estimation method
Crop production Kg of cereals, oilseeds, pulses, fruits & vegetables, grass, silage maize and legume forage.
Land use in hectares times regional yields
Livestock production Kg of beef meat, sheep & goat meat, pork meat, chicken meat and eggs
Kg of cow milk, sheep & goat milk
Number of heads on each farm times the average meat and milk production per animal
Food and feed Autonomy Feed and Forage autonomy Food and feed production equivalents
Total production in each district divided by average citizen consumption and average livestock requirements
Renewable Energy production m3of Biogas kWh of electricity
Average digestates composition and energy potential
Logistics Number of exchanges for each material Distance travelled by truck transportation
Simulation counting
Carbon balance CO2direct emissions from: Truck local transportation
CH4livestock enteric fermentation CH4from manure storage N2O from Leaching
CO2indirect emission from:
Forage national supply Feed importation Chemical Fertilizers Avoided emissions:
C storage in soils CO2fossil fuel avoided by anaerobic digestion
Direct and indirect emissions by emission factors (IPCC, 2013) and truck transportation emissions (ADEME)
Avoided emissions:
Humified carbon following C inputs to soils Bioenergy potential (ADEME)
Nitrogen balance Fertilization inputs and crop outputs
Use of N from: chemical fertilizers; recycled sewage sludge Nitrogen leaching
Potential localflows (fertilization, bioenergy, animal feeding). % N recycled
N losses N use
Table 3
Key input data and sources for main important processes in FAN submodels.
Parameter Value and units Source
Land-use and livestock in farms Provided in the model includedfiles (ha of crops and livestock heads per farm)
Agreste (Ministry of Agriculture, France) 2013
Crop regional yields See model includedfiles (kg of crop. ha 1. year 1) Agreste (Ministry of Agriculture, France)
2013
N in animal excreta See model includedfiles (kg N. animal head 1) COMIFER, 2013a N content in crops See model includedfiles (kg N. kg harvested crop 1) COMIFER, 2013b
Average N dose in arable crops 151 kg N. ha 1. year 1 Agreste (Ministry of Agriculture, France)
2011
N in solid digestates, based on a national average N = 5,7% (kg N. kg dM 1. year 1) Houot et al., 2016 Average forage consumption per milk cow, meat cow and ovine or caprine 4700, 4600 and 450 respectively
(kg dry matter. animal 1. year 1)
Devun and Guinot, 2012
Feed requirements per animal and per year (milk cows, meat cows, ovine, caprine, pigs, laying hens and chicken)
e.g., dairy cows:
344 kg cereals. animal 1. year 1 255 kg oilseeds. animal 1. year 1 272 kg pulses. animal 1. year 1 90 kg by-products. animal 1. year 1
Devun and Guinot, 2012;Jousseins et al., 2014;
Gaudré, 2017;
Dusard, 2015;
Straw requirements per animal and per year e.g., dairy cows:
716 kg cereals animal 1 year1
Agreste (Ministry of Agriculture, France) 2013
Waste and by-products ratios in food industries (dairy, fruits and vegetables), slaughterhouses and feed processers in France
See model includedfiles (kg feed and wastes. kg of food process 1)
Food and Agriculture Organization of the United Nations, 2010
Average mix in anaerobic digesters (France) 68% manure; 17% green biomass; 15% food processing wastes
ADEME, 2013
Energy production in anaerobic digestion 42 m3of biogas. mix tonne 1(eq. to 252.12 kW. LHV mix tonne 1
or 85.73 kW h electricity. mix tonne 1)
ADEME, 2011;France Agrimer, 2012 Table 2
ifying parameters linked to fertilizers use and exchange either at the farm or at the network scale. At the farm scale, users can change cropland use and adjust crop fertilizer rates, thereby influencing fertilizer demand. The user can also modify livestock density in farms, thereby driving the amount of manure that can be recycled. At the network scale, the user can modify the preference coefficients for mineral vs organic fertilizers (manure, digestates, sewage sludge) and apply them different radius of action. All these para meters affect the degree of fertilizer use, recycling, and autonomy of the scenarios simulated. In the current version of FAN, the only nutrient associated with theseflows is nitrogen.
b Animal feeding. Similarly, animal feeding may be adjusted either at the farm or at the network scale. At the farm scale, the user may change livestock feed demand by modifying feed rations (cereal, pulses, forage) as well as straw for bedding, and by changing the number of animal species in the farm population. Additionally, users can change cropland use since it affects local supply of animal feed. At the network scale, users can set preference coefficients for forage and food industry wastes involved in biomass competition between livestock farms and anaerobic digesters; in addition, the user may set the forage and straw radius of action.
c Bioenergy production in agriculture. Bioenergy production can be si mulated by defining a number of anaerobic digesters and by ad justing their digestion capacity. The composition of the organic wastes used by the digesters as feedstock may be modified, thereby
changing bioenergy materials demand. At the network scale, pre ference coefficients and radius of action for using manure, forage and food industry wastes can be modified by the user to facilitate or restrict anaerobic digestion.
Ultimately, the combination of these parameters facilitates the ex ploration of different material flow scenarios. These scenarios will not only have an impact on materialflows, but they will also present in directly a complex performance on crop and livestock production, cir cularity, logistics and environmental indicators. However, given that FAN does not currently incorporate explicit economic processes, the model is intended as a heuristic tool to explore the efficacy of agro food networks to facilitate increased local autonomy.
3. FAN model exploration
In this section, we provide an example of FAN model exploration through a case study in France. We conducted a sensitivity analysis on the model in order to explore how FAN outcomes respond to changes in parameterization, as well as to evaluate the model’s internal con sistency. Sensitivity analysis is especially insightful for this study as FAN contains several parameters that reflect behavioral characteristics, which were not empirically derived and therefore cannot be calibrated tofit known values. In addition, we provide a simulation example to show how our case study can be used to apply local exchange scenarios. 3.1. Case study presentation
We used a test case in the southwest of France in order to conduct the sensitivity analysis of FAN. This case study corresponds to the ‘Ribéracois’ (in Dordogne, France), which we refer to as a ‘district’ herein. The Ribéracois has a total area of around 1000 km2, an area slightly smaller than the average county in the US (1642 km2, US
Census, 2010). There are approximately 835 farms that include a di versity of farming activities, such as arable, dairy, beef production, pig, ovine and horticultural production, in both specialised and mixed crop livestock farms. A number of upstream and downstream partners of farms operate across the district. These partners include three large companies that collect cereals and process feed, two milk industries, two slaughterhouses, several small fruits and vegetables industries, four wastewater treatment plants and some projects of anaerobic digestion. Exact location of farms was not available, but because the distribution of the different farm types inside within district subzones was available, the farms were randomly located inside each subzone.
We conducted a validation process by contrasting actual farm practices with the FAN model output, which helps to confirm exchange mechanisms and the alternative material flows simulated. Farming practices related to animal feed rations, distances of biomass exchanges and organic fertilization have been further explored based on inter views with agronomists from the local extension services (Chambre d’Agriculture de la Dordogne) and contrasted with regional statistics (Enquête des pratiques culturales en Aquitaine, 2014;Plan prévisionnel de fumure en Aquitaine, 2014). The destination of crop and animal flows have been consulted with local farming cooperatives, dairy in dustries and slaughterhouses, and therefore the production of organic wastes (Garcia, 2016). Finally, the actual use of biomass for bioenergy has been contrasted withflows from anaerobic digesters recently con structed in the region (personal communication).
3.2. Sensitivity analysis of exchanging mechanisms target parameters We performed a sensitivity analysis by selecting a set of key para meters that we expect to play a central role in circular biomass ex changes, as captured by the mechanisms in Eq.(1)and its associated parameters. Conducting detailed, external validation of such a model with numerous agents is a challenging task that would require intensive by adding farm forage and grains deficit or surplus.
Overall, FAN outputs can be used not only to calculate food (crop and livestock) and energy production, but also to quantify the logistics (number of exchanges and km of truck biomass transport), and to assess regional and farm performance in terms of autonomy and environ mental indicators (Table 2). The environmental outputs for all in dicators are included in the code provided (FAN Model Dataset) but are not further detailed in this paper.
2.6. Input data and initialisation
For application of FAN, various input data are required to char acterise the agents and to define the key processes that are considered. Characterising the agents required specific data about their size (e.g., total area and livestock number for farms or energy production capacity for anaerobic digesters), their main activities (expressed in land use and livestock distribution per farm type for farms) and geographic location. Regarding the latter, the model allows for random spatial distribution of the agents or distribution according to a user defined map. Defining the key processed considered in the model requires local, regional or national data concerning production rates (e.g., crop and animal po tential yields); feed requirements for livestock and anaerobic digesters; waste and by product production from production activities. We col lected these data from French national, regional and local statistics (see
Table 3 for some key examples). Nevertheless, it is recommended that users compile the best available data for application to case studies in other countries. This data gathering was obtained both from public data coming from farming extension programs as well as agricultural census. 2.7. FAN application: parameters to design scenarios
FAN is appropriate for simulating key farming activities that are likely to be involved in circular economy development for agro food systems, such as soil fertilization, animal feeding and bio energy pro duction. Material exchanges related to those farming activities can be modified by farms disposition to exchange biomass and farm fidelity, that can be set by a user aiming to force or reduce local recycling. Additionally, other parameters can be modified to explore contrasted situations as described below.
•
The exponential of the distance in the proximity term of Eq.(1)(parameter“a”) that sets the limitation related to material trans portation.
•
Thefidelity coefficient, that represents the fraction of farms keeping the same partner each year.•
The farm disposition to exchange biomass materials between farms that represents the percentage of farms willing to exchange their biomass.•
The preference coefficients, accounting for the likeability of farms to select a material for a specific purpose. Here we tested those related to manure for both fertilization and digestion uses, as well as the coefficient related to chemical fertilizer use and to grass digestion. As a simple and transparent approach, we varied each parameter by 0.1, 0.5, 1, 1.5, and 2 times the default value (Table 1). This range was helpful to explore the effect of relatively small and large variations of each parameter compared to the default values. For parameters ex pressed in % of farms, these amounts varied in the same proportion, 10; 50; 100 (default); 150 and 200%. The model was run over a period of five annual time steps (i.e., 5 years), and the data from the last year was retained. We then calculated the annual average of the 5 years for each output. In order to minimize randomness related to farm spatial dis tribution and farm size around average farm type size, we used 30 re petitions of these model runs to test each value. Additionally, the random seed was kept along the values tested to avoid the pseudo randomness of the initialisation. We focus our analysis on fertilizing materials (manure, digestates, mineral fertilizer) and livestock feeding (forage, by products and straw)flows.We selected output variables that were helpful to understand how the materialflows were affected by the user defined parameters and to test their capacity to simulate contrasted situations. The output para meters that we considered were as follows:
•
The number of local flows within the district. Such variable ag gregates all the material exchanged or used by the farms for ferti lization, animal feeding or energy production within the area under study. We considered that a flow stops when the corresponding material is used to produce either food or energy. Exchanges in flowing or going to the global market were not included. We have classified these flows into (i) local fertilization flows (Fig. 7) in cluding manure, sewage sludge and digestates applied to soils; (ii) animal requirementsflows including forage, by products and straw for bedding; and (iii) energyflows including manure, grass and food processing wastes allocated to anaerobic digesters.•
The average distance in exchanges of manure and grass. This vari able was calculated as the average distance travelled in km by a specific material when flowing from one agent to another.•
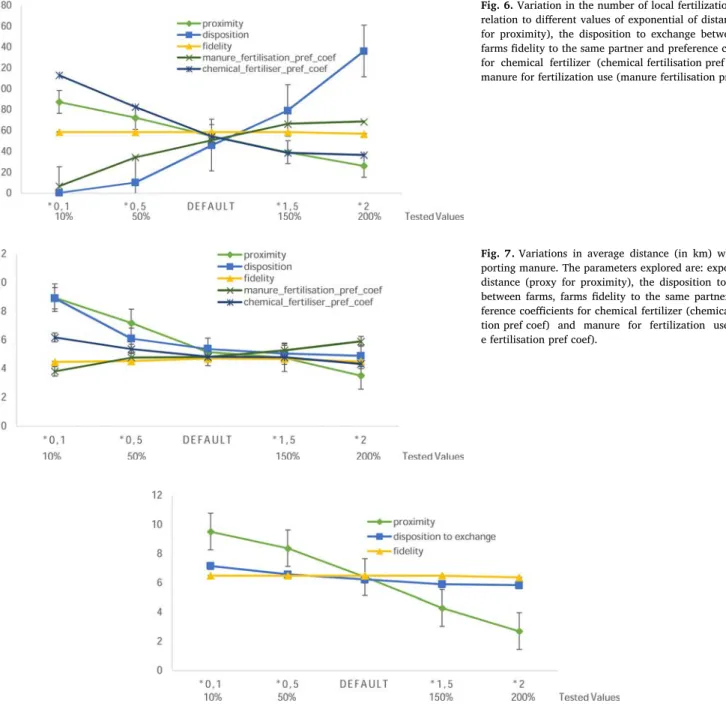
The CO2 emissions from material transportation by trucks. This variable accounts for the distance travelled by a given material whenflowing from one agent to another but also for the weight of the materials transported at each exchange.Regarding fertilizing materials (manure, digestates and mineral fertilizer)flows, the results showed that although the exponential of the distance (proxy for proximity) has an important role, the disposition to exchange biomass between farms clearly drives the amount of manure and consequently of digestates that were exchanged (Fig. 6). The pre ference coefficients for manure and chemical fertilizers induce or re strict the number of local fertilizationflows, respectively. For example, if greater preference is given to using manure for fertilization, this
implies a local resource exchange inside the region rather than external sourcing of chemical fertilizers (Fig. 7). Finally, thefidelity factor does not strongly affect the fertilization flows. When focussing on manure exchanges, we found that, as expected, manure travels greater distances when proximity between partners is not encouraged (low values for exponential of distance), suggesting greater tolerance for long transport distances (Fig. 8). We also found that manure travels greater distances when the farm disposition to exchange materials is low. This is prob ably explained by lower supply of manure when the disposition to ex change material is low, therefore inducing long distances to meet manure demand.
Regarding the biomass used for livestock feeding (i.e. forage, straw and by products), we found that, in contrast, the number offlows of these materials are poorly affected by the considered input parameters (proximity, disposition to exchange and fidelity, data not shown). Indeed, there is no substitution of such materials with other ones or with other uses since in the FAN model it has been considered that animal feeding materials arefirstly exchanged among farms, followed by inflows from the global market only when local supply is exhausted. Finally, we found that the distance travelled by these materials is clearly reduced when long distances between partners are penalized (high values for the exponential of the distance,Fig. 8). However, the disposition to exchange between farms and thefidelity does not affect the distance travelled by these materials between local partners.
Overall, the tested parameters demonstrate higher sensitivity of fertilization material exchanges than feed materials, especially con cerning the distance travelled. One of the reasons is that an accessible global market option (chemical fertilizers) exists as an alternative to local fertilization materials, so farms can switch easily depending on their preference. Since local organic materials travel shorter distances, they are more likely to be chosen. In the case of forage and by products, however, even in a context of low disposition to exchange, the local materials are easily exchanged locally and exhausted before being substituted by external flows so long. Although no information was available concerning farm fidelity for biomass exchanges, our sensi tivity analysis suggest that it has a minor influence. Consequently, lowerfidelity values are unlikely to optimize the best agent choice to do an exchange over time. This is probably because relationships initiated at thefirst cycle (year) are already close to ‘optimal’ in FAN. We also notice an indirect relationship among input parameters and output variables (e.g., between the disposition to exchange and the distance travelled by materials), highlighting the relevance of using agent based models to simulate complex multi agent decisions. We also tested other parameters related to the model application to different case studies, such as the number of farms, the radius of action for materials ex changed between farms, or the capacity of anaerobic digestion. Since these parameters had little influence on model outputs, we decided not include them in the results shown in this section. This sensitivity ana lysis is helpful to evaluate our model, and to understanding which parameters are driving alternatives material exchanges across sce narios. The results show a wide range of variation and enough to give an idea of how the user defined parameters included in FAN can be useful.
3.3. Case study scenario simulation example
We simulate a basic scenario in which local autonomy is enhanced through the maximization of material exchange for fertilization and bioenergy production within the Ribéracois district. This is im plemented by increasing the disposition to exchange biomass materials (set to 100% of farms) and by adding 10 anaerobic digesters with a digestion capacity set to use all the manure available in the district. The remaining parameters have been set by default. The model is able to
both graphically simulate biomass material flows between farms
(Fig. 9) and to quantify them as changes in stocks. Other properties linked to materialflows, such as farm gate deficit for a given material data collection beyond the scope of this paper. We instead focused on a
sensitivity analysis as a kind of internal validation to examine the role and influence of each parameter, as well as to better understand un certainties in parameterization. Of the full set of parameters (Table 1), we examined:
(straw, forage, fertilizer) can be also represented (Fig. 10), as well as supplies of grains or food waste recycling (Fig. 11).
Each of the simulated aspects includes the calculations of indicators both at the farm and at the district level that are provided by FAN through GAMA platform interface, see supplementary materials. Altogether, the simulation showed higher levels of nutrient autonomy, as well as a considerable amount of bioenergy produced trough anae robic digestion. In reality, the high number of localflows simulated for material transportation between farms would involve complex logistics. However, these local material exchanges have a relatively small impact on the total C district balance, as C transportation emissions were compensated by reduced chemical fertilizer inputs and increased bioenergy production. Since crop and livestock were not modified, and the global market compensated for any local material deficits, food production was not affected in this scenario. This simulation example serves as an illustration of how FAN enables consideration of complex spatial interactions and feedbacks with multiple indicators. Assessing
the relative farming and environmental performance of across con trasted scenarios will be the scope of further studies.
4. Discussion 4.1. FAN originality
Understanding how multi agent behavior affects materials exchange is key to identify the drivers and dynamics of agro food networks. Although agent based models related to agricultural systems and nu trient management already exist (Grillot et al., 2018;Iwamura et al., 2014;Schreinemachers and Berger, 2011), to our knowledge FAN is the first model that combines social simulation with the environmental characteristics of farms across a wide range of materials in more com plex agro food networks. Therefore, one of the core innovations of FAN lies in its ability to simultaneously simulate multiple bio sourced and biomass materials as a network of local potential exchanges. Another
Fig. 6. Variation in the number of local fertilizationflows in relation to different values of exponential of distance (proxy for proximity), the disposition to exchange between farms, farmsfidelity to the same partner and preference coefficients for chemical fertilizer (chemical fertilisation pref coef) and manure for fertilization use (manure fertilisation pref coef).
Fig. 7. Variations in average distance (in km) when trans-porting manure. The parameters explored are: exponential of distance (proxy for proximity), the disposition to exchange between farms, farmsfidelity to the same partner and pre-ference coefficients for chemical fertilizer (chemical fertilisa-tion pref coef) and manure for fertilizafertilisa-tion use (manur-e f(manur-ertilisation pr(manur-ef co(manur-ef).
Fig. 8. Average distance (in km) of localflows for forage, straw and by-products used by livestock. The explored parameters are: the exponential of distance (proxy for proximity); the disposition to exchange biomass and thefidelity.
originality of the model lies in the considered system that encompasses a large range of agents, a key resilience factor in social ecological sys tems (Grêt Regamey et al., 2019). In total, eight types of agents were considered, which is beyond the agents modelled in other farming agent based models, (e.g., two inShastri et al., 2011for famers and bio refineries, and five farmer strategies inValbuena et al., 2010). Con sidering both a large number of agent types and of material types helped to address an intermediate spatial scale between the farm and the country. Such a small region level is critical since all actors involved in this delimited area are uniquely identified in FAN, at the individual and at the collective level, which helps the evaluation of circularflows between farms and specific partners. In addition, due to its capacity to apply strong circular economy principles for recycling biomaterials more efficiently and therefore promoting other uses such as energy, the
FAN model can help to assess competition between bioenergy and food sectors and to develop climate smart farming systems at regional scales (Andrieu et al., 2019). Finally, our model was developed by combining multiple approaches in order to address a set of environmental and economic issues linked to circular materialflows and the challenges they face in a global market offering manifold farm inputs.
4.2. FAN evaluation
Through the Ribéracois case study, we were able to evaluate some of the model mechanisms and other assumptions about farm func tioning with local extension agronomists and with associated food in dustries. Although the magnitude of the combinations in a jurisdiction with 850 farms constrained gathering data on farming practices and
Fig. 9. Local fertilizationflows in Ribéracois in a scenario aiming to maximise local exchanges and agricultural biogas production. Material exchanges are re-presented by straight lines, with colours varying according to the type of material that is exchanged. Note that fertilising materials go both ways between farms and anaerobic digesters as manure (from farms to anaerobic digesters) and as digestates (from digesters to farms). The legend indicates farm partners: wastewater treatment station in big blue circles; anaerobic digesters in grey triangles and feed collectors in yellow squares. It also represents materialflows with lines joining supplier and demander agents: manure for fertilizationflows are in black lines; manure for digestion flows are in brown lines; digestates flows are in orange lines; sewage sludgeflows are in blue lines and chemical fertilizer flows in purple lines. Farm typologies are represented by colored circles: green for arable farms; black for mix farms; red for beef cattle farms; blue for dairy cattle farms; purple for mix cattle farms; grey for ovine and caprine farms; orange for monogastric farms and yellow for horticultural farms (For interpretation of the references to colour in thisfigure legend, the reader is referred to the web version of this article.).
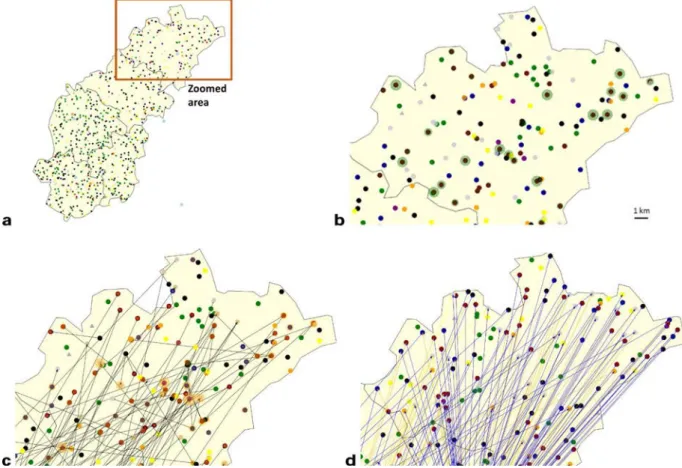
Fig. 10. Zoomed view of the northern portion of the Ribéracois district (panel a), with focus on farm-gate forage deficit, represented by green circles (panel b); farm-gate straw deficit, represented in orange circles and straw flows, represented by black arrows (panel c); and grain supply as cereals, oilseeds and pulses, represented in orange, yellow and blue arrows, respectively (panel d). SeeFig. 9for the whole legend (For interpretation of the references to colour in thisfigure legend, the reader is referred to the web version of this article.).
Fig. 11. Grain collection in the Ribéracois district as cereals, oilseeds and pulses (represented as orange, yellow and green lines, respectively) (panel a). Food industry wastesflows in the Ribéracois district (panel b); the squares represent food industries: blue for dairy; green for fruits and vegetables, orange for grains and red for meat industry. The arrows represent the associated food industry wasteflows for animal feeding and anaerobic digestion (For interpretation of the references to colour in thisfigure legend, the reader is referred to the web version of this article.).