COST OPTIMIZATION OF A
SOLAR-POWERED
ELECTRODIALYSIS DESALINATION SYSTEMby
Sterling M. Watson
S.B. in Mechanical Engineering
Massachusetts Institute of Technology, 2015
Submitted to the
Department of Mechanical Engineering
in partial fulfillment of the requirements for the degree of
Master of Science in Mechanical Engineering
at the
MASSACHUSETTS INSTITUTE OF TECHNOLOGY
June 2017
2017 Massachusetts Institute of Technology. All rights reserved.
Author: ...
re d a c te d
Depa'ment of Mejhanical Engineering~May 12, 2017 Certified by: ...
S n atu re redacted
Tonio Buonassisi Associate Prpfessor of Mecanical Engineering
Signature
redacted
esis Co-SupervisorA ccepted by: ... MASSACHUSETTS INSTITUTE
OF TECHNOLOGY (
uJ
JUN
2 12017
Ian Marius Peters Research Scientist in Mechanical Engineering Thesis Co-Supervisor
Signature redacted
Amos Winter Assistant Professo 45lefechanical Engineering Thesis Co-Supervisor
Signature redacted
"' Rohan Abeyaratne Professor of Mechanical Engineering Chairman, Committee on Graduate Students
Cost Optimization of a Solar-Powered Electrodialysis Desalination System
by
Sterling M. Watson
Submitted the Department of Mechanical Engineering on May 12, 2017 in Partial Fulfillment of the Requirements for the Degree of Master of Science in
Mechanical Engineering
ABSTRACT
With their autonomous operation and low environmental impact, solar photovoltaics (PV) are an attractive power source for off-grid systems. One application of PV is for powering village-scale desalination systems, which are needed in regions with a saline drinking water supply and an unreliable electric grid. However, the intermittent and non-dispatchable nature of solar energy is not well-suited to conventional loads that are designed to operate off of a steady electrical grid, so it is important to design and optimize PV-powered systems such that they are persistent, reliable, predictable, and low-cost.
In this thesis, I present a solar photovoltaic-powered electrodialysis reversal (PV-EDR) model, and use it to design a steady voltage and pumping EDR system composed of current off-the-shelf parts for Chelluru, a village near Hyderabad, India. I investigate flexible operation and load sizing as design approaches for low-cost PV-powered systems, and apply these concepts to a
theoretical reference system and the PV-EDR system. I also present the results of a 7-day field test of the PV-EDR system in Chelluru.
Through a sensitivity analysis performed with the PV-EDR model, I found that easing the output reliability constraint for the PV-EDR system from 100% to 98% reduced the system capital cost by 5.7%, indicating that usage of alternative water supplies during brief and infrequent periods of low sunshine could be a cost-effective way of supplementing PV-EDR if constant water production is required year-round. I found that the capital cost of the PV-EDR system was highly sensitive to the cost of the PV-EDR membranes, and foreseeable membrane cost reductions of 87% could reduce the cost of the total system by 50%. This observation was reaffirmed through an analysis of the effect of flexible operation and load sizing for PV-powered systems, which revealed that if the electrical load can be designed to operate primarily during the sunny hours of the day (as would be the case for a larger EDR unit enabled by inexpensive membranes), the PV and batteries could be downsized compared to a system that operates through the night.
The PV-EDR model presented in this thesis was found to predict the operation of the installed system within 13% for the 7-day village test. This model can be adapted to other PV-powered systems to aid in design and cost optimization, and its accuracy will be further improved through additional testing and improved PV and battery device models. The flexible operation and load sizing design approaches detailed in this thesis will be useful for informing the design of any PV-powered system with accumulable output.
Thesis Supervisors:
Tonio Buonassisi, Associate Professor of Mechanical Engineering Amos Winter, Assistant Professor of Mechanical Engineering Marius Peters, Research Scientist in Mechanical Engineering
ACKNOWLEDGEMENTS
I would like to thank my advisors in the PVLab and the GEAR Lab for their guidance and support throughout this project. I have benefitted tremendously from the wisdom and direction that Professor Tonio Buonassisi has shared with me, and I am tremendously inspired by his vision and dedication pushing for solar photovoltaics technologies and adoption forward. I am also so grateful for the guidance and assistance that Marius Peters has given me throughout all stages of this project, from project formulation, to technical details, to the writing of this thesis. My advisors in the PVLab have been indispensable in pointing my research in a fruitful direction and helping me over countless hurdles throughout the pursuit of my master's degree. I am truly grateful for the PVLab community and the professional relationships and friendships that I have formed as a part of this group.
I would also like to thank Professor Amos Winter for the wonderful opportunity to design, install, and field-test a PV-EDR system as a member of the GEAR Lab. I have learned so much from him as a teacher and a mentor, and talking with him has never failed to renew my excitement to be an engineer. Natasha Wright has been an incredible inspiration to me, and it has been an honor to work with her at MIT and during our field work in India. I truly cannot thank my research partner, David Bian, enough for the dedication that he has put into this project, and his commitment to being an exceptional team member. It is due to his unfailing hard work that our PV-EDR system is operational in the field today. As a whole, GEAR Lab is a remarkable, supportive community making incredible engineering impact in the developing world, and I have learned so much from them.
I am very grateful to have been a co-advised student in the PV and GEAR Labs at MIT. It has allowed me to combine my passions for renewable energy systems and global impact, and having access to the expertise of both groups has put me in the best position to develop my understanding and knowledge of PV-powered systems. This work has benefitted tremendously from the excellent team at Tata Projects, who helped us in every detail of field testing and who share a passion for making PV-powered desalination the standard in India's villages. I would also
like to thank our partners at the Singapore-MIT Alliance for Research and Technology (SMART), in particular Nasim Sahraei.
Finally, I would like to thank the sponsors of this research and my graduate studies: Tata Projects Ltd., USAID, the MIT Energy Initiative (MITEI), the MIT Tata Center for Technology
and Design, and the MIT Presidential Fellowship.
ACKNOWLEDGEMENT OF JOINT WORK
This project was done jointly with David Bian as part of a collaboration between the PVLab and GEAR Lab. Our theses were prepared in parallel and share much of the same content, but have been crafted to highlight each of our individual contributions.
CONTENTS
A cknow ledgem ents... 5
A cknow ledgem ent of Joint W ork ... 6
List of Figures ... 10
List of Tables ... 11
Chapter 1: Introduction... 12
1.1 M otivation for PV -Pow ered System Optim ization ... 13
1.2 Motivation for Off-Grid, Village-Scale Electrodialysis Desalination ... 14
1.3 Prior A rt... 17
1.3.1 Previous W ork on PV System Optim ization ... 17
1.3.2 Previous Work on PV-Powered Desalination System Design ... 17
1.3.3 O bjectives and Scope... 19
1.4 A pproach ... 20
1.5 Structure of Thesis ... 21
Chapter 2: Theory ... 22
2.1 Solar-Pow ered System s w ith A ccum ulable O utput ... 23
2.1.1 The Theoretical Reference System ... 23
2.1.2 Energy A nalysis... 23
2.2 Relationship Betw een PV and Batteries... 25
2.3 Energy Storage and Product Storage... 27
2.4 ED R Behavior ... 28
2.4.1 ED R Stack A rchitecture ... 28
2.4.3 Lim iting Current Density... 31
2.4.4 EDR Design Considerations... 32
Chapter 3: Developm ent of a PV-EDR M odel... 34
3.1 The EDR M odule ... 36
3.2 The Pum p Selection M odule ... 36
3.3 The Power System M odule ... 37
3.4 The Cost M odule... 38
3.5 PV-EDR Coupled Behavior ... 39
3.6 PV-EDR Sim ulation... 39
3.7 Optim ization... 41
3.7.1 Particle Swarm Optim ization... 41
3.7.2 The Optim ized PV-EDR System ... 41
3.8 Comparison to a PV-EDR System Designed Using Conventional Engineering Practices. 43 3.9 Sensitivities ... 46
Chapter 4: Advantages of Operation Flexibility and Load Sizing... 50
4.1 Flexible Operation... 51
4.2 Load Sizing ... 54
4.3 Effects of Operation Flexibility and Load Sizing on the Reference System ... 55
4.4 Effects of Operation Flexibility and Load Sizing on the PV-EDR System ... 59
Chapter 5: Design and Field Testing of a PV-EDR System ... 62
5.1 Experim ental Setup ... 62
5.2 Experim ental Procedure ... 65
5.3 Comparison of the Modeled and Measured Performance... 66
5.3.1 EDR Load Power... 66
5.3.3 Battery ... 70
Chapter 6: Conclusions and Future W ork... 72 References... 77
LIST OF FIGURES
Figure 1. Map of Groundwater Salinity Levels Throughout India... 15
Figure 2. The Theoretical Reference System ... 23
Figure 3. Relationship between PV Area and Battery Capacity ... 26
Figure 4. 100% Output Reliability Curve ... 27
Figure 5. Electrodialysis Process ... 29
Figure 6: Concentration, Resistance, and Power Over a Single EDR batch... 31
Figure 7. Flowchart of the PV-EDR Simulation... 35
Figure 8. Pow er System Logic Tree ... 38
Figure 9. Simulated Battery Charge and Tank Fill Level for the Optimized PV-EDR System ... 42
Figure 10: Cost Breakdowns for Design A and Design B... 45
Figure 11: Battery Energy and Tank Fill Level for Design B ... 46
Figure 12. Sensitivity of the PV-EDR System to Output Reliability ... 48
Figure 13. Sensitivity of PV-EDR Capital Cost to Individual Component Costs ... 49
Figure 14. PV and Load Power Profiles for the Reference System Under Fixed and Flexible O p eratio n ... 52
Figure 15. Histogram of Hours Operated per Day for the Flexibly Operated Reference System 53 Figure 16. Illustration of a Load Power Profile and PV Power Output... 55
Figure 17. Relationship Between PV Area, Battery Capacity, and Power System Cost for Fixed and Flexible Operation of the Reference System ... 57
Figure 18. Power System Cost for the Reference System for Various Load Sizing ... 58
Figure 19. Hours Operated per Day for $20 and $150 Membrane Cell Pair Systems... 61
Figure 20. Layout of the Pilot PV-EDR System... 65
Figure 21: Comparison of Simulated and Measured EDR Power Profiles... 67
Figure 22. ED R Load Pow er... 68
Figure 23. PV A rray Pow er Output ... 69
LIST OF TABLES
Table 1. PV -EDR Input Param eters... 40 Table 2. PV -EDR Design Variables ... 40 Table 3. Optimized PV-EDR System Design Variables... 41 Table 4: Design Variables for Design B Selected Using Conventional Engineering Practices ... 45 Table 5. Optimized PV-EDR Design with $20 Membrane Cell Pairs... 60
CHAPTER
1
INTRODUCTION
This thesis investigates design approaches for building persistent, reliable, predictable, and affordable PV-powered systems, and applies these concepts in the design of a cost-optimized, off-grid, village-scale, solar photovoltaic-powered electrodialysis reversal (PV-EDR) desalination system. This PV-EDR system was built, installed, and field-tested in Chelluru, a village near Hyderabad, India. In this work, I investigate the effects that operation flexibility and load sizing,
two methods of improving the suitability of an electrical load to PV power, have on the total cost of PV-powered systems, and I use these learnings to recommend future work in PV-EDR system design. The results and contributions of this work are the following:
* Demonstration of a PV-EDR model
" Presentation of a cost-optimized PV-EDR system design composed of currently-available off-the-shelf components
* Investigation of the cost reductions enabled by flexible operation and load sizing for generalized PV-powered systems
" Installation and results from a PV-EDR field test in Chelluru, India.
1.1 Motivation for PV-Powered System Optimization
Solar photovoltaics (PV) represent an autonomous and environmentally benign power source for off-grid systems. According to the World Bank, 27% of the global rural population lacked electricity access in 2014 [1]. Solar is the most abundant renewable energy source, and can play a key role in mitigating anthropogenic carbon emissions and climate change while also serving as a low-maintenance energy source for regions without a reliable grid connection. While PV modules have historically been cost-prohibitive in many applications, particularly in the developing world, PV module prices have declined by lIx during the last decade, enabling their use in these new markets.
However, adapting existing systems to PV power in a cost-effective and reliable way is not always straightforward. While conventional energy sources and grid electricity are dispatchable and non-intermittent, PV is naturally intermittent and non-dispatchable [2]. An electrical load designed to operate on a continuous conventional energy source requires adaptation to operate with a variable PV power source. A storage medium can buffer the variability of the PV power
source, rendering solar power predictable and persistent [3] [4].
A key challenge in the field of PV-powered systems is to create systems that are simultaneously low-cost and sufficiently non-intermittent. Inadequate system design yields either higher cost (over-design) or lower reliability (under-design) [5]. Low cost and high reliability are desired features for PV-powered systems, particularly in the developing world. On the other hand,
co-design (as opposed to independent, disaggregated design) of the PV subsystem, storage media, and electrical load represents an opportunity for deep cost reductions and technological innovation. Furthermore, an opportunity exists to template key learnings in a system-design framework, to enable rapid development of a wide range of future optimized PV-powered systems. Cost reductions through system optimization are essential to accelerating PV-powered system adoption in low-income, off-grid environments [6] [7].
1.2 Motivation for Off-Grid, Village-Scale Electrodialysis
Desalination
There is a global deficiency of safe drinking water sources, despite the existence of technologies that can purify or desalinate a local water supply. In 2015, the WHO / UNICEF Joint Monitoring Programme (JMP) for Water Supply and Sanitation reported that nine percent of the global population, or 663 million people-close to the number of people living in the European Union-do not use an improved drinking water source [8]. In India, dissolved salts are a primary contaminant of the groundwater supply, and brackish groundwater (defined as water with a total dissolved solids content (TDS) between 500 and 30,000 mg/L) underlies approximately 60% of the land area (Figure 1) [9]. The Bureau of Indian Standards for Drinking Water has set the acceptable upper limit for TDS to 500 mg/L for improved palatability and minimal risk of gastrointestinal irritation [10]. Desalination is required to make brackish groundwater an acceptable drinking water source.
TDS (ppm)
<480 480 - 960
960 - 1920 > 1920
Figure 1. Map of Groundwater Salinity Levels Throughout India
Regions colored red, yellow, or green have brackish groundwater above the taste threshold. [9]
In 2015, 96.7% of villages in India had some form of grid electricity [11]. However, the grid electricity in most villages is not reliable, nor do many households benefit from it. In 2011, only 55.3% of rural households used electricity for lighting [12], implying that not all households in electrified villages have reliable access to basic electricity. Even those that do have access to electricity experience intermittent power outages, and may only have access for a few hours a day. Because of the limitations of the current electrical grid, grid-powered desalination is not viable for much of India's rural population.
Grid-reliant desalination systems must be designed to meet the daily water needs of a village within the limited number of hours for which grid access is available [13]. For example, if a village requires 10,000 liters of water and has 5 hours of grid electricity per day, then the production rate of the desalination system must be 2,000 liters per hour (LPH). If the village has only 1 hour of reliable electricity, then the desalination system must have a production rate of 10,000 LPH. Because the capital cost of a desalination system roughly scales with the water
Despite the challenges of implementing desalination in rural settings, expanding to this subsection of the population is critical for meeting the drinking water needs of villages without reliable grid access. Based on maps compiled by the Central Groundwater Board of India, it has been concluded that village-scale desalination, in addition to other purification methods, could at least double the land area for which groundwater can acceptably be used as drinking water in India [13].
Because of the constraints of an unreliable grid, PV-powered desalination systems have become more attractive. This is particularly the case in India, where solar energy is readily available and water consumption is correlated with solar irradiance [13]. Solar energy is locally and indefinitely available, eliminating the need for consumable fuels such as diesel. PV panels also operate silently and without pollution to the environment and require minimal maintenance. However, the addition of a PV power system to a desalination unit significantly increases the capital cost of the total system. When comparing similar capacity systems designed for on-grid and off-grid operation, the cost of the off-grid, PV-powered reverse osmosis (PV-RO) system is more than double that of the on-grid system. According to an Indian OEM infrastructure company that has installed over 2,000 RO systems in the field, an on-grid 500 LPH RO system costs approximately $4,500, while an equivalent unit equipped with a PV power system costs $11,250
[14]. To make off-grid desalination systems economically feasible, it is necessary to reduce the cost of the PV power system.
One way to reduce the cost of the PV power system is to reduce the power requirements of the desalination unit. Electrodialysis (ED) is a desalination technology that separates salts from water by inducing movement of ions across semi-permeable ion-exchange membranes through the application of an electric potential. Electrodialysis reversal (EDR) is a variant of ED that periodically switches the polarity of the applied voltage to reduce salt buildup and extend membrane life. ED is expected to have a lower specific energy of desalination than RO for brackish water salinities below 5,000 mg/L. In fact, ED may require less than 50% of the energy used by RO to desalinate water below 2,000 mg/L, which represents the majority of India's brackish groundwater [13]. These factors suggest that ED could provide a low-cost, off-grid brackish water desalination solution [15].
1.3 Prior Art
1.3.1 Previous Work on PV System Optimization
Previous work in the field of PV system optimization has focused on optimal power system sizing through simulation of electrical loads, power management, and PV power generation. Cost-optimized PV power systems for various applications have been studied and tested [16] [17] [18] [19] [20]. The techno-economic optimization of a PV power system for water pumping in Antalya, Turkey was studied by Olcan et al [16]. The optimization was dual-objective and focused on minimizing the deficiency of power supply probability (DPSP) and the life-cycle costs. This study used a similar method of operating flexibly and using a water storage tank as buffer. However, the benefit of the flexible schedule was not characterized, and the pumping load was fixed. The optimal sizing of a different PV water pumping system with water storage for remote villages in Algeria was also investigated in Bakelli et al [17].
In Bilton et al [21], an optimization was used to determine the most economical off-grid reverse osmosis (RO) desalination system sizing considering PV, wind, and diesel energy sources, as well as the sizing of the RO system and water storage. Flexible operation and load sizing are intrinsic to this analysis as well as the work of others seeking to optimize off-grid RO powered by multiple energy sources, but the benefits of flexible scheduling and load sizing for PV have not been characterized [21] [22] [23] [24]. A PV-wind-fuel cell RO unit was optimized in Smaoui et
al, but the benefits of load scheduling were also not investigated [22].
Habib et al [25] optimized the sizing of the PV power system as well as the sizing and scheduling of electrical loads in a microgrid. The purpose of that work was to maximize solar energy utilization by scheduling loads accordingly. That approach, while in some respects similar to the work presented here, focused on the scheduling of multiple loads in the microgrid setting, rather than the optimization of a single PV-powered load. Load scheduling for a PV-powered microgrid was also investigated by Jaramillo et al [26]. The effect of temporal resolution on the
sizing of an optimized PV-battery system has also been investigated previously [27]. 1.3.2 Previous Work on PV-Powered Desalination System Design
pilots have also been conducted. In 1987, Adiga et. al. [28] completed a pilot PV-ED project with a production rate of 0.12 m3/hr in the Thar Desert. However, the water was only desalinated from 5,000 mg/L to 1,000 mg/L, well above the 500 mg/L drinking water requirement. Because of the low charging and storage efficiency of batteries at the time, and associated high cost of a suitably sized PV system, batteries were omitted and the PV-ED system was designed to exclusively operate during daylight hours (8:30AM - 4:30PM). In the same year, Kuroda et al. [29] designed and constructed a batch mode PV-ED seawater desalination system in Nagasaki where they produced 2-5 m3 of drinking water daily and aimed to optimize the system by matching its power consumption to the power generation of the PV panels. A few years later, Soma et al. [30] constructed a similar PV-ED system for brackish water desalination, and monitored the seasonal variation of water production. Both systems were motivated by the desire to reduce the cost of PV-ED desalination, but the tests were conducted about thirty years ago, produced water of a higher salinity than our targets for an Indian village, and listed no concrete cost values. Additionally, advancements in PV and battery technology have enabled different PV-ED configurations and at lower costs than what was previously achievable.
Cost optimization of PV-powered reverse osmosis (RO) desalination systems is a related area of research. Bilton et al. [31] investigated the impacts of location-specific environmental and demand parameters on the optimal design of modular PV-RO desalination systems using genetic algorithms. Bilton et al. [32] have also worked extensively on examining energy generation methods considering not only PV, but also wind turbines and diesel generators, and optimizing them together with RO systems to determine a high-reliability system configuration with the lowest lifecycle cost. The work presented in this thesis has similar goals in optimizing for minimal system cost while achieving high reliability of off-grid desalination systems in underserved communities. However, the performance and costs of components such as solar panels and batteries are generalized, rather than picking specific components from an inventory. Furthermore, this optimization analysis is focused on a single location, and the pilot system was designed and built to evaluate its performance in the field. Nonetheless, the approach presented here can be generalized for other applications.
While much work has been done to understand the process of ED, it has mostly been limited to the laboratory in recent years. The field-tested Thar Desert and Nagasaki systems are
similar to the work presented here in that they were both motivated by reducing the cost of PV-ED desalination, but the tests were done about thirty years ago, produced a smaller volume of water at a higher salinity than our targets for an Indian village, and listed no concrete cost values. Additionally, advancements in PV and battery technology have enabled different PV-ED configurations at lower cost than what was achievable previously.
1.3.3 Objectives and Scope
This thesis presents the benefits of flexible operation and optimal load sizing of a generalized off-grid, PV-powered process producing an accumulable output, as well as the application of these ideas to a field-tested PV-EDR desalination system. Here, the term "flexible operation" refers to process insensitivity to operating schedule, while "optimal load sizing" is the ability to design the load to operate at different power levels that complete the desired task over a corresponding duration.
This thesis presents the parametric theory to design a cost-minimized constant voltage and pumping power PV-EDR system that can be built from off-the-shelf parts. We used GE Water's electrodialysis stack Model Number AQ3-1-2-50/35, which was previously studied, modeled and tested by Wright et al. [13], and was readily available for this work. We chose to operate with constant voltage and constant pumping power to match the way in which ED is conventionally run, and we used off-the-shelf parts, current cost estimates, and current performance estimates to establish a baseline for what is currently possible to build. We can use the findings from a PV-EDR system with these characteristics to understand the cost sensitivities and decide where future research should be focused to enable further cost reductions. The theory, observations, and results from this work will aid engineers in designing cost-effective PV-powered systems for other size scales and contexts.
For the PV-EDR pilot, we designed, installed, and tested a low-cost PV-EDR system composed of off-the-shelf components to meet the drinking water needs of Chelluru, a village near Hyderabad, India. Chelluru was selected for the PV-EDR pilot test because it has a characteristic village size between 2,000 and 5,000 people, a groundwater salinity of 1,600 mg/L (within the typical Indian range of 1,000-2,000 mg/L and well-suited for ED compared to RO), and has been operating a grid-connected RO system which can be compared head-to-head with our off-grid
300 mg/L drinking water. This production rate was based on the median Indian village water consumption (10 m3 per day), and the TDS level of 300 mg/L was selected for increased palatability, well below the Bureau of Indian Standards for Drinking Water recommendation of 500 mg/L.
1.4 Approach
In this thesis, I investigate the sensitivities and tradeoffs of PV-powered systems and apply the leamings to design, install, and test an off-grid, village-scale, cost-optimized PV-EDR desalination system for Chelluru, India. I show that allowing for flexible system operation-as opposed to continuous non-intermittent operation-can further reduce the overall cost of PV-powered systems, by partially accommodating the natural time-variance of PV power [33]. System cost can be reduced by decreasing the required storage capacity and PV array size. I also explore the cost reductions enabled by flexible load sizing, or the design of the electrical load to operate over an optimal time period, to accommodate the diurnal and intermittent nature of solar energy.
To design the PV power system, I use local solar irradiance and temperature data from 2014 [34], a PV efficiency model, and an energy flow calculation. I also assess the tradeoffs between quantity of PV, batteries, and water storage to provide 100% output reliability for the 2014 reference year. I apply the concepts of flexible operation and load sizing to a theoretical reference PV-powered system to analyze the cost reductions enabled by these techniques.
I couple the PV power system model to an electrodialysis reversal (EDR) desalination model which considers various configurations of EDR components and input water salinities and produces the desalination power profiles and water output. The comprehensive PV-EDR model is coupled to a particle swarm optimization (PSO) which I use to determine the lowest-cost PV-EDR design that can meet the village drinking water needs. I also investigate the sensitivities of the PV-EDR system cost to changes in component cost and output reliability.
Through a cost-driven analysis, I demonstrate the cost-reduction benefits of (1) accommodating reasonable flexibility in the time-variance of system output, and (2) co-designing the electrical load with the PV power system such that the electrical load is well-suited to the PV power source. I demonstrate that flexible operation enables a power system cost reduction of 39%
for a reference system operating 8 hours per day at 1 kilowatt, while designing the electrical load to operate for an optimal period of time enables an additional power system cost reduction of 5%. For the desalination system, a power system cost reduction of 57.5% is made possible when sizing the desalination load to better overlap with the PV power source compared to the cost-optimized system described in Chapter 3.
Finally, I describe the design and field testing of the PV-EDR system in Chelluru, and use the experimental results to validate and tune my model. I use these learnings to recommend future work in PV-powered system design generally, as well as PV-EDR design specifically.
1.5 Structure of Thesis
In Chapter Two, I discuss the theory behind PV-powered systems and the energy analysis associated with the PV power output, battery energy storage, and power used by the electrical load. I also introduce the theoretical reference system and the product storage medium, and detail the physical process of EDR desalination in the context of its impact on system design. In Chapter Three, I describe the EDR model and its constitutive parts, as well as the PV-EDR system optimization performed to design the Chelluru village pilot, and the sensitivities of the optimized design to output reliability and individual component costs. In Chapter Four, I discuss the advantages of operation flexibility and load sizing for the theoretical reference system and the PV-EDR system. In Chapter Five, I present the results of the field-tested PV-PV-EDR system and their implications for the model and design approach presented in this thesis. Finally, a discussion of the learnings and recommendations for future work are detailed in Chapter Six.
CHAPTER
2
THEORY
A solar-powered system with accumulable output is any system in which an electrical load is powered by PV to produce an output that can be stored. The relevant example discussed in this work is desalination, which produces storable drinking water as accumulable output. Other processes for which the same approach could be used include pumped water, drip irrigation, or any other process that uses energy to transform an input into a product and is indifferent to the time of day in which it is operated. In this chapter, I introduce a theoretical reference system and a PV-EDR system, and present the theory required to develop my power system and PV-EDR models.
2.1 Solar-Powered Systems with Accumulable Output
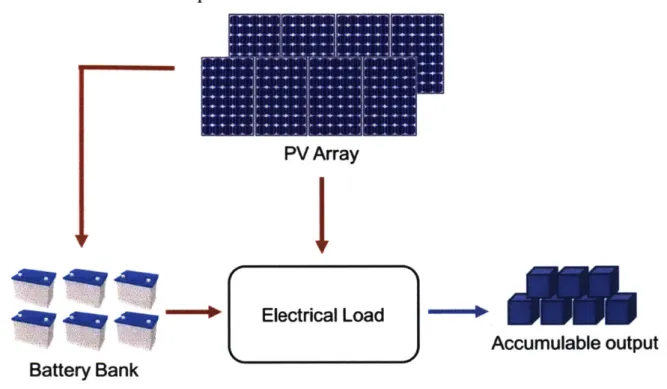
2.1.1 The Theoretical Reference SystemAs a reference system, we consider a design consisting of a 1 kW electrical load, producing an arbitrary accumulable output while operating 8 hours per day from 8am to 4pm; a PV array; and a battery bank (Figure 2). The PV array supplies power to the electrical load and the battery bank depending on the demands of each and the solar power available, and the electrical load produces an accumulable output that can be stored.
PV Array
"W"""W""2 Electrical Load """'""
Accumulable output Battery Bank
Figure 2. The Theoretical Reference System
The theoretical reference system consisting of a 1 kW electrical load producing an accumulable output from 8 am to 4 pm daily; a PV array; and a battery bank. The PV array powers the load directly and charges the battery if possible when the sun is shining. During times of low sunlight,
the batteries power the load.
2.1.2 Energy Analysis
The power production of the PV array and the power usage of the electrical load were used to determine the sizing of the battery bank through an energy analysis. In this section, I describe
how the PV power output was calculated, and given an electrical load power profile, I explain how the energy storage requirement is calculated.
Solar irradiance and temperature data for the region of Chelluru, India, in the year 2014 was used as a reference year's weather data throughout this thesis. This is semi-empirical satellite-based data from NSRDB [34]. The efficiency of the solar panels at each time interval, ?7py, was calculated using Equation ( 1 ),
rjPV(t) = TIPV nom " (1 i ap ' (Tamb(t) + k -GHI(t) - Tstd)), (1)
where 1
JPV,nom is the nominal efficiency of the panels (15%), ap is the temperature coefficient
(ap = -0.42% [35]), Tamb(t) is the ambient temperature, k is the Ross coefficient, which relates
irradiance to module temperature (k = 0.025 0C m2/W [36]), GHI(t) is the global horizontal irradiance, and Tstd is the standard testing temperature (25 Celsius). The power produced by one square meter of PV, Ppv,1m, was calculated by multiplying the instantaneous PV efficiency, 1pv, by the instantaneous global horizontal irradiance GHI(t). The PV array power output, PPv, is
simply the product of Ppv,1m and the area of the PV array, ApV.
The energy stored in the battery bank during charging was calculated according to Equation
(2 ), and the energy stored during discharging was calculated according to Equation ( 3),
Estored(t) = Estored(t - 1) + tint (PpV(t) Pload(t) Tlbatt, and (2)
11conv
Estored(t) = Estored(t - 1) - tict (PIoad(t) - )3)
where Estored is the energy stored in the batteries, tint is the interval length in seconds (300 seconds in this analysis), P1oad is the power being consumed by the load, icony is the efficiency of the
power converter, and 7lbatt is the battery charge/discharge efficiency (85%) [38]. Temperature effects were not considered in the battery operation, which is suitable for this PV-EDR system because the battery bank is stored indoors.
2.2
Relationship Between PV and Batteries
To understand the relationship between PV and batteries, I utilized the theoretical reference system of Figure 2, with a constant 1 kW power consumption from 8am to 4pm. I used solar irradiance and temperature data from Chelluru for 2014 as an input to the energy calculations. The
2
costs of PV panels and batteries used in this analysis are $98 per m and $150 per kWh, respectively, which are characteristic costs in India for multicrystalline silicon PV panels and lead acid batteries [39]. As a first-order constraint, the amount of PV panels must be enough to produce the total amount of energy required to desalinate water over the yearly cycle. This minimum PV area, Apv,min, can be found by taking the total energy required to desalinate a year's worth of water and dividing by the energy producible by 1 square meter of PV panels in a characteristic year.
Apmmin corresponds to a design with the highest storage requirements, as all energy that is
produced and not instantaneously used must be stored to ensure its use at a later time. By increasing the PV area beyond this theoretical minimum, the energy storage requirements can be reduced.
The energy storage required for 100% output reliability was found by simulating the energy stored over the course of the entire reference year according to Equations ( 2 ) and ( 3), as plotted in Figure 3. As the PV area is increased beyond the minimum (11 Im2
), the battery capacity required to buffer for intermittencies decreases [37]. All points along the curve in Figure 3 (b) correspond to designs with equivalent output in the reference year.
100 -11 M 100 -12 m E -14 m 75 20 m 75 26 m2 50 50 C CM. 0 0 120 240 360 10 15 20 25 30
Day of the year APV (in 2
(a) (b)
Figure 3. Relationship between PV Area and Battery Capacity
The energy stored for systems with various PV area over the course of the reference year; (b) the battery capacity requirement for each value of PV area. As PV area is increased beyond
the minimum acceptable value, the energy storage requirement decreases.
There is a minimum-cost combination of PV panels and batteries that can supply the 8-hour, 1 kW fixed operating schedule reference system. This minimum-cost point lies on the curve represented in Figure 3 (b) and Figure 4, and its value (indicated by the red ring in Figure 4) depends on the ratio of the cost of batteries and the cost of PV. The curve represents a 100% output reliability for the reference year, i.e. production demands are perfectly met given the reference year's solar irradiance data. Alternatively, the curve also represents a loss of power supply probability (LPSP) of 0, where LPSP is defined as the average fraction of time that the load that is not supplied by the PV system [40]. In this analysis, the LPSP is calculated relative to a single reference year, 2014 weather data for Chelluru, India. In the figure, the parallel lines represent constant power system cost (PV plus batteries), where their slope is the ratio of energy storage cost per kWh to PV cost per square meter, and cost increases as the quantity of batteries and PV increases (toward the upper-right corner of the plot). If the ratio of energy storage and PV cost shifts, then the ratio of energy storage and PV area in the lowest-cost design would shift along the
constant output reliability curve. The region above the 100% output reliability curve corresponds to overdesigned power systems which produce more than the required output over the course of the reference year, and the region below the curve corresponds to unreliable systems that do not produce the adequate output throughout the reference year.
~60. CL0 240. 0 __ 10 $13,162 $11,062 $8,962 $6,862 re~abie$4,762 15 20 25 APV (in2)
Figure 4. 100% Output Reliability Curve
Locus of power system designs (PV plus batteries) that can provide 100% output reliability in the reference year. Above and to the right of the curve are overdesigned systems which provide
excess output, and below and to the left of the curve are designs that do not provide adequate output over the course of the reference year. The diagonal lines represent constant cost power systems, and their slope is determined by the ratio of battery cost to PV panel cost. The lowest
intersection point on the locus of power system designs in the direction orthogonal to the constant cost lines corresponds to the lowest-cost power system [37].
2.3 Energy Storage and Product Storage
For processes producing an accumulable output, storage of the output can serve as a secondary storage medium to energy storage in batteries. This can be done when the load is operated on a flexible schedule determined by the solar energy available, as described in the results section. Under certain conditions, utilizing product storage in addition to energy storage can allow
for system cost reductions, as will be described in Chapter 4: Advantages of Operation Flexibility and Load Sizing.
In realistic scenarios, there may also be a volume constraint on the amount of product that can be stored at one time. For example, the village PV-EDR system was constrained to a small plot of land with only enough space for an additional 10 m3 water storage tank. For this reason,
the product storage was constrained to 10 in3, despite additional cost savings that were possible with a larger water storage tank.
2.4 EDR Behavior
The models used for predicting the performance and behavior of batch electrodialysis systems in this work have been developed and validated by Wright et al. [41] [42]. While it is suggested that the reader review Wright [41], Ortiz [43], Strathmann [44], and Tanaka [45] for a more complete understanding of the electrodialysis process, a brief summary of the general concept is provided here to highlight its relevance to the overall optimization of the PV-EDR system.
2.4.1 EDR Stack Architecture
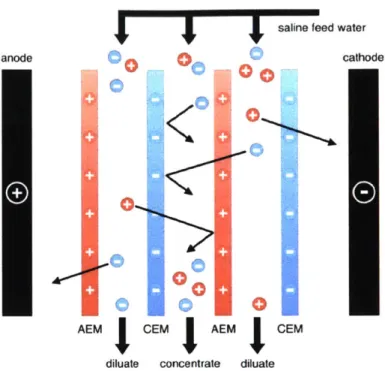
The EDR subsystem consists of the ED stack, pumps, and water storage and recirculation tanks. The ED stack is composed of cell pairs that are sandwiched between two electrodes, where a cell pair consists of an anion exchange membrane (AEM), a spacer for water flow, a cation exchange membrane (CEM), and another spacer (Figure 5). For this work, the ED stack used was manufactured by GE Water (Model Number AQ3-1-2-50/35). For batch mode, there are two recirculation tanks, for concentrate and diluate respectively, and the water in these tanks is recirculated through the ED stack continuously until the desired salinity is reached. Manual ball valves control the reversal of the streams between batches.
00
00
0
K
AEM CEM AEMdiluate concentrate
saline feed water
cathode
0
010
I CEM
diluate
Figure 5. Electrodialysis Process
Electrodialysis separates salts from water through the application of an electric potential across a series of alternating anion and cation exchange membranes (AEM, CEM).
2.4.2 Mass Transfer
The mass transfer of ions from one stream to another was modeled using Ohm's law. The electric potential is the voltage applied across the ED stack, the current is the ion movement, and the resistance is the electrical resistance of the membranes and the streams. Throughout an EDR batch, the current moves ions from the diluate stream into the concentrate stream, producing a concentration profile as shown in Figure 6. Assuming equally-sized and equal numbers of concentrate and diluate channels and assuming perfect mixing, the changes in concentration can be calculated using the mass balance equations ( 4 ) and ( 5 ) for the concentrate and diluate streams, respectively (Ortiz 2006):
dCconc - NkpI NkADa(C Cl) wac NkADc(C%cc- C ( 4)
N dVk dt QconcCone - QconcCconc + zF la IC
d~~d(Cw c-__ Cwa) Nkc(CWC -1 CW)
NkVk - QdilCdil - QdilCdil - Nkcpl + NkADa ( C on l5)
dtzF la + C
where Nk is the number of cell pairs, Vk is the volume of the streams (m3), Cconc, Cl, Cconc, Cdil
are the concentrations of the concentrate and diluate streams at the inlet and outlet of the electrodialysis stack (mol/m3) respectively,
Qco,,c
and Qdj1 are the volumetric flow rates (m3/hour),p is the current efficiency, I is the current (A), z is the charge of the ion, F is the Faraday constant,
A is the active membrane area (M2
), Da and Dc are the average diffusion coefficients (in2/S) of
NaCl in the anion and cation exchange membranes, respectively, 1a and lc are the thicknesses (in) of the anion and cation exchange membranes, respectively, t is the time (s), and C " c, Ca,
Cdf are the concentrations (mol/m3) on the surface of the anion and cation exchange membranes at the boundaries of the concentrate and diluate streams, respectively. These terms in the equation represent flow of ions at the inlet and outlet of the channels, the ion flow due to the current, and the diffusion of ions across the membranes due to the concentration gradient between the concentrate and diluate streams, respectively.
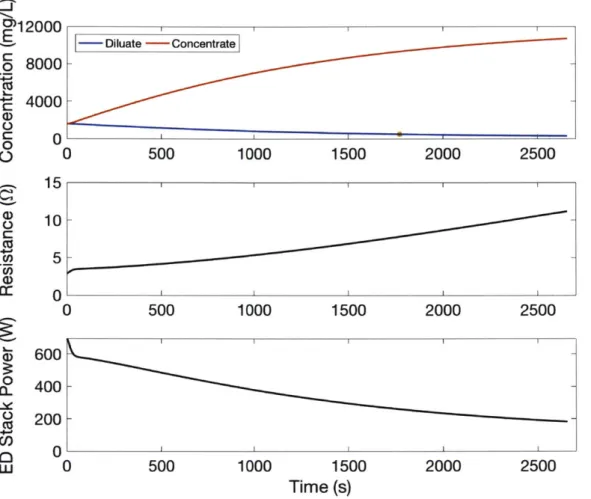
As the concentrations of the concentrate and diluate streams change, their electrical resistances change. Due to the nonlinear relationship between resistivity and ion concentration, the diluate channels become the dominant resistance in the circuit, increasing electrical resistance overall. During a batch process at constant voltage, this increasing resistance causes a decrease in current over time, slowing the desalination process of removing ions from the diluate stream. This causes the electrical power over the course of a batch to decrease proportionally with the current (Figure 6).
012000 - Diluate -Concentrate o 8000- 4000-0 0 o 0 500 1000 1500 2000 2500 15 10-CO C) 5 Cr 0 0 500 1000 1500 2000 2500 600 0o 400-0
200-o
w 0 500 1000 1500 2000 2500 Time (s)Figure 6: Concentration, Resistance, and Power Over a Single EDR batch.
As the diluate stream becomes less concentrated over the course of a batch, the stack resistance increases, reducing the current and causing the stack power to decrease.
2.4.3 Limiting Current Density
If the applied voltage is too high, then at some point during the batch desalination process
the ion concentration at the membrane surfaces in the diluate channels approaches zero. The condition during which this occurs is called limiting current density, which can result in electrolysis of the water molecules, causing harmful production of hydrogen gas and increased pH levels of the desalinated water. The EDR unit should be designed as to avoid reaching limiting current density at any point during the batch process. The limiting current density ilm [A/m2] is estimated using Equation
lIim - Cdi Tmem-tZFk , (6)
where Cblk is the concentration of the bulk diluate solution, t is the transport number of the ion in the bulk solution, and Tmem is the transport number of the ion in the membrane. The boundary-layer mass transfer coefficient [m/s], k, increases with the linear flow velocity in the channels, causing a proportional increase in the limiting current density. In this analysis, the flow channels, membrane geometry and linear flow velocity are held constant. Holding these factors constant means that the limiting current density varies only with Cblk which decreases over the course of the desalination process, and also that the pressure losses due to flow through the channels are constant.
2.4.4 EDR Design Considerations
For the purposes of this work, we are primarily concerned with desalinated water production rate and power profiles for the entire desalination process, which are the key factors that drive system cost and the value derived by the user. Desalination rate can be varied by changing (1) the applied voltage across the EDR stack and (2) the number of cell pairs, which effectively changes the number of channels and thus the volumetric flow rate, assuming a constant linear velocity through each channel. The range of optimal linear velocities for the spacers in our ED stack was 6-12 cm/s. Because pressure drop per unit length of the spacer exhibits quadratic growth with increasing linear flow rate, we chose to design our system to run at 6 cm/s primarily because it requires less pumping power per unit of flow rate. Additionally, lower linear flow rates are correlated with greater salt removal per unit length of spacer, which is beneficial for effective desalination [46].
The energy and power profiles are also affected by the desalination rate, as increasing the number of cell pairs and the applied voltage requires more power but only produces small differences in the total energy required per volume of clean drinking water. Due to the constant linear flow rate through the channels, the pumping power and energy is proportional to the number
of cell pairs, as the pressure drop remains constant while the total volumetric flow rate increases proportionally with the number of cell pairs.
The applied voltage must be high enough to produce water with the desired TDS level such that 10 m3 of desalinated water are produced within 24 hours. However, the applied voltage must not be so high that the limiting current density is reached during the desalination process. The maximum number of cell pairs for this study was limited to 170, which is the number of cell pairs available in a fully assembled GE Water ED stack. The recovery ratio, defined as the ratio of diluate water output to feed water input, was chosen to be 90%.
CHAPTER
3
DEVELOPMENT OF A
PV-EDR
MODEL
A PV-EDR model was developed using the theory of Chapter 2 to demonstrate the application of powered system design principles, to inform the design of cost-minimized PV-EDR systems for any location, and to specifically optimize the off-grid, village-scale PV-PV-EDR system for Chelluru. This model is composed of four modules: the EDR module, the pump module, the power system module, and the cost module. It was designed to take location-specific
parameters and specified values of design variables as inputs, and produce a system capital cost and output reliability for the specific design (Figure 7). When coupled to an optimization routine, the design variable inputs to the PV-EDR model are varied until a design with acceptable output reliability and minimum capital cost is reached.
Parameters
TDSi,, TDSut, GHI(t), T(t), ipvnom
Design Variables
Nc, VEDRVbatd
-Apv. Ebattp Vtank
EDR module ---- * + p
ERW
Pump module Power system 1 _ module "pump MpumpCost module
System capital costI
Reliability =No. of days demand is met
Total no. of days
Figure 7. Flowchart of the PV-EDR Simulation
Flowchart of the PV-EDR simulation, where TDS. is the input salinity, TDS.t is the output salinity, GHI is the global horizontal irradiance, T is temperature, r7pv,nom is the nominal PV efficiency, Ncp is the number of cell pairs, VEDR is the stack voltage, Vbatch is the batch volume,
Apv is the area of the PV array, Ebatt is the battery capacity, Vank is the water storage tank volume,
Q
is the flow rate, p is the pressure, PEDR is the power required for EDR over a batch, Ppump is thepumping power, and Mpump is the pump model.
3.1 The EDR Module
The EDR module simulates the water desalination process. To do so, it takes the feed water salinity (TDSiu), desired output water salinity (TDSut), and desired average daily water production as fixed inputs, and the number of cell pairs (Ncp), applied stack voltage (VEDR), and batch size (Vbatch) as design variables. The module then calculates and outputs the batch time, water desalination rate, power profile (PEDR), the percentage of time that limiting current density was exceeded, and the flow rate and pressure required of the pumps. A design fails in the EDR module if the limiting current density is exceeded, or if the desired salinity of the batch is not reached in sufficient time to allow the daily water production to be achievable.
3.2 The Pump Selection Module
Based on the flow and pressure requirements of the ED system, an optimal pump must be chosen based on cost, ability to provide the necessary flow and pressure, and nominal power draw. A database was created from which to select specific pump models due to a poor correlation between pump performance metrics and cost.
The pump selection module takes the system curve as well as the desired pressure and flow rate of the EDR system as inputs. These are compared to the pump curves of the pumps in the database. The intersection points represent the expected actual operating point of the pump. To evaluate the quality of choice of the pump, the pump selection metric (PSM) of Equation ( 7 ) which includes pump cost, power draw, and the difference between the flow rate at the intersection to the desired flow rate was used,
PSM = Cpump + 3 -Ppump + 750 - IQdesired - Qactual 1 (7) The coefficients of each of the comparison metrics of cost, power draw and flow rate difference were chosen to give a cost-like comparison. The cost coefficient is 1 because it serves as a baseline against which the other coefficients are compared. For power, the coefficient is 3 because it is estimated that a small microgrid costs $3/W [47], allowing a direct addition to the cost metric contribution. Finally, the flow coefficient of 750 was determined through numerical
unlikely to exceed 0. I m3 /hour. The pump in the database with the lowest PSM value for the desired flow rate and pressure is chosen for the design.
3.3 The Power System Module
Solar is an intermittent power source that varies on daily and seasonal scales. A PV-powered system must have the energy storage capacity to provide the required power to the load despite fluctuations on the daily scale (such as clouds and nighttime operation) and variations on the yearly scale, such as lower solar irradiance during the winter season. A combination of PV panels and batteries can meet the power supply profile of an electrical load. The optimal sizing of the PV array and battery pack depends on location-specific weather data, the power profile of the load, and the relative cost of PV and batteries.
The power system module uses time-resolved solar irradiance GHI(t), time resolved temperature data T(t), and nominal PV efficiency r1pV,nom as parameter inputs to Equation ( 1 ) to calculate actual PV efficiency rlpv(t). Design-specific values of PV array area (Apv), battery capacity (Ebatt), and water storage tank volume (Vtank), as well as the power profiles of the EDR unit (PEDR(t)) and pump (Ppump (t)) are fed into the module. The energy flows into and out of the
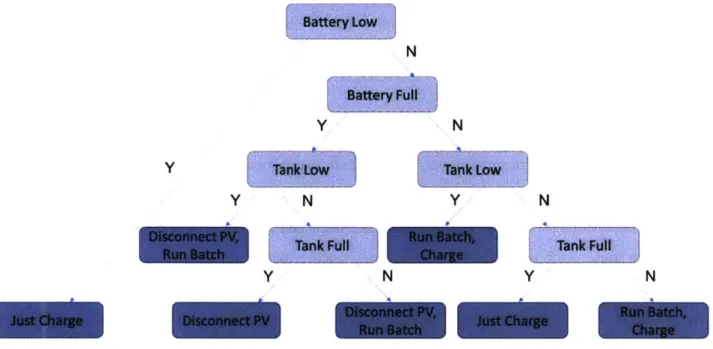
batteries and the water flows into and out of the water storage tanks are simulated over the reference year period, and an output reliability corresponding to the percentage of days of the year for which water supply meets demand is produced. The simulation will run a batch and charge the batteries according to the logic tree of Figure 8. Within the simulation, the batteries are never allowed to drop below 50%, a value selected to prolong battery lifetime.
Battery Low
N
Battery Full
Y N
Y Tank Low Tank Low
Y N Y N
isconnect PV, Run Batch, T
Run Batch Charge
Y N Y N
isco nnet PY, Run Batch,
Just Charge Disconnect PV nust. Charge
Run Batch ch
Figure 8. Power System Logic Tree
Logic tree for the power system module, detailing the conditions for charging the batteries and running an EDR batch.
3.4 The Cost Module
The cost module calculates the cost of the PV-EDR system based on the design variables and the selected pump according to Equation ( 8 ),
Csy, = CpvApv + CbattEbatt + CtankVtank + CcpNcp + 2Celec + 2Cpump9
(8) where Cy, is the system capital cost; CPy, Cbatt, Ctank, CCp, Celec, and Cpump, are the cost of the PV array, battery bank, water storage tank, membrane cell pairs, electrodes, and pumps
respectively; and ApV is the area of the PV array, Ebatt is the battery capacity, Vtank is the water storage tank volume, and Ncp is the number of membrane cell pairs. An inverter suitable for the optimized power system and EDR and pumping loads is selected retroactively and added to the total system cost.
3.5 PV-EDR Coupled Behavior
Just as the power production of the PV system (energy production and energy storage) can be tuned by the sizing of the panels and batteries, the power consumption of the ED system can be tuned by selecting the quantity of membrane cell pairs, operating voltage, batch size, tank size, and pump model. By jointly adjusting power production and power consumption, the power profiles can be matched in such a way as to optimize the overall system for minimum cost.
Harvested energy can be (1) stored in batteries for later use or (2) used immediately for desalination, storing the excess water in tanks to meet customer demand at times of low or no sunshine. Incorporating water storage tanks as a secondary storage medium to batteries can reduce the energy storage requirement for the system, and a combination of both storage tanks and batteries can enable a minimum-cost design. Due to the coupled nature of the PV and EDR subsystems, it is nontrivial to determine what configuration of the EDR stack, pump models, and quantities of PV panels, batteries, and water storage tanks will result in the lowest capital cost system, and a full-factorial study would be time-consuming and inefficient. Coupling an optimizer algorithm with the PV-EDR performance models can efficiently determine the cost-optimal or near-cost-optimal combination of these components and the accompanying operational specifications for any location.
3.6 PV-EDR Simulation
The performance of a PV-EDR design over a reference year was simulated in Matlab. The input parameters for the simulation (Table 1) are specific to the water quality and needs of Chelluru, and mirror the groundwater salinities and water consumption patterns of a typical Indian village. The solar irradiance and temperature data used for all simulations was obtained from the National Solar Radiation Database (NSRDB) SUNY database for the village of Chelluru, India, in 2014, and interpolated to 5-minute intervals [34]. All references to water production reliability are defined as the percentage of days that the simulation predicted the system would be able to provide the needed quantity of water under the weather conditions of the 2014 reference year. The water collection model assumes 0.25 m3 of water is collected instantaneously every 15 minutes over the course of 10 hours during the day, resulting in 10 m3per day, assuming no seasonal variability. In
future work, measured seasonally-varying demand patterns will serve as input to the simulation for greater accuracy.
Parameter Symbol Value
Input TDS TDSin 1,600 mg/L
Output TDS TDSOUt 300 mg/L
Daily water production Vprod 10 m3
Water production reliability rreq 100%
Solar irradiance GHI(t) 2014 GHI data for Chelluru
Ambient temperature T(t) 2014 data for Chelluru
Nominal PV efficiency 1
7pv,nom 15%
Table 1. PV-EDR Input Parameters
Input parameters for the PV-EDR simulation, specific to conditions at the Chelluru test site.
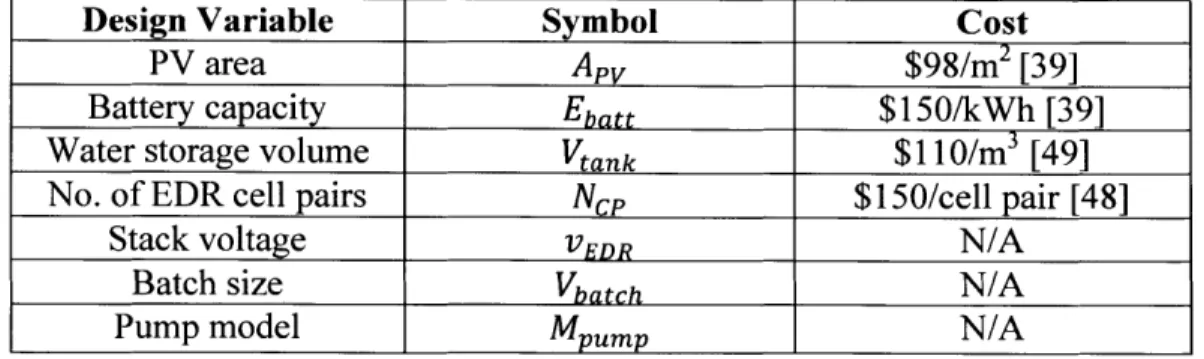
A PV-EDR design was characterized as a combination of the design variables listed in Table 2. The cost of PV, batteries, and water storage were all determined based on local or commonly used component costs. The cost of EDR cell pairs is based on the estimated membrane cost based on supplier quotations for the GE Model Number AQ3-1-2-50/35 ED stack [48].
Design Variable Symbol Cost
PV area Apy $98/M2 [39]
Battery capacity Ebatt $150/kWh [39]
Water storage volume Vtank $11 0/m3 [49]
No. of EDR cell pairs NCP $150/cell pair [48]
Stack voltage VEDR N/A
Batch size Vbatch N/A
Pump model M_ uP N/A
Table 2. PV-EDR Design Variables
3.7 Optimization
3.7.1 Particle Swarm Optimization
Particle swarm optimization (PSO) is a heuristic optimization approach that iteratively adjusts a population of randomly selected designs (comprised of a defined set of design variables) based on their performance to an objective function [50]. It was selected for this application because of its suitability to searching a complex design space using stochastic methods, and the simplicity of implementation. It was straightforward to couple the PSO algorithm to the PV-EDR simulation.
3.7.2 The Optimized PV-EDR System
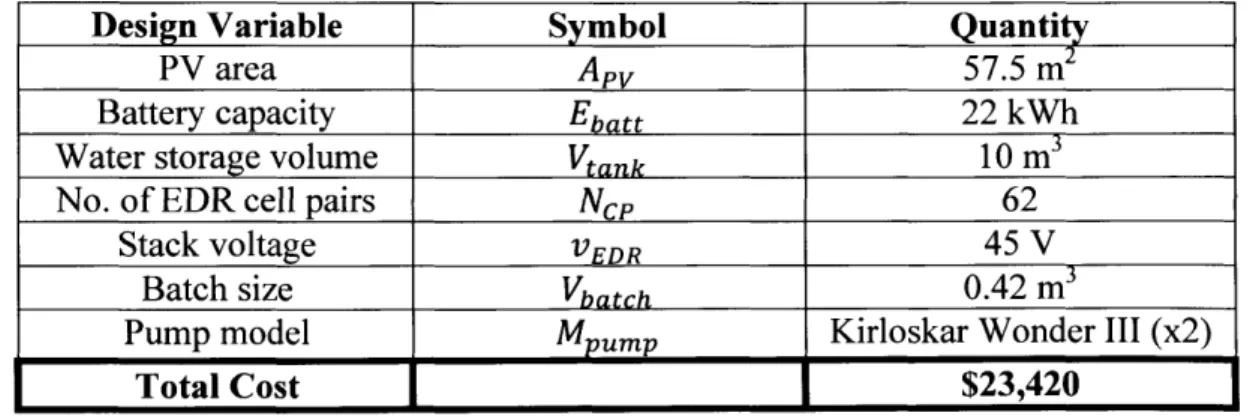
PSO was used to determine a cost-optimal PV-EDR design for any given set of parameters and design variables [50]. Due to the stochastic nature of PSO, the optimization converged to a different solution every time it was run. To identify the likely global minimum solution, the optimization was run several times to identify the most promising region of the design space, and was then constrained to exclusively search that narrowed region of the design space to find the cost-minimum design. Table 3 shows the results of the PV-EDR optimization for the Chelluru village system, and the cost breakdown of components is shown in Figure 10.
Design Variable Symbol
Quantit
PV area Apv 57.5 m
Battery capacity Ebatt 22 kvh
Water storage volume Vtank 10 M,
No. of EDR cell pairs NCP 62
Stack voltage VEDR 45 V
Batch size Vbatch 0.42 m3
Pump model MPUMP Kirloskar Wonder III (x2)
Total Cost $23,420
Table 3. Optimized PV-EDR System Design Variables
The simulated performance of the optimized PV-EDR design over the reference year is shown in Figure 9. To sustain a long operating lifetime of the batteries, the maximum depth of discharge allowed was set to 50%. During times of low sunshine when the battery was depleted to that level, the water stored in the tank would be used to meet consumer demand, serving as a buffer until the batteries could regain charge. This mode of operation was designed to allow the system to provide the daily water requirement of 10 m3 either through direct production or by drawing
from storage tank reserves.
20 15 10 10 E C 5 II I I I I I 0 50 100 150 200 250 300 350
I
jr
-50 100 150 200Day of the year
Figure 9. Simulated Battery Charge and Tank Fill Level for the Optimized PV-EDR System
Simulation of the battery charge level and tank fill level for the optimized PV-EDR design during the reference year.
0
0 250 300 350