Preparation of metallosupramolecular single-chain polymeric
nanoparticles and their characterization by Taylor dispersion
Electronic Supplementary Information
Laura N. Neumann,
aDominic A. Urban,
aPhilipp Lemal,
aSushila Ramani,
aAlke Petri-Fink,
aSandor Balog,
aChristoph Weder,
aStephen Schrettl*
aa
Adolphe Merkle Institute (AMI),
University of Fribourg
Chemin des Verdiers 4,
1700 Fribourg, Switzerland
Table of Contents
1.1
Supplementary Figures S1–S9 ... 3
1.2
Experimental Details ... 9
1.2.1
Instrumentation and Methods ... 9
1.2.2
Materials and Methods ... 11
1.2.3
Synthetic Procedures and Analytical Data ... 12
1.3
NMR Spectra ... 15
1.4
References ... 19
1.1 Supplementary Figures S1–S9
Figure S1: a) Chemical structure of the 2,6-bis(1’-methylbenzimidazolyl)pyridine ligand with the 2-ethyl-hexyl substituent
(EH-Mebip) that was employed as a soluble model compound, which was prepared following previously reported literature procedures.1,2 The EH-Mebip ligand was used for UV-Vis spectrophotometric titrations to calculate the degree
of functionalization of the polymers and to confirm the full complexation of the ligands in presence of the metal-ions. b) Absorbance of EH-Mebip in CHCl3/MeCN (9:1) at 314 nm at various concentrations as determined by UV-vis spectroscopy. c) UV-vis spectra of the polymers P1 (c = 46.2 mg L–1 in THF) and P2 (c = 44.6 mg L–1 in THF). The absorbances at 314 nm
of 0.562 and 0.640, respectively, and the calibration curve shown in (b) were used to determine the concentration of ligands in the polymer samples and a corresponding degree of functionalization of 4.8 mol% for P1 and 5.8 mol% for P2 was determined.
Figure S2: UV-vis spectra recorded with solutions of the EH-Mebip model compound (left) and the poly(n-butyl
acrylate-co-Mebip acrylate) P1 with 4.8 mol% of Mebip ligand (right) before and after addition of the Fe(ClO4)2, Zn(NTf2)2, as well
as Eu(ClO4)2 metal salts, respectively. The comparison of the spectra indicates that complex formation of the ligands
occurs in the presence of an excess of the different metal salts. a) EH-Mebip with Fe(ClO4)2 (c = 25 μmol L–1 in CHCl3/MeCN
9:1). b) FeSCPN-P1 (c = 24 μmol L–1 in THF). c) EH-Mebip with Zn(NTf
2)2 (c = 20 μmol L–1 in CHCl3/MeCN 9:1). d)
ZnSCPN-P1 (c = 29 μmol L–1 in THF). e) EH-Mebip with Eu(ClO
4)2 (c = 25 μmol L–1 in CHCl3/MeCN 9:1). f) EuSCPN-P1 (c = 38 μmol L–
Figure S3: UV-vis absorption spectrum of FeSCPN-P1 (c = 24 μmol L–1 in THF) showing the main absorption band observed
upon formation of the metal-ligand complexes at ca. 355 nm. Additionally, a weaker band is observed at ca. 660 nm, which is characteristic for complexes between the Mebip ligands and Fe3+-ions.3,4
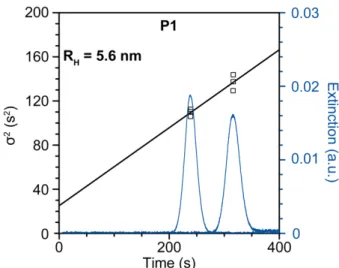
Figure S4: Taylor dispersion analysis (TDA) of the low-Mn polymer P1.
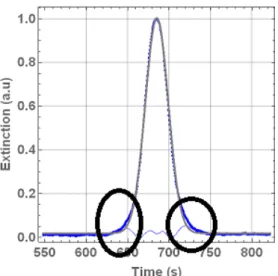
Figure S5: Example of a Taylor dispersion analysis profile that shows a second broad Gaussian distribution (highlighted
by the black circles) superimposed with the main distribution. The second broad distribution indicates the presence of a minor fraction of larger (multi-chain) aggregates in the particle dispersions, but does not impede the analysis of the sizes of the predominantly formed single chain polymer nanoparticles.
Figure S6: Size exclusion chromatography (SEC) traces of polymer P2 with a high number-average molar weight (black) as
well as the traces recorded from the suspensions obtained after intramolecular collapse of the polymers upon slow addition of a solution of the polymer to solutions of the different metal salts with FeSCPN-P2 (green), ZnSCPN-P2 (blue), and EuSCPN-P2 (red).
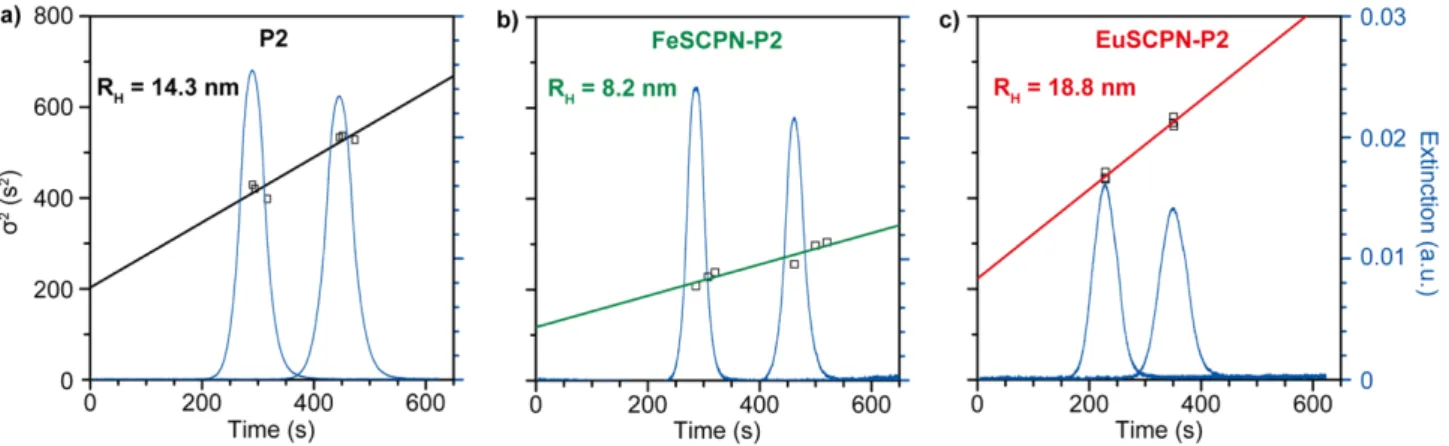
Figure S7: Taylor dispersion analysis (TDA) of (a) the high-Mn polymer P2, (b) FeSCPN-P2, and (c) EuSCPN-P2.
Figure S9: (a) AFM height image (top) and the corresponding line scans (bottom) for drop-cast samples of FeSCPN-P2.
The height profiles of the line scans corroborate the formation of particles with sizes in the range of 2–4 nm and particles with heights of up to 12 nm are observed in the micrographs of FeSCPN-P2. (b) AFM height image (top) and the corresponding line scans (bottom) for drop-cast samples of ZnSCPN-P2. The height profiles of the line scans corroborate the formation of particles with sizes in the range of 3–5 nm and particles with a height profile of up to 14 nm are observed in the micrographs.
1.2 Experimental Details
1.2.1 Instrumentation and Methods
NMR spectroscopy. Spectra were measured at 297.2 K on a Bruker Avance DPX 400 spectrometer at
frequencies of 400.19 MHz for 1H nuclei and 100.63 MHz for 13C nuclei. Spectra were calibrated to the residual
solvent peak of CDCl3 (7.26 ppm 1H NMR; 77.16 ppm 13C NMR) or DMSO-d6 (2.50 ppm 1H NMR; 39.52 ppm 13C NMR). Data were treated with the MestReNova (12.0.2) software suite and all chemical shifts δ are
reported in parts per million (ppm) with coupling constant in Hz (multiplicity: s = singlet, d = doublet, dd = double doublet, t = triplet, q = quintet, m = multiplet, br = broad signal). The integrals of the spectra of the polymers P1 and P2 were normalized for the Mebip ligand, since no end-group could be identified in the spectra.
Mass spectrometry (MS). Spectra were recorded either as service measurements at the mass spectrometry
facilities of the Institute of Chemistry of the University of Fribourg or at Molecular and Biomolecular Analysis Service (MoBiAS) of ETH Zürich. At the University of Fribourg, matrix-assisted laser desorption ionization (MALDI) mass spectra were recorded on a Bruker ultrafleXtreme using trans-2[3-(4-tert-butylphenyl)-2-methyl-2-propenylidene]malononitrile (DCTB) as the matrix. At ETH Zürich, high-resolution electrospray ionization mass spectrometry (ESI-MS) was measured on a Bruker maXis Q-TOF instrument operated in positive ionization mode.
Elemental analysis (EA). Elemental analyses (EA) were carried out on a CE Instruments EA 1110 involving flash
combustion and GC separation.
Melting points. Melting points were determined by differential scanning calorimetry (DSC) measurements
under N2 using a Mettler-Toledo STAR system operating at a heating/cooling rate of 10 °C min–1 and the
maximum of the endothermic peak in the DSC curve is given as the melting point.
UV-vis spectroscopy. Solution phase UV-Vis spectra were recorded on a Shimadzu UV-2401 PC
spectrophotometer using quartz cuvettes of 1 cm path length.
Fourier transform infrared (FT-IR) spectroscopy. Spectra were recorded using dried powder/films on a Perkin
Elmer Spectrum 65 spectrometer between 4000–600 cm–1 with a resolution of 4 cm–1 and 4 scans per sample. Size exclusion chromatography (SEC). SEC was performed in THF at a flow rate of 1.0 mL min–1 using refractive
index (λ = 658 nm, 40 °C) detection. A Polymer Laboratories 5 μm mixed-C guard column and two SEC columns along with WyattTechnology Corp. (Optilab REX interferometric refractometer, miniDawn TREOS laserphotometer) and Agilent Technologies instrumentation (series 1200 HPLC) and the Wyatt Technology
software (ASTRA) were used. Thenumber-averaged molar weight (Mn) of the polymers was calculated based
on the refractive index increment of the literature value for poly(n-butyl acrylate) dn/dc = 0.085.
Dynamic light scattering (DLS). Light scattering measurements were performed at constant temperature (20
°C) using a commercial goniometer instrument (3D LS Spectrometer, LS Instruments AG, Switzerland). The primary beam was formed by a linearly polarized and collimated laser beam (Cobolt 05-01 diode pumped solid state laser, λ = 660 nm, Pmax = 500 mW), and the scattered light was collected by single-mode optical fibres
equipped with integrated collimation optics. The collected light was coupled into two high-sensitivity APD detectors (PerkinElmer, Single Photon Counting Module), and their outputs were fed into a two-channel multiple-tau correlator. The signal-to-noise ratio was improved by cross-correlating these two channels. With respect to the primary beam, depolarized scattering was observed via cross-polarizers. The incoming laser beam passed through a Thompson polarizer with an extinction ratio of 10–6, and another Glan-Thompson polarizer, with an extinction ratio of 10–8, was mounted in front of the collection optics. Data were
collected at a scattering angle of θ = 90°.
Atomic force microscopy (AFM). The SCPN samples were diluted to a concentration of 0.5 mol L–1 and
drop-cast onto silicon wafers (Type P, LG Siltron Inc. Korea) that were pre-cleaned by consecutive extensive rinses first with isopropanol and then with THF. Imaging was performed with a NanoWizard II AFM from JPK instruments using Tap300AI-G tips (Budget Sensors) with a resonance frequency of 300 kHz and a force constant of 40 N m–1.
Taylor dispersion analysis (TDA). Time-resolved optical absorbance was followed by an ActiPix D100 UV-Vis
area imaging detector (Paraytec, York, UK) at a 20 Hz sampling rate. Samples were injected into a fused silica capillary (74.5 μm inner diameter, Polymicro Technologies, Phoenix, USA) under continuous flow conditions, using a capillary electrophoresis injection system (Prince 560 CE Autosampler, Prince Technologies B.V., Netherlands). A 280 ± 10 nm bandpass filter (Edmund Optics, York, UK) coupled with a neutral density filter (10% transmission) (Edmund Optics, York, UK) was used so that the absorbance of the dispersion was measured in the linear range of the detector throughout the measurements. The detector automatically corrects the intensity values for dark current, controlled the intensity of illumination (by a pulsed xenon lamp), and performed the background measurement on the solvent before each run. The polymer solution and the SCPNs dispersions were injected at concentrations of c(THF) = 24 μmol L–1 for FeSCPN-P1 and FeSCPN-P2, c(THF) = 29 μmol L–1 for ZnSCPN-P1, as well as c(THF) = 38 μmol L–1 for EuSCPN-P1 and EuSCPN-P2 under
continuous flow conditions and the total capillary length was 130 cm, the distances between injection and the two detection points were 37 ± 0.05 cm and 72 ± 0.05 cm with a total window length of 1 cm. The detector and capillary were placed inside of the injection system to allow for temperature regulation, which was kept constant at 25 °C. The injection volume was between 100-200 nL and all samples were measured a minimum
of three times under the same conditions. After sample injection, a pressure of 70 mbar was applied to transport SCPNs through the capillary. The duration of the pressure ramp (2 s) was negligible compared to the residence time reached at the second detection window, and not corrections were applied. To fit Gaussian functions against the experimental data (Taylorgrams), an unconstrained nonlinear model fit was used (Mathematica, Wolfram Language, Wolfram Research, Inc., Version 11.3, Champaign, IL).
1.2.2 Materials and Methods
General procedure for the preparation of SCPNs via intramolecular crosslinking through metal-ligand complexes. Extra dry, unstabilized, degassed THF (99.85%, Arcos Organics) was used for all experiments. A
polymer solution (1 mg mL–1 in THF) was added dropwise via a syringe pump over the course of 3 h to a
vigorously stirred solution of the metal salt in THF under an inert argon atmosphere. An excess of the metal salt was used in all cases and adjusted on the basis of the mol% of the ligand in the polymer solutions. For
FeSCPN-P1, a six-fold excess of the iron perchlorate salt (Fe(ClO4)2 · 6H2O) at 60 °C was used (7.21 mL, c(Fe(ClO4)2) = 1 mM in THF) and 4 mL of the solution containing P1 (1 mg mL–1 in THF) was added dropwise.
For the ZnSCPN-P1, a six-fold excess of the of zinc bistriflimide salt (Zn(NTf2)2) at 60 °C was used (4.44 mL; c(Zn(NTf2)2) = 1 mM in THF) and 4 mL of the solution containing P1 (1 mg mL–1 in THF) was added dropwise.
For EuSCPN-P1, a 1.5 fold excess of the europium perchlorate salt (Eu(ClO4)3) at room temperature (10.25 mL, c(Eu(ClO4)3) = 0.165 mM) was used and 5 mL of the solution containing P1 (1 mg mL–1 in THF) was added
dropwise. The same concentrations of polymer and metal salt solutions were used throughout and the employed volumes were adjusted in order to maintain the same metal-to-ligand ratios.
Evaluation of Taylor dispersion analysis measurements. The absorption band of the particles broadens as a
result of dispersion after subjecting the particle solution to the laminar flow through the capillary. The rate of the broadening of the absorption band is defined by the velocity profile and translational diffusion coefficient of particles.5-7 The temporal record of the band broadening observed via the absorbance of the injected
particles is the so-called TDA dispersion profiles (Taylorgram). Given the Lambert-Beer law and a linear light detector response, the dispersion profile under standard experimental conditions is essentially a Gaussian function:
𝐴(𝑡) ∝ 𝑒'(('())
*
+,* S1
where the centre position is the so-called residence time 𝑡- = 𝑥/𝑣 defined by the distance between detection
and injection points (𝑥 = 𝑥23(− 𝑥567) and the mean velocity of the flow (𝑣) averaged over the cross section
𝜎+= 𝑡 92 𝐷
𝑣+ +
𝑌+
24 𝐷@ S2
with 𝑌 as the capillary radius and the translational self-diffusion coefficient 𝐷 of the particles dispersed in laminar flow. Using two detection points promotes accuracy,8,9 and 𝐷 is estimated through the differences in
variances and residence times 𝜎++− 𝜎A+ and 𝑡+− 𝑡A, respectively. The TDA dispersion profiles (Taylorgrams) at
two detection windows along the capillary were fitted to a simple Gaussian fit using least squares fitting yielding the first and second raw moments of the dispersion profiles (Figure S8). The fitted mean and variance are then used to solve Equation S3 and Equation S4, yielding the diffusion coefficient D and the hydrodynamic radius Rh: 10-12 𝐷 = 𝑅C+(𝑡+− 𝑡A) 24(𝜎++− 𝜎 A+) S3 𝑅D = 𝑘F𝑇 6𝜋𝜂𝐷 S4
with Rc the capillary radius, t1 and t2 as the average travel times of the dispersion profiles, σ1 and σ2 as the
standard deviations of the profiles at the first and second window respectively, kB the Boltzmann constant, T
the temperature, n the dynamic viscosity of the solvent, and Rh the hydrodynamic radius.
1.2.3 Synthetic Procedures and Analytical Data
General Procedures. Unless otherwise noted, all reactions were carried out in dried Schlenk glassware in an
inert argon atmosphere. Chromatography solvents were purchased as reagent grade and used as received. n-Butyl acrylate was passed over basic Al2O3 prior to use. Extra dry THF (Acros) was degassed prior to use.
Europium(III) perchlorate (Eu(ClO4)3) solution (50% aqueous solution; Strem) was diluted with THF and dried
over sodium sulphate prior to use. Iron(II) perchlorate hydrate (Fe(ClO4)2 · H2O) (Aldrich), Zinc bistriflimide
(Zn(NTf2)2) (Strem), chelidamic acid (Intatrade Chemicals GmbH), acryloyl chloride,
2,2’-azobis(2-methylpropionitrile) (AIBN) (Sigma-Aldrich), cyanomethyl dodecyl trithiocarbonate (Aldrich), and all other reagents were commercially obtained and used without further purification. 2,6-Bis(1’-ethylbenzimidazolyl)pyridine (Mebip) 1 and the soluble EH-Mebip derivative with an ethyl-hexyl side chain were both prepared following previously reported literature procedures.1,2 TLC analyses were performed on
TLC plates from Merck (Silica gel 60 F254). UV-light (254 nm) was used for detection. Column chromatography
was conducted using a Biotage Isolera One system and Biotage SNAP columns or bio-beads S-X1 support (Bio-Rad).
12-((2,6-Bis(1-methyl-1H-benzo[d]imidazol-2-yl)pyridin-4-yl)oxy)dodecan-1-ol 2 (Mebip-O-C12H24-OH). Mebip (1.05 g, 2.96 mmol) was dissolved in anhydrous DMF (60 mL). K2CO3 (1.16 g, 8.44 mmol) was added and
DMF (10 mL) and the solution was added dropwise to the reaction mixture. The mixture was stirred for 15 h at room temperature and subsequently filtered. The filtrate was dried in vacuo and purified by column chromatography (silica gel; DCM/MeOH 100:0–98:2 v/v) yielding the target compound as a colorless solid (0.60 g, 40 %). 1H NMR (400 MHz, CDCl 3): δ = 8.01 (bs, 2H), 7.93 (d, J = 6.7 Hz, 2H), 7.51 (d, J = 7.2 Hz, 2H), 7.41 (m, 4H), 4.27 (m, 8H), 3.67 (t, J = 6.6 Hz, 2H), 1.89 (q, J = 7.0 Hz), 1.66-1.47 (m, 4H), 1.42-1.27 (m, 14H). 13C NMR (101 MHz, CDCl3): δ = 166.74, 150.99, 150.42, 142.39, 137.14, 123.58, 122.87, 120.12, 111.93, 109.93, 68.73, 63.02, 32.83, 32.54, 29.50, 29.42, 29.39, 29.35, 29.14, 28.88, 25.83, 25.73. IR (ATR): ν = 3287, 3059, 2920, 2849, 1592, 1565, 1468, 1443, 1407, 1394, 1326, 1308, 1389, 1244, 1184, 1130, 1031, 928, 880, 750, 739, 726, 600, 566, 543. M.p.: 162.5 °C. EA: calcd. for C33H41N5O2: C 73.44%; H 7.66%; N 12.98%; O 5.93%; found: C 73.31%; H
9.31%; N 12.22%. MS (MALDI): calcd. for [M + Na]+: 562.32; found: 562.31. HRMS (ESI): calcd. for [M + Na]+
562.3152, found: 562.3159.
Functionalized acrylate monomer 3 (Mebip-acrylate).
Mebip-O-C12H24-OH 2 (0.39 g, 0.73 mmol) was dissolved in anhydrous CHCl3 (20 mL) and the solution was
cooled in an ice bath. Triethylamine (0.41 mL, 3.0 mmol) was added dropwise and the solution was stirred for 30 min. Acryloyl chloride (72 μL, 0.89 mmol) was added dropwise, and the reaction mixture was allowed to warm to room temperature and stirred for 17 h. Ethanol was added (3 drops), the reaction mixture was diluted with CHCl3 (20 mL), and washed two times with water (2 x 25 mL) and once with saturated NaCl solution
(25 mL). The organic phase was dried over Na2SO4 and the solvent was removed in vacuo. Column
chromatography (silica gel, DCM/MeOH 98:2–97:3 v/v) yielded the target compound as a brown solid (0.32 g, 73 %). 1H NMR (400 MHz, CDCl3): δ = 7.96 (s, 2H), 7.88 (d, J = 7.03 Hz, 2H), 7.46 (d, J = 7.2 Hz, 2H), 7.37 (m, 4H), 5.39 (dd, J = 17.3 Hz, J = 1.5 Hz, 1H), 6.12 (dd, J = 17.3 Hz, J = 10.4 Hz, 1H), 5.80 (dd, J = 10.4 Hz, J = 10.5 Hz, J = 1.5 Hz, 1H), 4.24 (m, 8H), 4.15 (t, J = 6.8 Hz, 2H), 1.86 (q, J = 7.0 Hz, 2H), 1.67 (q, J = 7.0 Hz, 2H), 1.49 (q, J = 7.3 Hz, 2H), 1.40-1.27 (m, 14H). 13C NMR (101 MHz, CDCl 3): δ = 166.91, 166.49, 150.48, 137.23, 130.51, 128.83, 123.79, 123.09, 120.23, 112.18, 110.10, 77.36, 68.94, 64.89, 32.70, 29.69, 29.65, 29.41, 29.05, 28.78, 26.09, 26.03. IR (ATR): ν = 3060, 2922, 2852, 1723, 1633, 1588, 1567, 1467, 1443, 1409, 1391, 1362, 1326, 1309, 1294, 1269, 1180, 1023, 984, 930, 882, 863, 811, 768, 753, 726, 670, 605, 587, 546. M.p.: 102.8 °C. EA: calcd. for C36H43N5O3: C 72.82%; H 7.30%; N 11.79%; 8.08%; found: C 72.81%; H 8.45%; N 11.81%. MS (MALDI):
calcd. [M + H]+ 594.34, found 594.37. HRMS (ESI): calcd. for [(M – acryl) + H]+ 540.3333, found: 540.3328. Poly(n-butyl acrylate-co-Mebip acrylate) P1.
A stock solution of azobisisobutyronitrile in chlorobenzene was made (10.7 mg, 65 μmol in 0.53 mL chlorobenzene). Azobisisobutyronitrile (45 μL of the stock solution, 0.90 mg, 5.5 μmol), n-butyl acrylate
(0.59 mL, 3.9 mmol), Mebip-acrylate 3 (117 mg, 0.21 mmol), and cyanomethyl dodecyl trithiocarbonate (8.8 mg, 28 μmol) were dissolved in chlorobenzene (2 mL), bubbled with argon for 15 min and stirred at 70 °C for 17 h. The reaction mixture was precipitated in cold MeOH (15 mL). After centrifugation, the solvent was decanted, and the crude was dried under high vacuum. Preparative size exclusion chromatography (styrene divinylbenzene beads, THF) yielded the target polymer P1 as a colourless solid (0.35 g, 56 %).
1H NMR (400 MHz, CDCl 3): δ = 8.0 (br, 2H), 7.88 (br, 2H), 7.47 (br, 2H), 7.30 (br, 4H), 4.24 (br, 8H), 4.1-3.9 (br, 40), 2.4-2.2 (br, 20H), 2.0-1.2 (br, 162H), 1.0-0.8 (br, 57H). 13C NMR (101 MHz, CDCl3): δ = 174.55, 151.51, 135.78, 128.25, 125.51, 119.88, 110.05, 67.97, 64.41, 41.50, 34.23, 32.62, 30.63, 30.60, 30.33, 29.64, 25.93, 25.62, 19.10, 13.73. IR (ATR): ν = 2958, 2932, 2873, 1729, 1592, 1567, 1446, 4392, 1327, 1241, 1158, 1117, 1063, 1023, 940, 840, 741.
Poly(butyl acrylate-co-Mebip acrylate) P2.
A stock solution of azobisisobutyronitrile was made (4.36 mg, 26 μmol in 1 mL dioxane). Azobisisobutyronitrile (32 μl of the stock solution, 0.14 mg, 0.85 μmol), n-butyl acrylate (0.55 mL, 3.9 mmol), Mebip acrylate 3 (161 mg, 0.27 mmol), and 2-(dodecylthiocarbonothioylthio)-2-methylpropionic acid (3.11 mg, 8.5 μmol) were dissolved in 0.5 mL dioxane. The mixture was degassed by three freeze-pump-thaw cycles and stirred at 65 °C for 24 h. The reaction mixture was precipitated in 15 mL cold MeOH. After centrifugation, the solvent was decanted, and the crude was dried under high vacuum. Preparative size exclusion chromatography (styrene divinylbenzene beads, THF) yielded the target polymer P2 as a colourless solid (0.42 g, 63 %).
1H NMR (400 MHz, CDCl 3): δ = 8.0 (br, 2H), 7.88 (br, 2H), 7.47 (br, 2H), 7.30 (br, 4H), 4.24 (br, 8H), 4.1-3.9 (br, 32H), 2.4-2.2 (br, 16H), 2.0-1.2 (br, 130H), 1.0-0.8 (br, 45H). 13C NMR (101 MHz, CDCl 3): δ = 174.56, 174.42, 166.81, 150.00, 136.91, 123.79, 123.15, 119.92, 112.28, 110.01, 68.92, 64.54, 64.41, 64.33, 41.46, 32.59, 30.63, 30.60, 30.55, 29.64, 29.35, 28.93, 25.92, 25.92, 19.10, 13.73. IR (ATR): ν = 2958, 2932, 2873, 1729, 1592, 1567, 1445, 1412, 1392, 1328, 1307, 1242, 1158, 1117, 1063, 1024, 940, 900, 868, 840, 806, 766, 752, 741.
1.3 NMR Spectra
1H NMR spectrum (CDCl
1H NMR spectrum (CDCl
1H NMR spectrum (CDCl
3, 400 MHz) and 13C NMR spectrum (CDCl3, 101 MHz) of poly(n-butyl acrylate-co-Mebip
1H NMR spectrum (CDCl
3, 400 MHz) and 13C NMR spectrum (CDCl3, 101 MHz) of poly(n-butyl acrylate-co-Mebip
1.4 References
(1) Rowan, S. J.; Beck, J. B. Metal–Ligand Induced Supramolecular Polymerization: a Route to Responsive Materials.
Faraday Discuss. 2005, 128, 43–53.
(2) Sautaux, J.; Montero de Espinosa, L.; Balog, S.; Weder, C. Multistimuli, Multiresponsive Fully Supramolecular Orthogonally Bound Polymer Networks. Macromolecules 2018, 51 (15), 5867–5874.
(3) El-Ghayoury, A.; Schenning, A. P. H. J.; Meijer, E. W. Synthesis of ?-Conjugated Oligomer That Can Form Metallo Polymers. J. Polym. Sci. Part A: Polym. Chem. 2002, 40 (22), 4020–4023.
(4) Knapton, D.; Iyer, P. K.; Rowan, S. J.; Weder, C. Synthesis and Properties of Metallo-Supramolecular Poly( P-Xylylene)S. Macromolecules 2006, 39 (12), 4069–4075.
(5) Aris, R. On the Dispersion of a Solute in a Fluid Flowing Through a Tube. Proc. R. Soc. Lond. A 1956, 235 (1200), 67–77.
(6) Taylor, G. I. Dispersion of Soluble Matter in Solvent Flowing Slowly Through a Tube. Proc. R. Soc. Lond. A 1953,
219 (1137), 186–203.
(7) Taylor, G. I. Conditions Under Which Dispersion of a Solute in a Stream of Solvent Can Be Used to Measure Molecular Diffusion. Proc. R. Soc. Lond. A 1954, 225 (1163), 473–477.
(8) Sharma, U.; Gleason, N. J.; Carbeck, J. D. Diffusivity of Solutes Measured in Glass Capillaries Using Taylor's Analysis of Dispersion and a Commercial CE Instrument. Anal. Chem. 2005, 77 (3), 806–813.
(9) Chamieh, J.; Cottet, H. Comparison of Single and Double Detection Points Taylor Dispersion Analysis for Monodisperse and Polydisperse Samples. J Chromatogr A 2012, 1241, 123–127.
(10) Einstein, A. Über Die Von Der Molekularkinetischen Theorie Der Wärme Geforderte Bewegung Von in Ruhenden Flüssigkeiten Suspendierten Teilchen. Ann. Phys. 1905, 322 (8), 549–560.
(11) Einstein, A. Eine Neue Bestimmung Der Moleküldimensionen. Ann. Phys. 1906, 324 (2), 289–306.
(12) Einstein, A. Berichtigung Zu Meiner Arbeit: „Eine Neue Bestimmung Der Moleküldimensionen.” Ann. Phys.