OATAO is an open access repository that collects the work of Toulouse researchers and makes it freely available over the web where possible
Any correspondence concerning this service should be sent
to the repository administrator: [email protected]
This is a Publisher’s version published in: http://oatao.univ-toulouse.fr/16749
To cite this version:
Meng-Jung Li, Molly and Mills, Poppy and Fairclough, Simon M. and Robertson, Alex and Peng, Yung-Kang and Warner, Jamie and Nie, Chunyang and Flahaut, Emmanuel and Edman Tsang, Shik Chi
Importance of the structural integrity of a carbon conjugated mediator for photocatalytic hydrogen generation from water over a CdS–carbon nanotube– MoS2 composite. (2016) Chemical Communications, 52 (93). 13596-13599. ISSN 1359-7345
13596 | Chem. Commun., 2016, 52, 13596--13599 This journal is © The Royal Society of Chemistry 2016
Cite this: Chem. Commun., 2016, 52, 13596
Importance of the structural integrity of a carbon
conjugated mediator for photocatalytic hydrogen
generation from water over a CdS–carbon
nanotube–MoS
2composite†
Molly Meng-Jung Li,aPoppy Mills,aSimon M. Fairclough,‡aAlex Robertson,b Yung-Kang Peng,aJamie Warner,bChunyang Nie,cEmmanuel Flahautcand Shik Chi Edman Tsang*a
Incorporation of CdS quantum dots is shown to significantly pro-mote photocatalytic hydrogen production from water over single-layer MoS2in a remote manner via their dispersions on a carbon nanotube as a nanocomposite: the hydrogen evolution rate is found to be critically dependent on the content and structural integrity of the carbon nanotube such that the double-walled carbon nanotube shows superior H2production to a single-walled carbon nanotube because the inner carbon tubules survive from the structural damage during functionalization.
The depletion of fossil fuel reserves and the undeniable environ-mental harm caused by their overconsumption make photo-catalytic H2production from water attractive as a future renewable
energy source.1,2Typically, photocatalytic splitting of water requires semiconductors to capture a photon with energy equal to or greater than their band gap energy. The photons are absorbed by a semiconductor nanocrystal, causing the generation of photo-excited electrons and holes in the conduction and valence bands, respectively. The excited electron–hole pairs, known as excitons, are then subjected to two main competitive deactivation routes, namely exciton recombination and exciton separation followed by chemical reactions. The former route is undesirable in photo-catalysis, since this only emits heat or light with no chemical process involved, whereas the latter is important for photocata-lytic reduction of water to hydrogen gas.
Nanosize CdS is a quantum dot material for efficient capture and emission of photons due to its characteristic band edges and band gap.3,4However, it displays very poor photocatalytic
activity due to rapid exciton recombination.5,6 On the other
hand, molybdenum disulfide (MoS2) is not an intrinsically active
semiconductor to capture photons in photo-catalysis but its conduction band ( 0.12 eV vs. NHE) and valance band (1.78 eV vs. NHE) render it suitable for electrochemical water-splitting.7 It has been reported that an intimate CdS/MoS2 mixture can
catalyze photocatalytic H2 evolution efficiently.8 In addition,
CdS supported on carbon materials is also proven to suppress charge recombination and provide active adsorption sites, which leads to the enhancement of photocatalytic activity.9–13 Furthermore, the use of graphene to support CdS quantum dots and single layer MoS2(s-MoS2) appears to give a higher
hydro-gen evolution rate.7The functional roles of each component in these composite mixtures and their synergistic effect(s) for photocatalytic H2evolution are not yet clear. It is believed that
by elucidating such material interactions, a rational design of composite materials for more efficient photocatalytic conver-sion into chemicals could be developed.
Here we report the systematic study of correlation of the photocatalytic H2 activity with the structural and electronic
properties of CdS and s-MoS2 and interactions with surface
functionalized single, double and multi-walled carbon nanotubes (SWNTs, DWNTs and MWNTs) (see the ESI†) in composites using a range of characterization techniques including XRD, TEM, SAED and Raman. In particular, the time-resolved photolumines-cence (TRPL) technique is invoked to investigate the lifetime of excitons with reference to activity measured for this type of composite. It is found that the exciton recombination that readily takes place on CdS upon light activation can be effectively quenched when it is mixed with carbon nanotubes (CNTs) due to rapid transfer of the photo-excited electrons to the carbon structure before the proton reduction from water for the hydro-gen production over s-MoS2. Thus, the light capturing sites (CdS)
can be separated from hydrogen production sites (s-MoS2) via
CNTs as electronic mediators. A higher hydrogen production rate is achieved over the two finely dispersed phases on the CNT than without the carbon structure due to its higher electron
a
Wolfson Catalysis Centre, Department of Chemistry University of Oxford, Oxford, OX1 3QR, UK. E-mail: [email protected]
bDepartment of Materials, University of Oxford, Oxford, OX1 3PH, UK cCentre Interuniversitaire de Recherche et d’Inge´nierie des Mate´riaux,
Universite´ Paul Sabatier, CIRIMAT, UMR CNRS 5085, Toulouse, France
†Electronic supplementary information (ESI) available: Supporting figures, and detailed experimental procedures, including XRD, TEM, FTIR, Raman, etc. See DOI: 10.1039/c6cc07632g
‡Present address: Department of Physics, King’s College London, UK. Received 20th September 2016, Accepted 19th October 2016 DOI: 10.1039/c6cc07632g www.rsc.org/chemcomm
ChemComm
COMMUNICATION
This article is licensed under a
Creative Commons Attribution-NonCommercial 3.0 Unported Licence.
View Article Online
This journal is © The Royal Society of Chemistry 2016 Chem. Commun., 2016, 52, 13596--13599 | 13597
conductivity and storage capacity.14,15 It is also found that typical acid functionalization of CNTs for the immobilization of CdS and MoS2 can lead to destruction of surface graphitic
conjugation, affecting the essential process of electron transfer, which will lead to poor activity. As a result, DWNTs with intact inner carbon tubules act as optimal electron mediators for photocatalytic hydrogen production.
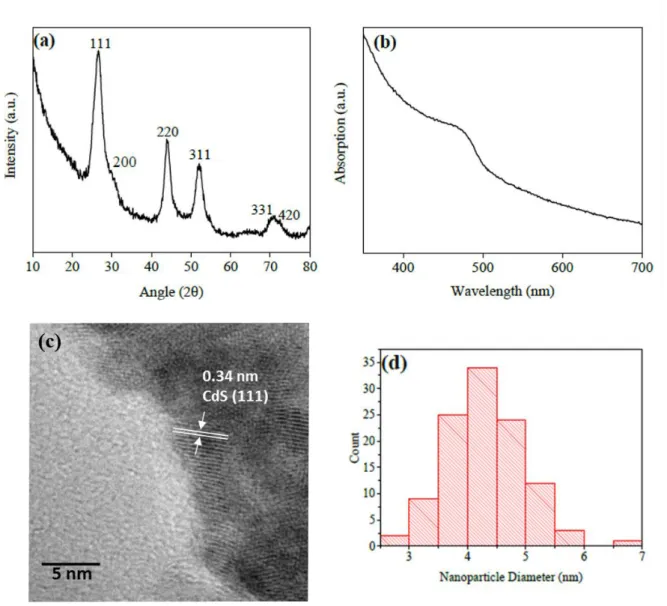
The powder XRD pattern of synthesised CdS quantum dots according to the literature is shown in Fig. S1(a) (ESI†), which confirms the CdS cubic structure. The Scherrer equation revealed an average particle size of 4.76 nm. This suggests small but uniform CdS nanoparticle size. The UV-visible absorption of CdS presented in Fig. S1(b) (ESI†) features an absorption hump at 472 nm corresponding to a reported band gap of 2.63 eV.3,4The TEM image also reveals typical 4.32 nm CdS nanoparticles and their size distribution is shown in Fig. S1(c) and (d) (ESI†). Single layer MoS2has also been synthesised (see the ESI†). Fig. S2 (ESI†)
clearly shows that CdS nanoparticles tend to aggregate on the basal and edge regions of the restacked s-MoS2sheets with more
than one monolayer thickness. The severe aggregation of CdS and s-MoS2at the material interface indicates a poor dispersion
of these components for light capture and charge (exciton) separation. It was envisaged that dispersion of CdS and s-MoS2
on high surface area CNTs may overcome the problems. Typical HNO3 acid pre-treatment on CNTs has been applied for the
removal of contaminants (such as amorphous carbon and catalyst particles) and also functionalization of the outer carbon structure with terminal carboxyl and hydroxyl groups for the immobiliza-tion and dispersion of a solid phase in the composite.16A detailed selection of acid treatments was reviewed, which revealed that most of the treatments can not only effectively remove contami-nants but also cause shortening of tube length and functionalize the carbon surface.17 Among various acids and concentrations applied, 3 M HNO3was regarded as the optimum concentration
and served as a compromise between the yield of the functional groups created on CNTs and the chemical damage to the CNT structure. Therefore, the 3 M HNO3treatment was chosen for
the CNT pre-treatment. The photocatalytic hydrogen produc-tion activity of the composite samples with lactic acid as the sacrificial reagent was measured. Fig. 1(a) shows that CdS or CdS/DWNTs are totally inert for the hydrogen production, implying that CdS and the CdS/DWNT interface cannot provide sites for proton reduction despite the well-known light capture ability for exciton production over the CdS and DWNT phases. In contrast, when s-MoS2is used, a significant quantity of H2is
produced (137 mmol h 1 g 1). Furthermore, the CdS/s-MoS2
composite produces 1380 mmol h 1 g 1 H2, which is clearly
greater than CdS or s-MoS2alone.7There is a further increase in
the amount of evolved H2gas when DWNTs are added to the
CdS/s-MoS2(see E, F, G).
With an increased amount of DWNTs added, a maximum of H2gas is evolved (5728 mmol h 1g 1) at a 5 mg DWNT content.
However, further increase in the amount of DWNTs could impair the photocatalytic H2 production, presumably due to
masking of active sites, i.e. the shielding effect,4when 7 mg of DWNTs is used. Upon comparing different forms of CNTs
(SWNTs, DWNTs and MWNTs) with the same loading, see Fig. 1(b), the DWNT composite gives the best activity on a per gram basis. Noticeably, the SWNT composite gives only half a H2 production rate compared to the DWNT. As a result, the
functional roles for each component particularly the nature and quality of CNTs as supports with respect to hydrogen produc-tion activity were investigated through careful material char-acterisation studies. To explore the charge (exciton) dynamics within the synthesised composites, the samples were examined using static and time-resolved photoluminescence spectroscopy (PL and TRPL). The steady-state PL spectra at an excitation wave-length of 405 nm shown in Fig. 2a contain anticipated strong emission from CdS quantum dots centred at 750 nm by recom-bination of excitons from the trap-state. However, CdS quantum dots when mixed with either CNTs or s-MoS2 or CNT/s-MoS2
exhibit much smaller trap-state peaks compared with CdS alone, suggesting that the radiative recombination of excitons in CdS is minimised. CNTs appear to be more effective in quenching the PL than MoS2on the same weight basis but the CdS/DWNT/s-MoS2
mixture is the most effective. Fig. 2b shows the effectiveness
Fig. 1 (a) Hydrogen evolution rate for 20 mg of catalysts extracted from (A) CdS, (B) CdS/DWNT, (C) s-MoS2, (D) CdS/s-MoS2, (E) CdS/2 mg DWNT/ s-MoS2, (F) CdS/5 mg DWNT/s-MoS2, and (G) CdS/7 mg DWNT/s-MoS2. (b) Hydrogen evolution rate for 5 mg of DWNTs; MWNTs and SWNTs to support CdS and s-MoS2.
Fig. 2 Steady state PL, excitation 405 nm, for (a) CdS samples with different components and (b) CdS and CdS/CNT/s-MoS2samples. Time-resolved PL with decay monitored at 750 nm, excitation 405 nm, for (c) CdS samples with different components and (d) CdS and CdS/CNT/s-MoS2with different natures of CNTs.
Communication ChemComm
This article is licensed under a
Creative Commons Attribution-NonCommercial 3.0 Unported Licence.
13598 | Chem. Commun., 2016, 52, 13596--13599 This journal is © The Royal Society of Chemistry 2016
of DWNTs, MWNTs and SWNTs in quenching the trap-state emission PL. From TRPL (Fig. 2c and d), an average lifetime (t) for exciton recombination for each sample was derived and is shown in Table 1. The pristine CdS demonstrates an average lifetime of 13.00 ns; upon mixing with s-MoS2and DWNTs, the
photo-generated carriers are indeed significantly quenched, where the DWNTs again show better quenching ability compared to s-MoS2. This indicates that the collection/extraction of
photo-excited electrons from CdS to s-MoS2via DWNTs is more efficient
than that of CdS/s-MoS2, presumably due to the electron storage
and mobility of DWNTs. Among all the samples, CdS/DWNT/ s-MoS2displays the lowest t (3.02 ns). Similar to the static PL,
SWNTs (4.53 ns) are less effective than MWNTs (3.42 ns) and DWNTs (3.02 ns) in quenching the exciton emission. As MoS2is
only the component to provide active sites for proton reduction to hydrogen (see Fig. 1), it is likely that the photoelectrons generated by CdS upon light excitation are quickly taken up by the CNTs before passing to s-MoS2. Apparently, the nature of
CNTs appears to be critical for efficient transport and storage of photoelectrons from the CdS phase.
It is well known that the electronic properties of carbon nanotubes are crucially dependent on the diameter and chirality due to their distorted conjugated atomic tubular structure with partial overlap of Pz orbitals, whereas the electronic properties of MWNTs are quite complex, as each layer in the MWNTs can have different chiralities. Furthermore, MWNTs show considerably lower electronic conductivity than those of SWNTs or DWNTs because the interactions between the layers within MWNTs were found to disturb the electrical current along the tube axis.15
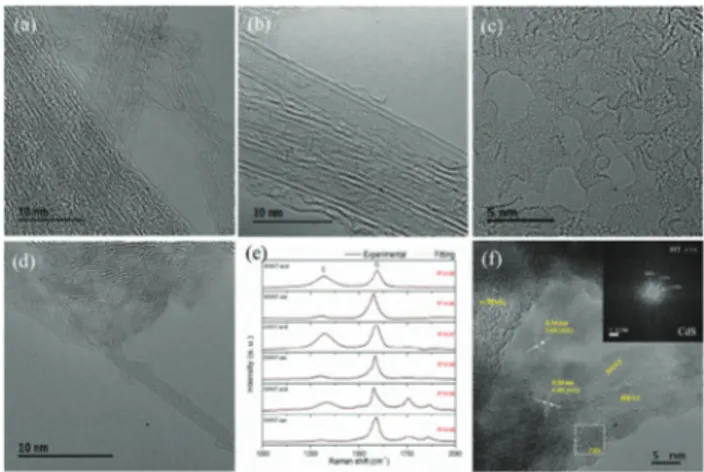
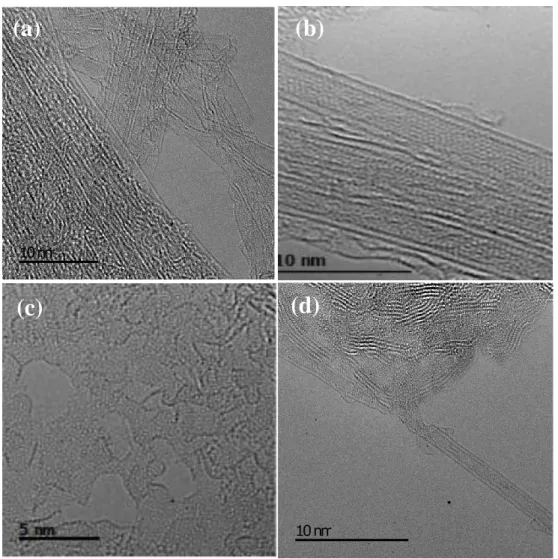
The morphology of DWNTs is very close to SWNTs, but the inner carbon tubes may provide detainment of the conjugation atomic pathway from aggressive mechanical or chemical damage to the outer tube surface.17 High-resolution TEM (HR-TEM) images (Fig. 3a and b) thus show the raw single and double-walled CNTs with the tubular graphene feature for the SWNT and DWNT, respectively. After 3 M HNO3treatment, the majority of
SWNTs are converted into carbon sheets and amorphous carbon (the area of serious destruction of SWNTs to amorphous carbon is shown in Fig. 3c). But many of the DWNTs retain their partially destructed tubular structure with amorphous carbon fragments (Fig. 3d). Thus, the more fragile nature of SWNTs leading to opening, unfolding and destruction to carbon fragments is particularly noted. Fig. S3 (a) (ESI†) shows the formation of new peaks of CQO stretching at 1691 cm 1, CQC and CQO at 1571 cm 1and C–O stretching at 1064 cm 1for the acid treated CNTs by FTIR spectroscopy. To quantify the global structural
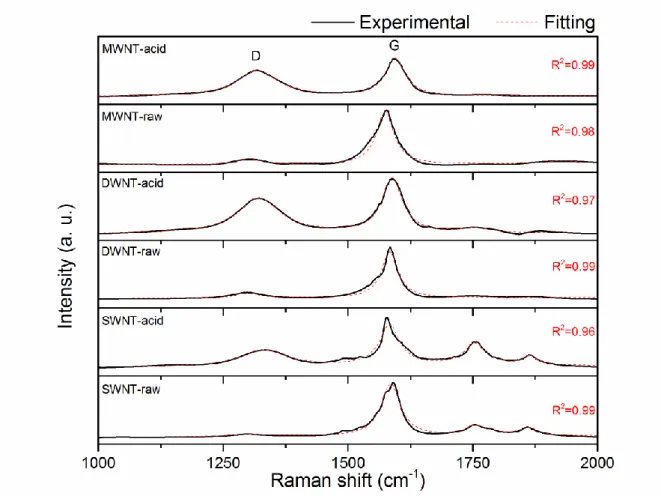
change of the samples before and after the same acid treatment, Raman spectra of raw and HNO3-treated CNTs are shown in
Fig. 3e. The band located around 1315 cm 1is assigned to the D-band which is commonly associated with the disordered, sp3-hybridised carbon arising from defects and impurities, while the band located around 1580 cm 1is assigned to the G-band which is associated with the crystalline graphitic structures.18 The intensity ratio of the D-band to the G-band is commonly used to quantify the degree of disorder in a graphene structure.19 Generally, HNO3-treated CNTs showed larger D-band to G-band
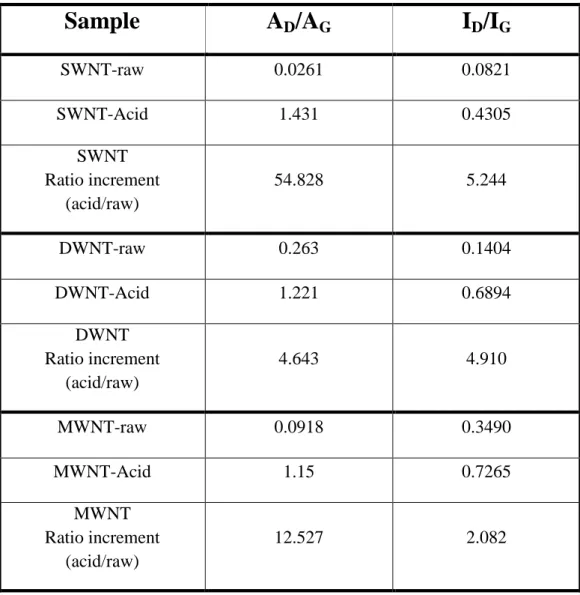
ratios, indicating the destruction of the graphene structure of CNTs during the acid treatment. Notably, the ID/IGratio increases
to 5.2 times in the SWNT, followed by 4.9 times in the DWNT and 2.1 times in the MWNT sample. The increase of the D-band ratio in SWNTs suggests that SWNTs indeed have undergone more serious damage after identical acid treatment (particularly on surfaces), which we believe impairs their charge transfer ability (larger t shown in Table 1), hence resulting in lower H2activity
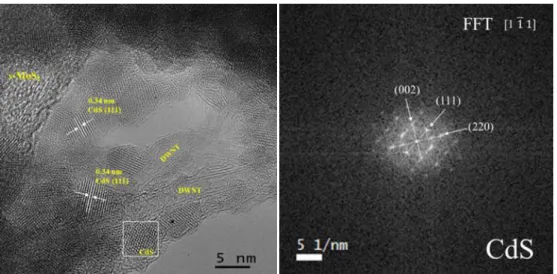
compared to DWNTs (see Fig. 1b). Fig. 3f shows that the image of the CdS/DWNT/s-MoS2composite, in which the regions of CdS
nanoparticles and s-MoS2sheets dispersed on the partial tubular
carbon structure can be differentiated through the corresponding lattice fringe distances and fast-Fourier transform (FFT) (inset of Fig. 3f). The intimate contact between CdS, s-MoS2and carbon
nanotubes are clearly evidenced, which suggests that the CNTs remarkably decrease the aggregation of CdS and s-MoS2as they
spread uniformly in the nanocomposite for superior H2activity
compared to that without the carbon support. This indicates the future design of efficient photoactive composites for separation and optimization of light capture nanomaterials from catalytic hydrogen production materials via electron conductive mediators in a remote way. It is also clear from this study that the crucial maintenance of the integrity of the graphitic tubular structure and the intactness of the conjugation of inner tubes are impera-tively important for the charge transport and storage from the light capture CdS phase to hydrogen production sites on s-MoS2
for optimal photo-catalysis.
Table 1 The fractional contribution (fi) and lifetime (ti) of each decay component & average lifetime (tavg) for various samples
Material f1(%) t1(ns) f2(%) t2(ns) tavg(ns) CdS 20.8 1.45 79.2 16.03 13.00 CdS/MoS2 27.3 0.74 72.7 7.82 5.88 CdS/DWNT 30.9 0.79 69.1 6.83 4.97 CdS/DWNT/MoS2 28.4 0.64 71.6 3.96 3.02 CdS/MWNT/MoS2 33.9 0.89 66.1 4.72 3.42 CdS/SWNT/MoS2 26.8 0.79 73.2 5.90 4.53
Fig. 3 HR-TEM images of (a) raw SWNTs, (b) raw DWNTs, (c) acid-treated SWNTs, and (d) acid-treated DWNTs. (e) Raman spectra of raw CNTs and 3 M HNO3treated CNTs. (f) CdS/DWNT/s-MoS2(sheets) with inset of fast-Fourier transform (FFT) of CdS. The enlarged images are found in Fig. S2 (ESI†).
ChemComm Communication
This article is licensed under a
Creative Commons Attribution-NonCommercial 3.0 Unported Licence.
This journal is © The Royal Society of Chemistry 2016 Chem. Commun., 2016, 52, 13596--13599 | 13599
In summary, photocatalytic hydrogen evolution activity through water splitting is greatly enhanced by the incorporation of carbon nanotubes and single-layered MoS2nano-sheets as cocatalysts into
the CdS system. CdS/DWNT/s-MoS2with the optimal amount
of DWNTs (mass ratio of CdS : DWNT : s-MoS2= 100 : 5 : 2) can
provide a high hydrogen evolution rate of 5728 mmol g 1h 1, and the unique roles of intact carbon nanotubes as electron mediators are for the first time identified by this present systematic TRPL study, as summarized in Scheme 1. In addition, a DWNT shows the best performance compared to other forms of CNTs, due to its robust double-walled structure, which can provide protection for the inner tube from surface damage during functionalization/handling, while a SWNT inevitably suffers from destruction of conjugation. This study depicts the importance of fabrication of intimate heterojunctions demonstrating the benefits of nano-ensembles of functional units for light
capture, carrier transfer and catalysis in synergy for efficient photo-production of hydrogen from water.
The financial supports of this work from the EPSRC of UK and the Royal Society international joint project with the carbon nanotube group (CNRS) at Toulouse, France, are acknowledged. MMJL acknowledges a Swire Scholarship for her DPhil study at Oxford University, U.K.
Notes and references
1 M. Ni, M. K. Leung, D. Y. Leung and K. Sumathy, Renewable Sustainable Energy Rev., 2007, 11, 401–425.
2 A. Kudo and Y. Miseki, Chem. Soc. Rev., 2009, 38, 253–278. 3 X. Chen, S. Shen, L. Guo and S. S. Mao, Chem. Rev., 2010, 110,
6503–6570.
4 Q. Li, B. Guo, J. Yu, J. Ran, B. Zhang, H. Yan and J. Gong, J. Am. Chem. Soc., 2011, 133, 10878–10884.
5 A. Cao, Z. Liu, S. Chu, M. Wu, Z. Ye, Z. Cai, Y. Chang, S. Wang, Q. Gong and Y. Liu, Adv. Mater., 2010, 22, 103–106.
6 D. J. Fermin, E. A. Ponomarev and L. M Peter, J. Electroanal. Chem., 1999, 473, 192–203.
7 T. Jia, A. Kolpin, C. Ma, R. C.-T. Chan, W.-M. Kwok and S. C. E. Tsang, Chem. Commun., 2014, 50, 1185–1188.
8 J. Zhang, Z. Zhu and X. Feng, Chem. – Eur. J., 2014, 20, 10632–10635. 9 I. Robel, B. A. Bunker and P. V. Kamat, Adv. Mater., 2005, 17, 2458–2463. 10 D. Lang, T. Shen and Q. Xiang, ChemCatChem, 2015, 7, 943–951. 11 S. Pan and X. Liu, New J. Chem., 2012, 36, 1781–1787.
12 Q. Xiang, F. Cheng and D. Lang, ChemSusChem, 2016, 9, 996–1002. 13 A. Ye, W. Fan, Q. Zhang, W. Deng and Y. Wang, Catal. Sci. Technol.,
2012, 2, 969–978.
14 R. Baughman, A. Zakhidov and W. A. de Heer, Science, 2002, 297, 787–792.
15 R. Saito, G. Dresselhaus and M. S. Dresselhaus, Phys. Rev. B: Condens. Matter Mater. Phys., 1996, 53, 2044–2050.
16 Y. Yao, G. Li, S. Ciston, R. M. Lueptow and K. A. Gray, Environ. Sci. Technol., 2008, 42, 4952–4957.
17 T. Bortolamiol, P. Lukanov, A.-M. Galibert, B. Soula, P. Lonchambon, L. Datas and E. Flahaut, Carbon, 2014, 78, 79–90.
18 I. D. Rosca, F. Watari, M. Uo and T. Akasaka, Carbon, 2005, 43, 3124–3131. 19 H. Murphy, P. Papakonstantinou and T. I. T Okpalugo, J. Vac. Sci. Technol., B: Microelectron. Nanometer Struct.–Process., Meas., Phenom., 2006, 24, 715–720.
Scheme 1 Photocatalytic production of hydrogen from water over CdS– carbon nanotube (CNT)–MoS2is found critically dependent on the con-tent and nature of the nanotube used. Time resolved photo-luminescence indicates that the surface graphitic structure of the CNT is vulnerable to damage, halting the essential electron transfer for H2formation. Thus, the DWNT exhibits superior H2activity to the SWNT because of the structural integrity of the inner tubule.
Communication ChemComm
This article is licensed under a
Creative Commons Attribution-NonCommercial 3.0 Unported Licence.
Electronic Supporting Information
Experimental details
1. Catalyst preparation
1.1 MaterialsReagents used throughout this thesis were purchased from Sigma Alrdrich and were used without modification or purification unless stated: Cadmium Chloride- CdCl2 (99.99% trace metals basis), Oleylamine (technical grade,70%), Sulfur (99.998% trace metals basis), Molybdenum Disulfide- MoS2 (99% 2H-MoS2), n-Butly Lithium (1.6 M solution in hexane), Hexane (97 ≥ chromasolv for HPLC), Nitric Acid- HNO3 (ACS reagent), Lactic Acid (85%), SWNT (carbon >90%, ≥80.0% carbon as SWNT (BET≈ 560 m2g-1), 0.7-1.4 nm diameter).The DWNTs (345 m2g-1) were produced by catalytic chemical vapor deposition (CCVD) of a H2-CH4 mixture at 1000˚C with CoMo-MgO catalyst.[1,2] MWNTs (369 m²g-1) were synthesized by Catalytic Chemical Vapour Deposition using a Co:Mo-MgO catalyst with an elemental composition of Mg0.9Co0.033Mo0.067O. The catalyst was heated in an atmosphere containing 36% of CH4 and 64% of H2, at a total flow-rate of 15L/h, starting from room temperature to 1000°C at 5°/min. No dwell was applied and the gaseous atmosphere was maintained constant during all the procedure.[3] CNTs are free from amorphous carbon coating. During the extraction process, oxides (unreacted CoMo-MgO) and unprotected metal nanoparticles (Co, Mo) were dissolved by addition of aqueous HCl solution. The acidic suspension was then filtered on 0.45 m pore-size polypropylene membranes and washed with deionized water until neutrality. The sample was freeze-dried. 1.2 Synthesis of cadmium sulphide
The synthesis of CdS spherical NPs followed the method described by Joo et. al.[4] Firstly, 604 mg of cadmium chloride (3 mmol) was dissolved in 30 mL of oleylamine with the assistance of sonication and stirring using a magnetic stirrer bar. This solution was then heated to 90˚C with constant stirring in a three-necked flask for 1 h in air. 48 mg of sulfur dissolved in 5 mL oleylamine was then injected into the mixture dropwise. The solution was then heated to 160˚C under a N2 atmosphere and left for 6 h under vigorous stirring. After leaving to cool overnight, the nanoparticles were then collected using centrifugation (5000 rpm for 10 min) and were thoroughly washed with acetone five times to ensure all solvent and excess ligand had been removed.
1.3 Synthesis of single-layer molybdenum disulphide (s-MoS2)
Single-layer MoS2 (s-MoS2) was synthesised by the Tsang group following a well-documented route of exfoliation of bulk MoS2 with lithium intercalation.[5,6] Initially the black MoS2 powder was soaked for 48 h in 1.6 M solution of n-butyl lithium in hexane under N2 atmosphere. After this initial intercalation step of MoS2 with lithium, the LixMoS2 was then repeatedly washed with hexane to remove excess butyl lithium and dried under N2 atmosphere. The powder was then sonicated in DI water for 48 h to assist exfoliation. The reaction between water and intercalated lithium forms H2 between the layers and the gas expansion tends to separate the MoS2 layers until the layers become completely separated and Electronic Supplementary Material (ESI) for ChemComm.
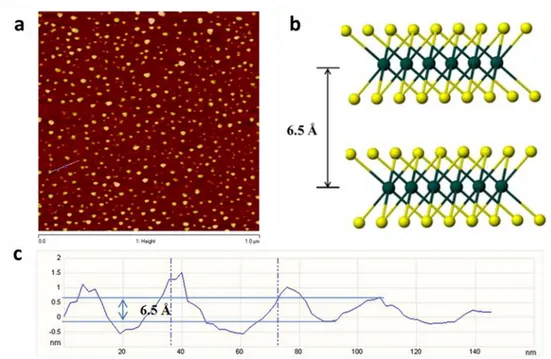
suspended in the aqueous solution. The product was filtered, washed extensively with water and ethanol and then dried under vacuum. Atomic force microscopy (AFM) image of the synthesised s-MoS2 can be found in the reference no. 6 (summarised in Figure S5).
1.4 Acid treatment of CNTs
Following a method reported by E. Flahaut et al.,[7] initially 200 mg of raw CNTs were placed into 200 mL 3M HNO3 solution in a 500 mL pyrex flask and sonicated for 30 min then refluxed under vigorous stirring for 24 h at 130˚C. The black suspension was then washed three times with 100 mL DI water before drying the product at 80˚C in air overnight. 1.5 Synthesis of CdS/CNT/s-MoS2 nanocomposites
CdS/CNT/s-MoS2 composites were synthesised using a modified CdS-graphene oxide-MoS2 by T. Jia et al.[8] Initially, 100 mg CdS, 2 mg s-MoS2 and acid treated CNTs (0.4, 2, 5 and 7mg) in 50 mL ethanol were sonicated for 4 h and then stirred at room temperature for a further 24 h. The suspensions were filtered using a 0.2 μm membrane and washed with 250 mL ethanol. The sample was then vacuum dried at 80˚C in air overnight.
2. Catalyst characterizations
2.1 Transmission electron microscopy (TEM)
TEM images were taken using a JEOL 2100 Transmission Electron Microscope at 200 kV. The sample particles were deposited on an Agar Scientific Holey carbon supported copper 400 mesh grid. TEM samples were prepared by sonicating a suitable amount of material in 1 mL ethanol for 15 minutes before drop wise adding the solution onto the copper grid.
2.2 X-ray diffraction (XRD)
Powder X-ray profiles were obtained on a PANalytical X’Pert Pro Diffractometer by mounting a glass sample slide with the pressed powdered material onto a sample slide holder inside the diffractometer. The intensity of the diffracted beams was measured as a function of the 2θ angle, usually in the range of 10-80°.
2.3 Fourier transform infrared spectroscopy (FTIR)
FTIR spectra were acquired using a Nicolet 6700 ATR-IR spectrometer with a liquid-nitrogen-cooled detector. The solid samples were pressed onto the smart golden gate- ZeSe/diamond crystal. The spectra were obtained by averaging 128 scans with a resolution of 2 cm-1 over the wavenumbers ranging from 1000-3500 cm-1.
2.4 Raman spectroscopy
Raman spectra were recorded using a Perkin-Elmer Raman Station 400. This instrument is a bench-top spectrometer with laser excitation wavelength at 785 nm and CCD detector. Powder samples were prepared by placing the powder on a glass slide.
UV-vis absorption spectra were taken using a Varian 100 Bio UV-Visible Spectrometer in absorbance mode in the range 200-800 nm with a step interval of 1 nm. Samples were prepared by sonicating 2 mg of sample in 10 mL ethanol for 15 minutes before putting the sonicated solution into an optical glass cuvette. Ethanol was thus used as the reference.
2.6 Steady-state and time-resolved photoluminescence spectroscopy
Steady-state and time-resolved photoluminescence (PL) measurements were acquired using a time-correlated single photon counting (TCSPC) setup (FluoTime 300, PicoQuant GmbH). Samples were excited using 405nm laser pulsed at frequencies of 40MHz (for steady state measurements) and 10MHz (for time-resolved measurements). The PL was collected using a high resolution monochromator and hybrid photomultiplier detector assembly (PMA Hybrid 40, PicoQuant GmbH). Parameters describing the photoluminescence were obtained by fitting the background-corrected PL with a decay equation of emission intensity I(λ,t) at the time (t) and wavelength (λ) of the form:
𝐼(𝜆, 𝑡) = 𝐼0(𝜆, 𝑡 = 0) ∑ 𝑎𝑖𝑒𝜏𝑡𝑖
Where τi is the characteristic lifetime of the ith decay component, ai is the subsequent decay amplitude, and I0(λ) is the emission intensity at time t=0. Errors in the fitting parameters were determined by examining the adjusted r-squares obtained by independently varying each fitting parameter.
For ease of comparison of lifetimes between CdS samples with different cocatalysts, the intensity weighted average lifetime is given by:
𝜏𝑎𝑣𝑔= ∑ 𝑎𝑖𝜏𝑖 2
∑ 𝑎𝑖𝜏𝑖 = ∑ 𝑓𝑖𝜏𝑖
Where fi is the fractional contribution of each decay components and the denominator is over all amplitudes and decay times which is proportional to the total intensity.[9]
For PL and TRPL measurements, a proportion of sample was extracted from the mixture: A: 100 mg CdS; B: CdS/DWNT (100 mg CdS + 5mg DWNT); C: CdS/s-MoS2 (100 mg CdS + 2mg s-MoS2); D: CdS/5mg DWNT/s-MoS2 (100 mg CdS + 5mg DWNT+ 2mg s-MoS2); E: CdS/5mg SWNT/s-MoS2 (100 mg CdS + 5mg SWNT+ 2 mg s-MoS2); F: CdS/5mg MWNT/s-MoS2 (100 mg CdS + 5mg MWNT+ 2 mg s-MoS2)
3. Photocatalytic testing
Photocatalytic H2 evolution experiments were performed in a 500 mL sealed Pyrex flask at ambient temperature and atmospheric pressure. The reactor was positioned 10 cm away from the 500 W UV-vis lamp. In a typical photocatalytic experiment, 20 mg catalyst was suspended in 90 mL DI water and 10 mL lactic acid and sonicated for 30 min. Prior to irradiation, the suspension was bubbled with 5 % CH4/Ar for 15 min to remove the dissolved oxygen and to ensure the reaction was under anaerobic conditions, the CH4 acted as an
internal reference for gas chromatography calibration. Continuous magnetic stirring was applied in order to keep the photocatalyst particles suspended during the irradiation. A 20 mL sample of the generated gas was collected and analysed by Agilent 7890A gas chromatography with TCD detector.
In the Figure 1 of the main manuscript, hydrogen evolution rate for 20 mg catalysts was taken from the mixture and measured. A: CdS (100 mg); B: CdS/DWNT (100 mg CdS +0.4g DWNT); C: s-MoS2; D: CdS/s-MoS2 (100 mg CdS + 2 mg s-MoS2); E: CdS/2mg DWNT/s-MoS2 (100 mg CdS +2mg DWNT+ 2 mg s-DWNT/s-MoS2); F: CdS/5mg DWNT/s-DWNT/s-MoS2 (100 mg CdS +5mg DWNT+ 2 mg s-MoS2); G: CdS/7mg DWNT/s-MoS2 (100 mg CdS +7mg DWNT+ 2 mg s-MoS2), etc.
Supporting figures and tables
Figure S1 (a) X-ray diffraction pattern; (b) UV-visible absorption spectrum; (c) TEM image; (d) nanoparticle diameter size distribution of synthesised CdS nanoparticles.
10 nm 10 nm
Figure S2A TEM image of CdS/s-MoS2 nanocomposite, which reveals the aggregation of CdS nanoparticles on the basal planes and the edges of re-stacked s-MoS2.
Figure S2B Typical HR-TEM images of (a) raw SWNT; (b) raw DWNT; (c) acid-treated SWNT; (d) acid-treated DWNT
(a)
(b)
Figure S2C: Left: A typical HR-TEM image of CdS/DWNT/s-MoS2, the marked areas rich in compound(s) were confirmed by EDX; Right: Selected area of CdS nanoparticle with
corresponding fast-Fourier Transform (FFT).
Table S1 The AD/AG and ID/IG ratios of the raw and acid treated CNTs.
Sample
A
D/A
GI
D/I
G SWNT-raw 0.0261 0.0821 SWNT-Acid 1.431 0.4305 SWNT Ratio increment (acid/raw) 54.828 5.244 DWNT-raw 0.263 0.1404 DWNT-Acid 1.221 0.6894 DWNT Ratio increment (acid/raw) 4.643 4.910 MWNT-raw 0.0918 0.3490 MWNT-Acid 1.15 0.7265 MWNT Ratio increment (acid/raw) 12.527 2.082Figure S5 Atomic force microscopy (AFM) image analyses for the fresh chemically exfoliated s-MoS2- refer to reference 6 (a, AFM image of spin coated s-MoS2 and b, a model of 2-H MoS2 structure perpendicular to c axis, 100 flakes is scanned with majority of heights between 0.6-0.7nm. The sample was prepared by spin-coating s-MoS2 onto a surface of Si/SiO2 substrate. The lateral dimension of this s-MoS2 nanosheet is approximately 20-40 nm. c, It can be seen that the step heights of individual layers of 0.6-0.7 nm. This value is comparable to ca. 0.65 nm of a single layer of the S-Mo-S building block. Statistical analysis of 100 flakes produced by the lithium exfoliation method revealed that 56% of the flakes to be monolayer, 28% of two layers and 13% of three layers and so on. The average topographic height is around 1.04 nm, which agrees with typical height of a s-MoS2 with the presence of water molecules (between 0.6 and 1.0 nm).
Photo-corrosion of CdS quantum dots on Carbon Nanotubes
It is well accepted that the competition reaction such as sulphide oxidation induced by the positive charged hole instead of carrying out the highly activated oxidation process of water molecule to oxygen and proton, can cause photo-corrosion of CdS semiconductor. However, photocatalytic hydrogen production from the reduction of proton in solution over the defined material components was the main focus of this work, we had thus tried to avoid the issue of photo-corrosion. Using a reducing agent used as the hole scavenger in aqueous solution is a well-known strategy to stabilize CdS from the photo-corrosion. In this study, lactic acid was therefore used as the sacrificial reagent to suppress the photo-corrosion of CdS with the lactic acid preferentially oxidised into pyruvic acid. Thus, in this system, we did not evaluate the extent of photo-corrosion of CdS quantum dots with or without CNTs (we did not encounter this problem by using lactic acid as the sacrificial reductant). On the other hand, the high surface area CNTs with high intrinsic electronic conductivity, are expected to reduce the local positively charge (hole) built up over the CdS quantum dots together with higher
concentration of adsorbed lactic acid, that can in principle greatly reduce the extent of photo-corrosion. However, these anticipations should be carefully verified.
References
1. E. Flahaut, R. Bacsa, A. Peigney, C. Laurent, Chem. Commun. 2003, 12, 1442-1443. 2. E. Flahaut, A. Peigney, W. S. Bacsa, R. R. Bacsa and Ch. Laurent, J. Mater. Chem.
2004, 14, 646-653.
3. L. García- Hevia, R. Valiente, J. L. Fernández-Luna, E. Flahaut, L. Rodríguez-Fernández, J. C. Villegas, J. González, M. L. Fanarraga, Adv. Health Mater. 2015, 4, (11), 1640–1644.
4. J. Joo, H. B. Na, T. Yu, J. H. Yu, Y. W. Kim, F. Wu, J. Z. Zhang, T. Hyeon, J. Am. Chem. Soc. 2003, 125, 11100-11105.
5. P. Joensen, R. F. Frindt, S. R. Morrison, Mat. Res. Bull. 1986, 21, 457-461.
6. T. Jia, M. M. J. Li, L. Ye, S. Wiseman, G. Liu, J. Qu, K. Nakagawa, S. C. E. Tsang, Chem. Commun. 2015, 51, 13496-13499.
7. T. Bortolamiol, P. Lukanov, A-M. Galibert, B. Soula, P. Lonchambon, L. Datas, E. Flahaut, Carbon 2014, 78, 79-90.
8. T. Jia, A. Kolpin, C. Ma, R. C.-T. Chan, W.-M. Kwok, S. C. E. Tsang, Chem. Commun. 2014, 50, 1185-1188.
9. J. Seo, R. Fudala, W. J. Kim, R. Rich, B. Tabibi, H. Cho, Z. Gryczynski, I. Gryczynski, W. Yu, Opt Mater Express 2012, 2, 1026-1039.