HAL Id: hal-03021512
https://hal.archives-ouvertes.fr/hal-03021512
Preprint submitted on 24 Nov 2020
HAL is a multi-disciplinary open access archive for the deposit and dissemination of sci-entific research documents, whether they are pub-lished or not. The documents may come from teaching and research institutions in France or abroad, or from public or private research centers.
L’archive ouverte pluridisciplinaire HAL, est destinée au dépôt et à la diffusion de documents scientifiques de niveau recherche, publiés ou non, émanant des établissements d’enseignement et de recherche français ou étrangers, des laboratoires publics ou privés.
To cite this version:
Jacob Warner, Aldine Amiel, Hereroa Johnston, Eric Röttinger. Regeneration is a partial redeploy-ment of the embryonic gene network. 2020. �hal-03021512�
Regeneration is a partial redeployment of the embryonic gene network
Jacob F. Warner †, Aldine R. Amiel, Hereroa Johnston, and Eric Röttinger*
Université Côte d’Azur, CNRS, INSERM, Institute for Research on Cancer and Aging, Nice (IRCAN), Nice, France
*Please direct correspondence to: Eric Röttinger
T: +33 (0)6 63 97 01 78 E: [email protected]
†
Present address: University of North Carolina Wilmington, Department of Biology and Marine Biology, Wilmington, NC 28403, USA.
Abstract
For more than a century, researchers have been trying to understand the relationship between embryogenesis and regeneration (Morgan 1901). A long-standing hypothesis is that biological processes originally used during embryogenesis are re-deployed during regeneration. In the past decade, we have begun to understand the relationships of genes and their organization into regulatory networks responsible for driving embryogenesis (Davidson et al. 2002; Röttinger et al. 2012) and regeneration (Srivastava et al. 2014; Lobo and Levin 2015; Rodius et al. 2016) in diverse taxa. Here, we compare these networks in the same species to investigate how regeneration re-uses genetic interactions originally
set aside for embryonic development. Using a uniquely suited embryonic
development and whole-body regeneration model, the sea anemone Nematostella
vectensis, we show that at the transcriptomic level the regenerative program
partially re-uses elements of the embryonic gene network in addition to a small cohort of genes that are only activated during regeneration. We further identified co-expression modules that are either i) highly conserved between these two developmental trajectories and involved in core biological processes or ii) regeneration specific modules that drive cellular events unique to regeneration. Finally, our functional validation reveals that apoptosis is a regeneration-specific process in Nematostella and is required for the initiation of the regeneration program. These results indicate that regeneration reactivates embryonic gene modules to accomplish basic cellular functions but deploys a novel gene network logic to activate the regenerative process.
Introduction
Regeneration of cells, tissues, appendages or even entire body parts is a widespread yet still rather poorly understood phenomenon in the animal kingdom. A long-standing question in the field of regeneration is whether and to what extent embryonic gene programs that are initially used to build an organism are re-used during regeneration (Morgan 1901). Several transcriptomic studies of regeneration have highlighted the importance of re-deployed developmental pathways in axolotl, anole, zebrafish and sea anemones (Bryant et al. 2017) (Habermann et al. 2004) (Hutchins et al. 2014) (Mathew et al. 2009) (Rodius et al. 2016) (Gardiner et al. 1995; Schaffer et al. 2016). Many studies have directly compared embryonic and regenerative gene expression of single or groups of genes identifying i) genes that are specific to embryonic development (Binari et al. 2013), ii) genes that are specifically expressed or required during regeneration (Millimaki et al. 2010; Katz et al. 2015), and iii) embryonic genes that are re-used during regeneration to some extent (Imokawa and Yoshizato 1997) (Carlson et al. 2001) (Torok et al. 1998) (Özpolat et al. 2012) (Wang and Beck 2014). To date, however, no study has systematically compared the global transcriptomic landscape of embryogenesis and regeneration. The sea anemone Nematostella (Cnidaria, Anthozoa) is a uniquely suited embryonic and whole body regeneration model and is ideal for this line of inquiry (Fig. 1A). Nematostella has long been used as a model system for embryonic development, the evolution of body patterning, and gene regulatory networks (Hand and Uhlinger 1992; Wikramanayake et al. 2003; Hutchins et al. 2014; Wang and Beck 2014). More recently, Nematostella has emerged as a powerful whole-body regeneration model as it capable of re-growing missing body parts in less than a week (Burton and Finnerty 2009; Trevino et al. 2011; Passamaneck and Martindale 2012; Bossert et al. 2013; Dubuc et al. 2014; Amiel et al. 2015; Schaffer et al. 2016) Regeneration in Nematostella follows a dynamic but highly stereotypical morphological and cellular program involving tissue re-arrangement and the de novo formation of body structures (Amiel et al. 2015). Initiation of this process requires a crosstalk between tissues and two populations of fast and slow cycling stem cells (Amiel et al, in revision). Many developmental
signaling pathways are deployed during regeneration (Trevino et al. 2011) (Dubuc et al. 2014) (Schaffer et al. 2016) however their regulatory logic remains unknown. Here, we take advantage of this model to definitively address the historical hypothesis that regeneration re-uses embryonic gene network logic to decipher genetic signatures unique to regeneration. We performed a genome wide embryogenesis vs regeneration transcriptomic comparison using deeply sampled transcriptomic datasets in order to identify gene modules specific to regeneration.
Results and Discussion
Regeneration is a partial re-deployment of embryonic development
To compare embryogenesis and regeneration on a global transcriptome-wide scale we employed four RNAseq datasets, one spanning 16 time points of regeneration (Warner et al., 2018) and three spanning a total of 34 embryonic time points (Helm et al. 2013; Fischer and Smith 2014; Warner et al. 2018). In order to directly compare the data, raw sequencing reads were processed, mapped and quantified using the same workflow for all datasets (see materials and methods for quantification details). As the embryonic data were the result of several previous studies including this one we applied a batch correction using developmental time-point as a categorical covariate (Fig. S1) (Leek et al. 2012). To assess the transcriptomic states underlying embryogenesis we performed principal component analysis (PCA) on batch corrected embryonic data (Fig. 1B). We found that the majority of gene expression changes occur during the first day of embryonic development from cleavage to blastula stage (Fig. 1B, 7 hours post fertilization (hpf) – 24hpf, PC1 proportion of variance 61%; PC2 proportion of variance 19%) indicating large transcriptomic differences in early embryogenesis. From 96hpf onwards the samples exhibited modest changes in transcriptional variation indicating that the major events of embryogenesis are complete by this stage (96hpf-240hpf). When we examined the regenerative program using PCA (Fig. 1C), we observe three distinct transcriptional programs: a wound-healing phase (0-8hpa) is followed by the activation of the early regenerative program (8-20 hours post amputation (hpa)) in which the samples are distributed along the
second principal component (PC2 proportion of variance = 24%, Fig. 1C). From 20hpa onwards, the majority of variation in gene expression is explained by the first principal component during the late regenerative phase (PC1 proportion of variance = 48%, 20hpa-144hpa, Fig.1C). Towards the end of regeneration, we observe the transcriptomics profile approaching the uncut samples indicating a return to steady state. These profiles correlate with the major events of sub-pharyngeally induced oral regeneration in Nematostella and indicate that our sampling strategy effectively covers the major transcriptional hallmarks of regeneration (Amiel et al. 2015).
We then directly compared the transcriptomic variation of regeneration and embryogenesis using the same PCA approach and found that the transcriptional changes during regeneration were relatively modest compared to those observed during embryogenesis with the vast majority of variation in the first two principal components being driven by the embryonic data (PC1 proportion of variance = 67%, PC2 proportion of variance = 16%, Fig 1D). This indicates that the transcriptional dynamics of embryogenesis are more profound than those of regeneration. This finding was buttressed by comparing the number of ‘dynamically expressed genes’, those which are significantly differentially expressed (fold change > log2(2) and false discovery rate < 0.05) at any time point
compared to t0, 0hpa for regeneration and 7hpf (onset of zygotic transcription) for
embryogenesis. Embryogenesis exhibited more than ten times the number of dynamically expressed genes compared to regeneration (15610 and 1255 genes respectively, Fig. 1E). These results show that regeneration employs far fewer genes to accomplish the same task of constructing a functional animal. Of these genes however, the majority are re-expressed embryonic genes demonstrating that regeneration is in large part a partial re-use of the embryonic gene complement (Fig. 1E).
Among those genes dynamically expressed during regeneration, a small fraction, 124 genes, exhibit differential expression (fold change > log2(2) and false
discovery rate < 0.05) only during regeneration which we term ‘regeneration specific’ (Supplementary table 1). Indeed 48 of these genes are only detectable during regeneration indicating they are transcriptionally silent until regeneration activation (Fig. 1F). Interestingly, several of the 124 regeneration specific genes, for example wntless (jgi|Nemve1|100430) and agrin (jgi|Nemve1|196727), have previously been reported to be important regulators of regeneration in bilaterians (Adell et al. 2009; Bassat et al. 2017). Furthermore among these 124 regeneration specific genes, 45 have no known homology in the Uniprot database (PLASTp, e-value cutoff <0.05, see methods for annotation details). These results indicate not only a possible evolutionary conservation of gene use in regeneration, but also identify additional genes that may play important roles in whole body regeneration. When we performed a gene ontology (GO) term enrichment analysis on these regeneration specific genes, we found a suite of biological process GO terms relating to Wnt protein secretion (e.g. wntless), metabolic processes and apoptotic cell death, indicating an essential role for these processes in regeneration (Fig. 1G).
Embryonic gene modules are partially re-deployed during regeneration
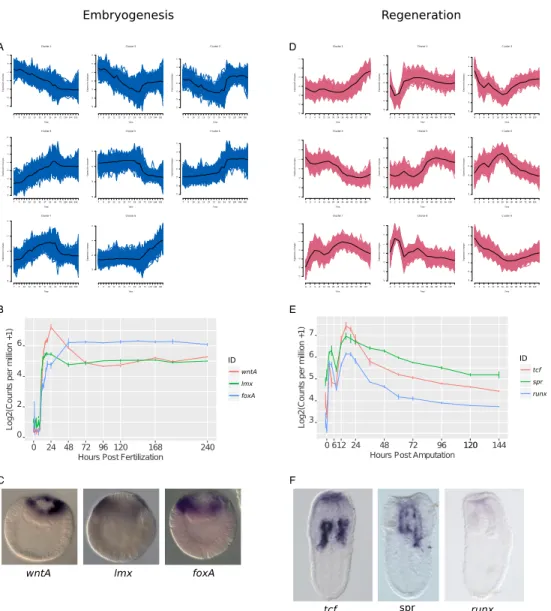
As regeneration uses less than one tenth the number of genes compared to embryonic development we were next interested in how these genes were deployed and arranged into expression networks. We sought to determine if embryonic gene network modules themselves are reused in a reduced capacity or if regeneration deploys novel gene module arrangements. To investigate this we first used fuzzy c-means clustering to group the genes by expression profile (Kumar and E Futschik 2007). We regrouped the gene expression profiles into eight embryonic clusters (Fig. 2A) and nine regeneration clusters (Fig. 2D). To explore these expression clusters we performed GO-term enrichment for each cluster (Table S1, Table S2). When we examined modules at the gene level, we found that modules that were activated early in both processes (embryogenesis
cluster 4, regeneration cluster 6, Fig. 2A,D) contained many canonical developmental genes: wntA (jgi|Nemve1|91822), lmx (jgi|Nemve1|95727) and
foxA (jgi|Nemve1|165261) in embryonic cluster 4 (Fig. 2B) and tcf
(jgi|Nemve1|132332), spr (jgi|Nemve1|29671), and runx (jgi|Nemve1|129231) in regeneration cluster 6 (Fig. 2B). The early activation of these genes was confirmed by in situ hybridization at 24hpf (embryogenesis, Fig. 2C) and 20hpa (regeneration) and (Fig. 2F). From this analysis we conclude that classical developmental genes are involved in the early phases of both embryogenesis and regeneration.
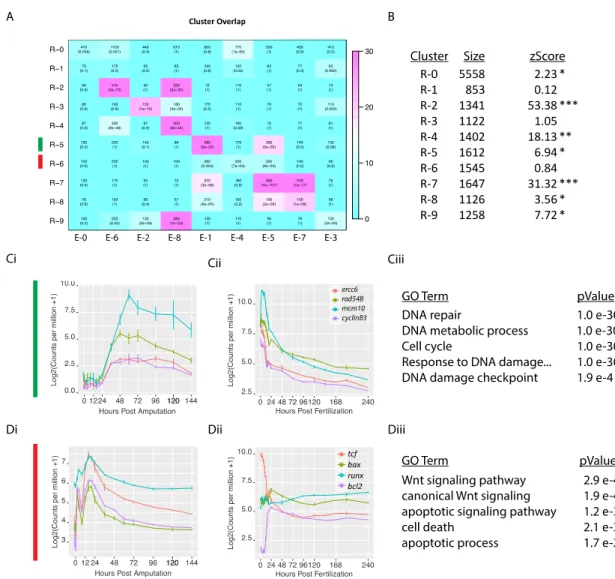
We next analyzed whether the same groups of genes were co-regulated during embryogenesis and regeneration, by testing if gene expression observed during both processes were arranged in similar co-expression modules. We compared regeneration and embryonic clusters on a gene-cluster membership basis to identify significant overlaps. Regeneration clusters with high overlap of a specific embryonic cluster indicate a shared or re-used network logic since the same suite of genes are deployed as a bloc in both processes. Regeneration clusters with low overlap to any single embryonic cluster on the other hand are likely to be de novo genetic arrangements specific to regeneration. We found that the majority of the regeneration clusters exhibited significant overlap with one or more embryonic clusters (Fig. 3A, B). These ‘conserved modules’ also exhibited high preservation permutation co-clustering zStatistics (>2 indicating conservation; >10 indicating high conservation; permutations = 1000) (Langfelder et al. 2011). Importantly, we also identified two clusters, R-1 and R-6, which exhibited relatively low overlap with embryonic clusters, indicating that these are ‘regeneration specific’ arrangements. When we examined the GO-term enrichment of each cluster, we found that in general, highly conserved clusters were enriched in GO-terms corresponding to homeostatic cell processes while lowly conserved regeneration specific clusters were enriched in GO-terms describing developmental signaling pathways (Fig. 3A, Supplementary tables 1 & 2). These results suggest that core biological functions such as cell proliferation are common to embryogenesis and regeneration while
the developmental gene networks that activate these processes are unique. Two clusters that exemplify these findings are R-5 and R-6. R-5, a conserved cluster (zStatistic 6.94) showed strong enrichment of cell-proliferation related GO-terms (Fig. 3C). When we examined exemplar genes (with intra module membership scores >0.95) ercc6-like (jgi|Nemve1|110916), rad54B (jgi|Nemve1|209299),
mcm10 (jgi|Nemve1|131857), cyclinB3 (jgi|Nemve1|208415), we observed
co-expression patterns that correlate well to the timing of proliferation activation during
Nematostella regeneration with an activation at 24hpa, a peak at 48hpa, and a
taper off thereafter (Passamaneck and Martindale 2012; Amiel et al. 2015)(Fig. 3C). These exemplar genes are also co-expressed during embryogenesis (cluster E-1), further demonstrating module conservation. In contrast to this conserved module is the regeneration specific module R-6. This module showed strong enrichment of GO-terms relating to apoptosis and developmental signaling pathways. When we examined 4 exemplar genes tcf (jgi|Nemve1|132332), bax (jgi|Nemve1|100129), runx (jgi|Nemve1|129231), bcl2 (jgi|Nemve1|215615), we observed co-expression during regeneration but divergent profiles during embryogenesis indicating that this grouping of genes is indeed ‘regeneration specific’ (Fig 3D). These results suggest that modules containing genes responsible for basic cellular functions are largely re-used and co-expressed between embryogenesis and regeneration, while those including genes that are important for the activation of developmental processes are regeneration-specific arrangements.
Apoptosis is specifically required for regeneration Nematostella vectensis
Having observed a strong enrichment for apoptosis related GO-terms in the list of 124 regeneration-specific genes (Fig. 1F,G) and in the regeneration specific module R-6 (Fig. 3Di-Diii), we investigated the role of apoptosis during the regenerative process. Several genes relating to apoptosis, including the regeneration-specific genes bax (jgi|Nemve1|100129), caspase-3
(jgi|Nemve1|100451), bcl2 (jgi|Nemve1|215615), and an additional bcl2 (which we term bcl2B, jgi|Nemve1|128814), belong to module R-6 and are activated shortly
after amputation (Fig. 4A). We performed a time series of TUNEL staining to examine the dynamics of apoptosis during embryogenesis and regeneration. While only few apoptotic cells can be observed during embryonic development (data not shown), we observed a burst of apoptotic activity after amputation at the cut site as early as 1.5 hpa which perdured through 12hpa (Fig. 4B, Fig. S3). At 24hpa apoptotic activity is not detectable anymore at the wound site but randomly detected throughout the body, and at 60hpa, increasingly restricted around the mesenteries. To test whether or not apoptosis was indeed a regeneration specific process we used the pan-caspase inhibitor ZVAD to block apoptosis during embryogenesis and regeneration. Nematostella treated continuously with ZVAD after fertilization developed normally, showed no developmental defect (Fig. 4Ci) and metamorphosed on time (not shown). In contrast, regenerating Nematostella treated continuously with ZVAD immediately after amputation were blocked in a very early regenerative stage, preventing the physical interaction between the fused oral tip of the mesenteries and the epithelia of the wound site (Fig. 4Cii). Furthermore, amputated animals treated with ZVAD exhibited little to no cell proliferation indicating an instructive function of apoptosis necessary for the induction of cell proliferation and the ensuing regenerative program (Fig. 4Cii).
In this work we used whole genome transcriptomic profiling to identify shared embryonic and regeneration-specific gene signatures. By comparing embryonic and regenerative gene expression modules, we identified a gene module deployed early in regeneration that involves apoptosis, a developmental process we then show to be specific to whole body regeneration in Nematostella. While the importance of apoptosis in regeneration has been previously proposed in Hydra (Chera et al. 2009), we conclude from our work that the instructive function of apoptosis is a regeneration-specific process in Nematostella and may represent a process common to all whole body regenerators. Furthermore, we show that embryonic gene modules, including those coding for cell proliferation and homeostatic processes are to a significant extent re-activated during the regenerative process. Thus, regeneration is a partial re-use of the embryonic
genetic programs but with important differences in its activation, which in the case of Nematostella, depends on apoptotic signals. The approach used to identify these genetic programs, comparative transcriptional profiling, highlights the utility in considering not just individual gene use but how those genes are arranged into co-expression modules. Here we investigated one module and the role apoptosis plays in regeneration but we anticipate further studies on gene module use during embryogenesis and regeneration as the community continues to investigate expression dynamics during these two processes thanks in part to a database containing all of the data from this study (Warner et al. 2018). Further studies, especially those comparing regeneration activation across species, will provide novel insight into our understanding of why certain organisms can regenerate while others can’t and could unlock hidden regenerative potential in poorly regenerating organisms.
Acknowledgements:
We thank Marina Shkreli (IRCAN), Eric Gilson (IRCAN) and Gianni Liti (IRCAN) for suggestions and critical reading of the manuscript as well as Valérie Carlin for animal husbandry and care. The authors also acknowledge the IRCAN’s Molecular and Cellular Core Imaging (PICMI) Facility. PICMI was supported financially by FEDER, Conseil régional Provence Alpes-Côte d’Azur, Conseil départemental 06, Cancéropôle PACA, Gis Ibisa and INSERM.
This work was supported by an ATIP-Avenir award (Institut National de la Santé et de la Recherche & Centre National de Recherche Scientifique) funded by the Plan Cancer (Institut National du Cancer, C13992AS), Seventh Framework Programme (CIG #631665), Association pour le Recherche sur le Cancer (Fondation ARC, #PJA2014120186) to E.R. as well as the Fondation ARC (#PDF20141202150) to J.F.W., Fondation pour la Recherche Médicale to A.R.A (#SPF20130526781) and H.J (#FDT20170437124) and Ministère de l'enseignement Supérieur et de la Recherche to H.J..
● ● ● ● ● ● ●● ● ● ● ● ● ● ●● ●100 ●50 0 50 100 ●100 ●50 0 50 100 PC1 48% P C 2 2 4 % HPA ● ● ● ● ● ● ● ● ● ● ● ● ● ● ● ● ●1 0 2 4 8 12 16 20 24 36 48 60 72 96 120 144 ●● ● ● ● ● ● ● ● ● ● ● ●●● ● ● ● ● ● ● ● ● ●●● ●100 0 100 ●200 ●100 0 100 200 PC1 68% P C 2 2 0 % Dataset ● ● ● Fischer Helm Warner ●● ●● ● ● ●● ● ●● ● ●● ● ● ● ● ● ● ● ● ●● ● ● ● ● ● ● ●●● ● ● ● ●●●●● ● ●100 ●50 0 50 100 150 ●200 ●100 0 100 PC1 67% P C 2 1 6 % Dataset ● ● ● ● Fischer Helm Regeneration Warner Injury End of wound healing ‘Dynamic’ Embryogenesis ‘Dynamic’ Regeneration 14479 1131 124 ‘Dynamic’ Both B ● ● ● ● ● ● ● ● ● ● ●●● ● ● ● ● ● ● ● ●● ● ● ● ● ●● ● ● ● ● ● ● ● ● ● cyclic nucleotide catabolic process
positive regulation of neuron death folic acid metabolic process
carbohydrate derivative metabolic process negative regulation of nucleotide catabolic process
cAMP catabolic process
alpha●amino acid metabolic process
regulation of Wnt protein secretion Wnt protein secretion apoptotic cell clearance
positive regulation of apoptotic process involved in development intrinsic apoptotic signaling pathway in response to DNA damage
positive regulation of apoptotic DNA fragmentation
●15 ●10 ●5 0 5 10 15 ●15 ●10 ●5 0 5 10 semantic space y s e m a n ti c s p a c e x ●5 ●4 ●3 ●2 ●1 0 Log10 ●p value Size 1 2 3 4 5 ‘Dynamic’ Regeneration GO Term Enrichment C A D E F G Blastula 12hpf Cleavage 7hpf 24hpf Gastrula 240hpf Juvenile 7hpf 24hpf 240hpf Regenera t ion
124 'Dynamic' regeneration genes Expressed in embryo:
Not expressed in embryo: Uniprot match: No Uniprot match: 76 48 79 45
Figure 1: Comparison of embryonic and regenerative transcritpomes. (A)
General morphology of Nematostella during embryonic development and regeneration. (B) Principal component analysis (PCA) of three embryonic datasets: Fischer et al. (red), sampled at 7, 8, 9, 10, 11, 12, 13, 14, 15, 16, 17, 18, 19 hpf; Helm et al. (green), sampled at 7, 12, 24, 120, 240 hpf and Warner et al. (blue) sampled at 24, 48, 72, 96, 120, 144. 168, 192 hpf. The majority of variation is observed in the first 24 hours of development. (C) PCA of regeneration dataset sampled at Uncut, 0, 2, 4, 8, 12, 16, 20, 24, 36, 48, 60, 72, 96, 120, 144 hpa. Regeneration proceeds through a wound healing phase (0-8 hpa) followed by the early regenerative program (12-36 hpa) and ending with a late regenerative program which approaches the uncut condition (48-144 hpa). (D) PCA of embryonic versus regeneration samples. Embryogenesis (red, green, purple) exhibits far greater transcriptomic variation than regeneration (blue). (E) Comparison of differentially expressed (|FC| > log2(2) & FDR < 0.05 for any
timepoint comparison against t0 where t0 = 7hpf for embryogenesis and 0hpa for
regeneration) ‘dynamic’ genes during embryogenesis (blue) and regeneration (green). Embryogenesis deploys more than 10 times the number of genes. 124 genes are only dynamically expressed during regeneration. (F) Details of the regeneration specific genes expression and classification. (G) GO term enrichment for regeneration specific genes.
Figure 2: Embryonic and Regenerative gene expression forms discrete clusters. (A,D) Fuzzy c-means clustering of embryonic (A) and regeneration (D)
gene expression. Each cluster is plotted with standardized expression along the y-axis and developmental time along the x-y-axis. Black trace denotes the cluster core (centroid). (B-C) Exemplar gene expression from a cluster activated early during embryogenesis in the cluster E-4. wntA, lmx, foxA are temporally co-expressed (B) and in situ hybridization at 24hpf confirms early activation of this gene cluster (C). (E-F) Exemplar gene expression from a cluster activated in the early regenerative program. tcf, spr, runx are all activated early in the cluster R-6 and are temporally
co-expressed (E) and in situ hybridization at 24hpa confirms early activation of this gene cluster (F).
Figure 3: Embryonic gene modules are partially redeployed during regeneration. (A) Overlap table of regeneration versus embryonic modules. In
each cell, the overlap itself is quantified along with the pvalue (fischers exact test). Color indicates –log10(pvalue), with a brighter magenta indicating a more
significant overlap. R-0 and E-0 contain genes that are not assigned to any module. (B) Table indicating the size, and the co-clustering zStatistic. A zStatistic >2 (*) indicates moderate module conservation, >10 (**) high sconervation > 30 (***)very high conservation). (C) The conserved module R-5 with exemplar genes
(ercc6, rad54B, mcm10, cyclinB3) showing coexpression during regeneration (Ci) and embryogenesis (Cii). GO-term enrichment identifies terms associated with cell proliferation (Ciii). (D) The regeneration specific module R-6 with exemplar genes (tcf, bax, runx, and bcl2) showing co-expression during regeneration (Di) but divergent expression during embryogenesis (Dii). GO-term enrichment identifies terms associated with apoptosis and wnt signaling (Diii).
Figure 4: Apoptosis is required for regeneration, not embryogenesis. (A)
Apoptosis genes (bax, caspase3, bcl2, and bcl2B) found in the regeneration specific module R-6 are activated early in response to injury. (B) After amputation,
apoptosis marked by TUNEL staining is localized early to the wound site at 1.5hpa and persists through 12 hpa (red arrows). At 60hpa, apoptosis is detected in the mesenteries (red arrow) and absent from the wound site. This staining continues through 60hpa where it is predominantly located within the mesenteries. (Ci) Treatment with the apoptosis inhibitor zVAD does not affect embryonic development (48hpf). (Cii) Conversely zVAD treatment blocks regeneration at an early stage. TUNEL staining of zVAD treated regenerates confirms apoptosis inhibition. Cell proliferation (Edu, red) is also strongly reduced. Autofluorescence of the pharynx does not reappear (488, green) indicating a failure of regeneration. Morphology at 144hpa also shows a clear lack of pharynx (dashed circle) and tentacles in zVAD treatment as well as the inhibition of regeneration very early during the process that is indicated by the absence of the contact between the mesenteries and the epithelia of the amputation site (Amiel et al. 2015).
Supplementary figures:
FigureS1: Embryonic sample tree pre, post batch correction.
Sample trees of embryonic log2(cpm+1) before batch correction (top) and after
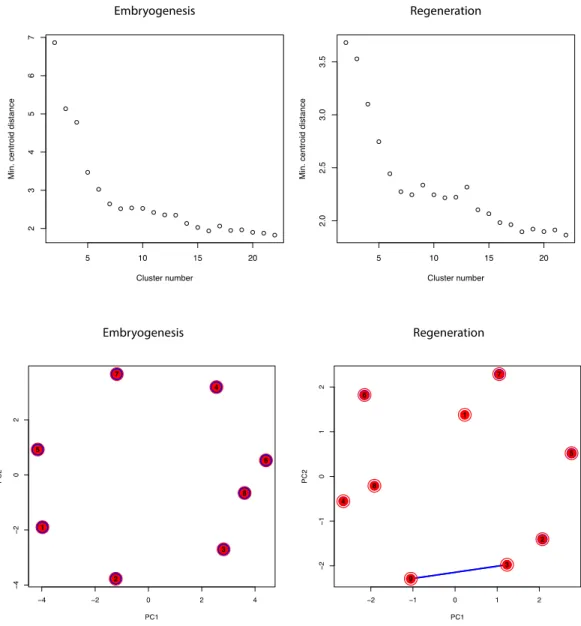
Figure S2: Fuzzy c-means clustering minimum centroid distance and cluster overlap.
(Top): Minimum centroid distances for embryogenesis (left) and regeneration (right) clusters. (Bottom): Overlap plots for embryogenesis (left) and regeneration (right) clusters show principal component analysis of the cluster centers. The overlap is visualised by lines with variable width indicating the strength of the overlap.
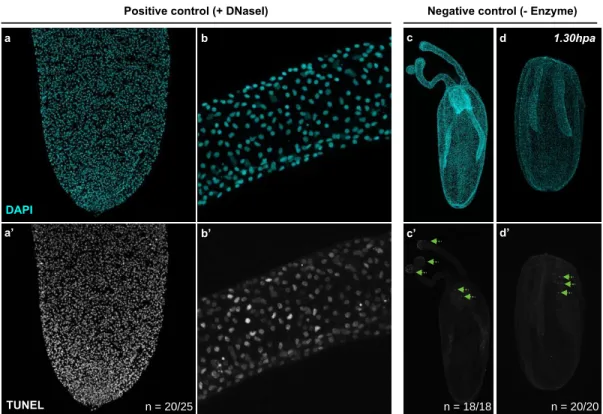
Figure S3: TUNEL Assay controls.
Close-up of the physa (a, a’) and the tentacles (b, b’) for the TUNEL assay positive control using DNAse I treatment. Uncut polyp (c, c’) and 1.50hpa (d, d’) for the TUNEL assay negative control without Enzyme. Green dashed arrows (b’, c’) indicate non-specific auto-fluorescent staining. n=[number of specimen with represented phenotype]/[total number of analyzed specimen]
Supplementary table 1: Regeneration specific genes
Supplementary table 2: GO-term enrichment of embryonic clusters Supplementary table 3: GO-term enrichment of regeneration clusters
Negative control (- Enzyme) Positive control (+ DNaseI)
b b’ a’ a d’ d c c’ DAPI TUNEL n = 20/25 n = 18/18 n = 20/20 1.30hpa
Materials and Methods
Animal culture, spawning, embryo rearing, and amputation
Adult Nematostella vectensis are cultured at 16°C in the dark in 1/3 strength artificial sea water (ASW) as previously described (Amiel et al. 2017). Spawning was induced by feeding the animals with oysters the day before and transferring the animals to a light table for 12 hours. For embryology experiments, embryos were cultured at 18°C in the dark in 1/3 strength ASW until desired timepoint. For Regeneration experiments were performed using six week old juveniles raised at 22°C in the dark in 1/3 strength artificial sea water (ASW) as previously described (Amiel et al. 2017). Amputations were performed by first relaxing the juveniles in MgCl2 followed by sub-pharygneal amputation.
RNA extraction, sequencing, read mapping and quantification
Detailed methods of the RNAseq methodology can be found in (Warner et al. 2018) and are described briefly here. For regeneration experiments, six week old juveniles were bisected below the pharynx and incubated in the dark 22°C in 1/3 strength ASW. RNA from ~350 animals was extracted as previously described at uncut, 0, 2, 4, 8, 12, 16, 20, 24, 36, 48, 60, 72, 96, 120, and 144 hours post amputation in triplicate (Warner et al. 2018). For the embryonic time series, animals were cultured at 18°C in the dark in 1/3 strength ASW and RNA from ~250 embryos was extracted as previously described at 24, 48, 72, 96, 120,144, 168, 172, and 196hpf in duplicate (Warner et al. 2018). cDNA libraries were prepared and sequenced on an illumine NextSeq500 sequencer. Additional embryonic datasets were obtained from two previously published studies originally reported in Fischer et al. (Fischer and Smith 2014) (Illumina HiSeq 100bp paired end replicates sampled hourly from 0-19 hours post fertilization), and a second embryonic dataset originally reported in Helm et al. 2013 (Helm et al. 2013) (NCBI short read archive Project: PRJNA189768)( Illumina HiSeq 50bp single end replicates sampled from 2, 7, 12, 24, 120 and 240).
All reads from each dataset were processed equivalently. Reads were first quality filtered and adapter trimmed using timmomatic (Bolger et al. 2014) and cutadapt (MARTIN 2011). Single end reads for each dataset, regeneration and the three embryonic datasets Fischer, Helm, and Warner, were aligned to a transcriptome assembly comprised of both embryonic and regeneration RNAseq data using Bowtie2 (Langmead et al. 2009; Warner et al. 2018). and read counts were quantified using RSEM (Li and Dewey 2011). Gene level counts were obtained by merging transcripts with the same top BLASTn hit to the Nemve1 filtered gene models (Warner et al. 2018). Gene models that did not have >5 counts in at least 25% of the samples, were excluded. Each dataset was then normalized separately using the R package edgeR and the counts per million (cpm) mapped reads were calculated (Robinson et al. 2010). Batch effects of the embryonic datasets were corrected using the R function ComBat from the SVA package using timepoint as a categorical covariate (Fig S1)(Leek et al. 2012).
Identification of regeneration specific genes and GO-term enrichment
For each dataset we calculated differential expression for each Nemve1 gene model using edgeR and comparing each time point to t0 (t0= 7hpf Helm and Fischer
dataset; 24hpf Warner dataset; and 0hpa for the regeneration dataset) (Fischer and Smith 2014) (Helm et al. 2013) (Warner et al. 2018). We define a significantly differentially expressed gene as having an absolute fold change (FC) > 2 and a false discovery rate (FDR) < 0.05. These differentially expressed gene lists were compared to identify overlapping and regeneration specific genes. GO term enrichment of the regeneration specific gene list was calculated using a Fisher’s exact test and the R package topGO on the GO terms identified from comparing the Nemve1 gene models to the UniProt databases Swissprot and Trembl using the BLASTx like program PLASTx (evalue cutoff 5e-5)(Nguyen and Lavenier 2009). All identified GO terms were used as a background model. The resulting GO term list was reduced and plotted using a modified R script based on REVIGO (Supek et al. 2011).
Embryonic versus Regeneration dataset comparison: Principal component analysis, Fuzzy c-means clustering and cluster conservation
The ensuing analyses were performed using log2(cpm+1) transformed gene-level
quantification (Nemve1 filtered gene models). The expression profiles for each Nemve1 gene model were clustered using the R package mFuzz (Kumar and E Futschik 2007) on the combined embryonic dataset and the regeneration dataset separately. The cluster number was set to 9 for the regeneration data and 8 for the embryonic datasets as these numbers produced well-separated clusters with minimal overlap (Fig. S2) and represent the inflection point at which the centroid distance between clusters did not significantly decrease with the addition of new clusters (Fig. S2). Genes that did not have a membership score above 0.75 were considered noise and designated as cluster 0. GO-term enrichment testing for each cluster was performed as described above. Cluster overlap was calculated for genes that were detectable in both datasets using the function overlapTable from the R package WGCNA using the regeneration cluster assignments as the reference set. A zStatistic of cluster preservation was also calculated using the function coClustering.permutationTest from the WGCNA package using the regeneration cluster assignments as the reference set and 1000 permutations.
In situ hybridization
Whole-mount in situ hybridization (WISH) was performed as previously described (Genikhovich and Technau 2009). The probes used in this study were synthetized and labeled with digoxegenin according to the protocol described in (Amiel et al. 2017), and were diluted to 0.1 ng/µl in fresh hybridization solution. Anti-Dig/AP used at 1:5000 in blocking solution and incubated at 4°C overnight.
Apoptotic cell death staining
After relaxing Nematostella polyps in MgCl2 for 10-15 minutes, animals were fixed
in 4% paraformaldehyde (Electron Microscopy Sciences # 15714) in 1/3 ASW during 1 hour at 22°C or overnight at 4°C. Fixed animals were washed three times in PBT 0.5% (PBS1x + Triton 0.5%). To detect cell death the “In Situ Cell Death
AP kit” (Roche, #11684809910) was used. The manufacturer protocol was modified as follow: 1) Fixed animals were permeabilized using 0.01mg/ml Proteinase K for 20min at 22°C; 2), Washed twice in PBS1x; 3) Refixed in 4% paraformaldehyde in PBS1x for 1 hour at 22°C; 4) Washed 5 times in PBS1x; 5) Incubated with 50μL of TUNEL reaction mixture for one hour (Roche protocol); 6) Washed 5 times in PBS1x; 7) Fixed animal were observed for 488 fluorescence. Positive (DNase I treatment after step 4) and negative (without TUNEL-Enzyme) controls were obtained using the manufacturer’s “In Situ Cell Death AP kit” protocol.
Pharmaceutical drug treatments to block apoptotic cell death
Apoptotic cell death was blocked using the pan-caspase inhibitor Z-VAD-FMK (#ALX-260-020-M001, Enzo Life Sciences Inc, Farmingdale, NY, USA). A stock solution at 10mM in DMSO was prepared for Z-VAD, kept at -20°C and diluted in 1/3X ASW at a final concentration of 10µM or 50µM prior to each experiment. Each Z-VAD treatment was performed in a final volume of 500µl 1/3X ASW in a 24 well plate using the adequate controls (1/3X ASW or DMSO). Reagents were changed every 24h to maintain activity for the duration of the experiments.
References
Adell T, Salò E, Boutros M, Bartscherer K. 2009. Smed-Evi/Wntless is required for beta-catenin-dependent and -independent processes during planarian regeneration. Development 136:905–910.
Amiel AR, Johnston H, Chock T, Dahlin P, Iglesias M, Layden M, Röttinger E, Martindale MQ. 2017. A bipolar role of the transcription factor ERG for cnidarian germ layer formation and apical domain patterning. Developmental Biology 430:346–361.
Amiel AR, Johnston HT, Nedoncelle K, Warner JF, Ferreira S, Röttinger E. 2015. Characterization of Morphological and Cellular Events Underlying Oral Regeneration in the Sea Anemone, Nematostella vectensis. Int J Mol Sci 16:28449–28471.
Bassat E, Mutlak YE, Genzelinakh A, Shadrin IY, Baruch Umansky K, Yifa O, Kain D, Rajchman D, Leach J, Riabov Bassat D, et al. 2017. The extracellular matrix protein agrin promotes heart regeneration in mice. Nature 547:179–184. Binari LA, Lewis GM, Kucenas S. 2013. Perineurial glia require Notch signaling
during motor nerve development but not regeneration. J. Neurosci. 33:4241– 4252.
Bolger AM, Lohse M, Usadel B. 2014. Trimmomatic: a flexible trimmer for Illumina sequence data. Bioinformatics 30:2114–2120.
Bossert PE, Dunn MP, Thomsen GH. 2013. A staging system for the regeneration of a polyp from the aboral physa of the anthozoan Cnidarian Nematostella vectensis. Dev. Dyn. 242:1320–1331.
Bryant DM, Johnson K, DiTommaso T, Tickle T, Couger MB, Payzin-Dogru D, Lee TJ, Leigh ND, Kuo T-H, Davis FG, et al. 2017. A Tissue-Mapped Axolotl De Novo Transcriptome Enables Identification of Limb Regeneration Factors. Cell Rep 18:762–776.
Burton PM, Finnerty JR. 2009. Conserved and novel gene expression between regeneration and asexual fission in Nematostella vectensis. Dev. Genes Evol. 219:79–87.
Carlson MR, Komine Y, Bryant SV, Gardiner DM. 2001. Expression of Hoxb13 and Hoxc10 in developing and regenerating Axolotl limbs and tails. Developmental Biology 229:396–406.
Chera S, Ghila L, Dobretz K, Wenger Y, Bauer C, Buzgariu W, Martinou J-C, Galliot B. 2009. Apoptotic cells provide an unexpected source of Wnt3 signaling to drive hydra head regeneration. Developmental Cell 17:279–289.
Davidson EH, Rast JP, Oliveri P, Ransick A, Calestani C, Yuh C-H, Minokawa T, Amore G, Hinman V, Arenas-Mena C, et al. 2002. A genomic regulatory network for development. Science 295:1669–1678.
Dubuc TQ, Traylor-Knowles N, Martindale MQ. 2014. Initiating a regenerative response, cellular and molecular features of wound healing in the cnidarian Nematostella vectensis. BMC Biol. 12:24.
Fischer AHL, Smith J. 2014. Nematostella High-density RNAseq time-course. Gardiner DM, Blumberg B, Komine Y, Bryant SV. 1995. Regulation of HoxA
expression in developing and regenerating axolotl limbs. Development 121:1731–1741.
Genikhovich G, Technau U. 2009. In situ hybridization of starlet sea anemone (Nematostella vectensis) embryos, larvae, and polyps. Cold Spring Harb Protoc 2009:pdb.prot5282–pdb.prot5282.
Habermann B, Bebin A-G, Herklotz S, Volkmer M, Eckelt K, Pehlke K, Epperlein HH, Schackert HK, Wiebe G, Tanaka EM. 2004. An Ambystoma mexicanum EST sequencing project: analysis of 17,352 expressed sequence tags from embryonic and regenerating blastema cDNA libraries. Genome Biol. 5:R67. Hand C, Uhlinger KR. 1992. The culture, sexual and asexual reproduction, and
growth of the sea anemone Nematostella vectensis.
Helm R, Siebert S, Tulin S, Smith J, Dunn C. 2013. Characterization of differential transcript abundance through time during Nematostella vectensis development. BMC Genomics 14:266.
Hutchins ED, Markov GJ, Eckalbar WL, George RM, King JM, Tokuyama MA, Geiger LA, Emmert N, Ammar MJ, Allen AN, et al. 2014. Transcriptomic Analysis of Tail Regeneration in the Lizard Anolis carolinensis Reveals Activation of Conserved Vertebrate Developmental and Repair Mechanisms. PLoS ONE 9:e105004.
Imokawa Y, Yoshizato K. 1997. Expression of Sonic hedgehog gene in regenerating newt limb blastemas recapitulates that in developing limb buds. Proc. Natl. Acad. Sci. U.S.A. 94:9159–9164.
Katz MG, Fargnoli AS, Kendle AP, Hajjar RJ, Bridges CR. 2015. The Role of microRNAs in Cardiac Development and Regenerative Capacity. Am. J. Physiol. Heart Circ. Physiol.:ajpheart.00181.2015.
Kumar L, E Futschik M. 2007. Mfuzz: a software package for soft clustering of microarray data. Bioinformation 2:5–7.
preserved and reproducible? PLoS Comput. Biol. 7:e1001057.
Langmead B, Trapnell C, Pop M, Salzberg SL. 2009. Ultrafast and memory-efficient alignment of short DNA sequences to the human genome. Genome Biol. 10:R25.
Leek JT, Johnson WE, Parker HS, Jaffe AE, Storey JD. 2012. The sva package for removing batch effects and other unwanted variation in high-throughput experiments. Bioinformatics 28:882–883.
Li B, Dewey CN. 2011. RSEM: accurate transcript quantification from RNA-Seq data with or without a reference genome. BMC Bioinformatics 12:323.
Lobo D, Levin M. 2015. Inferring regulatory networks from experimental morphological phenotypes: a computational method reverse-engineers planarian regeneration.Saucerman JJ, editor. PLoS Comput. Biol. 11:e1004295.
MARTIN M. 2011. Cutadapt removes adapter sequences from high-throughput sequencing reads. EMBnet.journal 17:10–12–.
Mathew LK, Sengupta S, Franzosa JA, Perry J, La Du J, Andreasen EA, Tanguay RL. 2009. Comparative expression profiling reveals an essential role for raldh2 in epimorphic regeneration. J. Biol. Chem. 284:33642–33653.
Millimaki BB, Sweet EM, Riley BB. 2010. Sox2 is required for maintenance and regeneration, but not initial development, of hair cells in the zebrafish inner ear. Developmental Biology 338:262–269.
Morgan TH. 1901. Regeneration.
Nguyen VH, Lavenier D. 2009. PLAST: parallel local alignment search tool for database comparison. BMC Bioinformatics 10:329.
Özpolat BD, Zapata M, Daniel Frugé J, Coote J, Lee J, Muneoka K, Anderson R. 2012. Regeneration of the elbow joint in the developing chick embryo recapitulates development. Developmental Biology 372:229–238.
Passamaneck YJ, Martindale MQ. 2012. Cell proliferation is necessary for the regeneration of oral structures in the anthozoan cnidarian Nematostella vectensis. BMC Developmental Biology 12:34.
Robinson MD, McCarthy DJ, Smyth GK. 2010. edgeR: a Bioconductor package for differential expression analysis of digital gene expression data. Bioinformatics 26:139–140.
Rodius S, Androsova G, Götz L, Liechti R, Crespo I, Merz S, Nazarov PV, de Klein N, Jeanty C, González-Rosa JM, et al. 2016. Analysis of the dynamic
co-expression network of heart regeneration in the zebrafish. Sci Rep 6:26822. Röttinger E, Dahlin P, Martindale MQ. 2012. A framework for the establishment of
a cnidarian gene regulatory network for “endomesoderm” specification: the inputs of ß-catenin/TCF signaling. PLoS Genet 8:e1003164.
Schaffer AA, Bazarsky M, Levy K, Chalifa-Caspi V, Gat U. 2016. A transcriptional time-course analysis of oral vs. aboral whole-body regeneration in the Sea anemone Nematostella vectensis. BMC Genomics 17:718.
Srivastava M, Mazza-Curll KL, van Wolfswinkel JC, Reddien PW. 2014. Whole-body acoel regeneration is controlled by Wnt and Bmp-Admp signaling. Curr. Biol. 24:1107–1113.
Supek F, Bošnjak M, Škunca N, Šmuc T. 2011. REVIGO Summarizes and Visualizes Long Lists of Gene Ontology Terms.Gibas C, editor. PLoS ONE 6:e21800.
Torok MA, Gardiner DM, Shubin NH, Bryant SV. 1998. Expression of HoxD genes in developing and regenerating axolotl limbs. Developmental Biology 200:225– 233.
Trevino M, Stefanik DJ, Rodriguez R, Harmon S, Burton PM. 2011. Induction of canonical Wnt signaling by alsterpaullone is sufficient for oral tissue fate during regeneration and embryogenesis in Nematostella vectensis. Dev. Dyn. 240:2673–2679.
Wang Y-H, Beck CW. 2014. Distal expression of sprouty (spry) genes during Xenopus laevis limb development and regeneration. Gene Expr. Patterns 15:61–66.
Warner JF, Guerlais V, Amiel AR, Johnston H, Nedoncelle K, Röttinger E. 2018. NvERTx: a gene expression database to compare embryogenesis and regeneration in the sea anemone Nematostella vectensis. Development 145:dev162867.
Wikramanayake AH, Hong M, Lee PN, Pang K, Byrum CA, Bince JM, Xu R, Martindale MQ. 2003. An ancient role for nuclear beta-catenin in the evolution of axial polarity and germ layer segregation. Nature 426:446–450.