HAL Id: hal-02484434
https://hal.univ-lorraine.fr/hal-02484434
Submitted on 6 Dec 2020HAL is a multi-disciplinary open access
archive for the deposit and dissemination of sci-entific research documents, whether they are pub-lished or not. The documents may come from teaching and research institutions in France or abroad, or from public or private research centers.
L’archive ouverte pluridisciplinaire HAL, est destinée au dépôt et à la diffusion de documents scientifiques de niveau recherche, publiés ou non, émanant des établissements d’enseignement et de recherche français ou étrangers, des laboratoires publics ou privés.
Distributed under a Creative Commons Attribution - NonCommercial - NoDerivatives| 4.0 International License
A 70 MPa hydrogen thermally driven compressor based
on cyclic adsorption-desorption on activated carbon
Giuseppe Sdanghi, Nicolas Vincent, Kevin Mozet, Sébastien Schaefer, Gaël
Maranzana, Alain Celzard, Vanessa Fierro
To cite this version:
Giuseppe Sdanghi, Nicolas Vincent, Kevin Mozet, Sébastien Schaefer, Gaël Maranzana, et al.. A 70 MPa hydrogen thermally driven compressor based on cyclic adsorption-desorption on activated carbon. Carbon, Elsevier, 2020, 161, pp.466-478. �10.1016/j.carbon.2020.01.099�. �hal-02484434�
1
A 70 MPa hydrogen thermally driven
compressor based on cyclic
adsorption-desorption on activated carbon
G. Sdanghi
1,2, V. Nicolas
1, K. Mozet
2, S. Schaefer
1, G. Maranzana
2,
A. Celzard
1, V. Fierro
1*1
Institut Jean Lamour, UMR CNRS-Université de Lorraine n°7198, ENSTIB, 27 rue Philippe Seguin, BP 21042 - 88051 EPINAL Cedex 9, France
2 Laboratoire d’Energétique et de Mécanique Théorique et Appliquée, UMR CNRS-
Université de Lorraine n° 7563, 2 avenue de la Forêt de Haye, BP 160, F-54504 Vandœuvre-lès-Nancy, France
* Corresponding author. Tel: + 33 372 74 96 77. Fax: + 33 372 74 96 38. E-mail address :
2
Abstract
In this study, we compressed hydrogen up to 70 MPa in a non-mechanical device based on cyclic, thermally driven, hydrogen adsorption/desorption on activated carbon (AC). Hydrogen compression comes from the desorption of a pre-adsorbed amount of hydrogen at 77 K on a bed of AC closely packed in high-pressure reservoir. A prototype of 0.5 L containing an AC (MSC-30, Kansai, Japan) having a BET area higher than 3000 m2 g-1 and a volume of micropores around 1 cm3 g-1, was used. The effect of the AC amount, the hydrogen charging pressure and the temperature of desorption on the compression performances was investigated, both experimentally and numerically. Hydrogen was introduced at 8 MPa and pre-adsorbed on 0.135 kg of MSC-30 at 77K. A high-pressure hydrogen flow, up to 28 NL h-1 at 70 MPa, was obtained in a single step when heating the compressor from 77 to 315 K. We proved that high surface area, large volume of micropores, as well as very narrow pores, are the essential requirements for any AC to be used in such compressor. The use of microporous AC in a thermally driven device for hydrogen compression, based on cyclic adsorption/desorption, had never been investigated before. This innovative system might solve several issues hindering the development of the hydrogen supply chain.
Keywords: Activated carbon; Hydrogen compression; Thermally driven compressor;
3
1. Introduction
Hydrogen is expected to play an important role as energy vector in the coming decades and in the framework of Sustainable Development, as it represents a suitable alternative to fossil fuels [1]. Nevertheless, the development of the corresponding supply chain is hampered by the low density of hydrogen, 0.089 kg m-3 at 298K and atmospheric pressure, which is an important drawback especially with respect to automotive applications. It is generally assumed that the density of the adsorbed hydrogen phase can be approximated to the density of liquid hydrogen, i.e., 70 kg m-3, when lowering the temperature down to 77 K [2,3]. Then, the density of liquid hydrogen is about four orders of magnitude higher than that of gaseous hydrogen at 298 K and 0.1 MPa. As a matter of proof, a tank of volume 340 L would be required to store 5 kg of hydrogen at 20 MPa and room temperature, for hydrogen vehicles having an autonomy of 500 km [4]. It has been shown that the use of an adsorption-based system can reduce by 22% the volume needed for hydrogen storage when compared to pure compression at 20 MPa and room temperature [5]. Thus, the advantage of using high surface area materials for hydrogen storage, such as nanoporous carbons, is evident.
At 77 K, the amount of adsorbed hydrogen on a carbon material is roughly proportional to both its surface area and needs an adequate pore size distribution [6,7], but hydrogen uptakes barely exceeding 1 wt.% were obtained at 298 K for all typologies of carbon materials [8]. Although the addition of metal nanoparticles to the carbon structure can be beneficial in terms of hydrogen storage at room temperature due to the spillover phenomenon [9–11], it is often accompanied by a decrease of the surface area [12,13]. Several carbon materials can be used for hydrogen adsorption, such as carbon nanotubes [14,15], carbon nanofibers [16–18], carbons derived from zeolites and metal-organic frameworks (MOFs) [19–23], and activated carbons [24–30]. Hydrogen adsorption on carbon nanotubes and graphitic nanofibers attracted attention after some controversial studies [31][32][33], whose results could never be repeated [34][35]. A hydrogen uptake of 3.25 wt.% was reached at 77 K and 0.1 MPa by using a nanoporous carbon produced by carbonisation of a MOF, called IRMOF-1 [36], surpassing the average values obtained with other benchmark materials.
Out of all the nanoporous carbon materials commonly used for hydrogen storage by adsorption, activated carbons (AC) provide, on average, the highest adsorption capacities [8]. Hydrogen storage capacities up to 6.8 wt.% can indeed be obtained using ACs [24,27,37] at 77 K and 4 MPa. One of the most important advantages of ACs is that they can be produced
4 from a large variety of low-cost and renewable raw materials, such as agricultural wastes or lignocellulosic materials [38], which is an important advantage with respect to other carbon materials. The synthesis of AC consists in the carbonisation of a precursor and the subsequent, or simultaneous, activation process, which can be either physical [39,40] or chemical [25,37,41], respectively. The activation process allows opening and developing the porosity, and the surface area obtained after chemical activation with hydroxides is known to be more favourable than physical activation to produce ACs with very high surface areas [42].
Hydrogen compression is mostly achieved worldwide by using mechanical compressors, also called piston compressors, whose efficiency is around 50% [43,44]. Moreover, they have several disadvantages: (i) the moving components make any maintenance operation difficult; (ii) the use of lubricating oils for the reciprocal movement of mechanical components may result in hydrogen contamination; and (iii) embrittlement phenomena can arise from the contact between hydrogen and the metal walls of the compressors cylinders. Several alternatives to the mechanical hydrogen compressors are available, e.g. metal hydride compressors [45–52] and electrochemical compressors [53–61], both being non-mechanical compressors. Both typologies proved to be cheaper than mechanical compressors, and their reduced size and weight are additional benefits for improving the hydrogen supply chain. A technical and economic comparison between all hydrogen compressor technologies has been extensively discussed elsewhere [62]. A promising technology for non-mechanical hydrogen compression is based on the adsorption and desorption of hydrogen on porous materials having a high surface area. An adsorption-desorption compressor can be defined as a thermally driven compressor since the compression of hydrogen results from heat exchanges in the reaction tank. In this system, the adsorption of hydrogen on the surface of the porous adsorbent is first carried out. Then, hydrogen compression results from the heating of the system, which produces hydrogen desorption and allows hydrogen to pass from the denser adsorbed phase to the lighter bulk phase. The increase in both the system temperature and the density of the hydrogen bulk phase produces hydrogen at high pressure, since all phenomena occur in a confined tank filled with hydrogen adsorbents. In such a system, ACs might be used as adsorbents. In addition to all the aforementioned advantages, it must be added that hydrogen adsorption on ACs is a reversible process, which is undoubtedly an advantage in an adsorption-desorption compressor. Several compression cycles may be possible, which makes such a compression system suitable for hydrogen refuelling stations. Moreover, in addition to a high surface area and the presence of micropores, which are both essential for enhancing the
5 adsorption of hydrogen, the ideal material of an adsorption-desorption compressor must have a high bulk density and also must be cheap. Indeed, a high bulk density is essential to introduce the highest possible amount of AC into the compressor tank, thus increasing the amount of adsorbed hydrogen and then, the compressed one. This is the reason why AC is a more suitable choice than MOFs for this purpose. Indeed, even if MOFs may present very high textural properties, such as surface areas higher than 6000 m2 g-1 and pore volumes of about 3 cm3 g-1, thus allowing storing 10 wt.% of hydrogen at 77 K and 5 MPa [63], MOFs can have a low bulk density and higher cost than ACs, as well as a lower robustness [64].
Adsorption compressors have particularly been used in compressor-driven adsorption cooling systems, in which refrigeration is carried out through the evaporation of a coolant which was formerly compressed in a thermally driven device, consisting in an adsorptive bed connected to a heat sink and a heat source [65,66]. As far as we know, such technology has never been used for hydrogen compression. In our previous numerical study [67], we predicted that a single-stage adsorption-desorption compressor consisting in a tank volume of 0.5L and filled with 0.25 kg of AC would be able to compress hydrogen up to 70 MPa, which is the pressure demanded nowadays for the development of fuel cells vehicles [68,69].
In this study, we will present the experimental investigation of a thermally driven compressor based on adsorption-desorption cycles of hydrogen on a nanoporous AC, able to reach 70 MPa. The effect of different operating parameters on the performance of this system as well as the fit of the experimental data by a 2D-axysymmetric numerical model will also be presented and thoroughly discussed.
2. Experimental
2.1 MaterialsIn this study, the activated carbons MAXSORB® MSC-30 and MSP20X from Kansai Coke & ChemicalsTM (Japan) were chosen because they have a very large BET area (ABET), up to
3300 m2 g-1. The textural characterisation of these materials was carried out and presented in our previous study [7], and its main features are listed in Table 1. Both high ABET and high
pore volumes are essential for improving the performance of an adsorption-desorption compressor. The bulk density of the selected ACs, ρb, was measured by using an AUTOTAP
6 test method. The skeletal densities of the ACs was obtained by helium pycnometry using an AccuPyc II 1340 apparatus from Micromeritics®. Prior to the analysis, carried out at 303 K to avoid He adsorption, the samples were degassed at 373 K for 1.5 h in order to prevent any possible water adsorption affecting the measurements. High-purity hydrogen (99.999%) was used for the compression experiments.
Table 1 – Properties of the MSC-30 and MSP-20X activated carbons
Property / units Symbol MSC-30 MSP20X Reference
BET area / m2 g-1 ABET 3305 2363 [7]
Pore volume / cm3 g-1 VTOT 1.60 0.93 [7]
Skeletal density / kg m-3 ρs 2200 2100 this study
Specific heat / J kg-1 K-1 cp,s 825 - [70]
Thermal conductivity /
W m-1 K-1 λs 0.7 - [71]
Bulk density / kg m-3 ρb 270 350 this study
2.2 Description of the adsorption-desorption compressor
Figure 1 shows the experimental configuration of the adsorption-desorption compressor used herein. The compression tank was a stainless steel cylinder (A286) with an internal volume of 0.5 L. A thermocouple (TT 2) was placed inside the tank to measure the temperature of the system. The internal volume of the cylinder was completely filled with AC. Before each charging step, the AC was outgassed at 523 K and 10-5 mbar using an electric heater. The vacuum pump was then connected to the main circuit via a manual valve (HP 2). The filling circuit was composed of a hydrogen cylinder (internal pressure 20 MPa), equipped with a pressure regulator allowing the control of the hydrogen pressure towards the inside of the tank during the charging step. The hydrogen flow rate was measured with a BROOKS SLA5850S flowmeter (FT 1), which allows measuring a flow rate of up to 1.5 NL min-1 with an accuracy of ± 1.0% of full scale. The hydrogen entered the compression tank through two manual valves (HP 1 and HP 3). During the charging step, the compression tank was placed in a 14-L liquid nitrogen Dewar tank, in order to be uniformly cooled to 77 K. A Swagelok KHB backpressure regulator was placed downstream of the compression tank to produce a high-pressure hydrogen flow once the desired high-pressure (70 MPa) is reached. A second BROOKS
7 SLA5850S flowmeter (FT 2) was used to measure the high-pressure hydrogen flow rate. The whole system was equipped with a vent valve, a safety valve and a rupture disk to prevent overpressure.
Figure 1 - Experimental setup for hydrogen compression through thermally driven adsorption-desorption
a)
8
2.3 Experimental procedure
Before each compression experiment, the compression tank was filled with AC powder. In order to introduce as much as possible, the AC was initially poured into the cylinder to fill the entire internal volume. Then, a piston, which was exactly fitted to the cylinder, was placed on the top of the powder. A threaded hole had been made in the piston to allow trapped air to be released from the container. The whole system was then shaken by using a Retsch AS 200 analytical shaker (amplitude of 0.5 mm, 3 cycles of 10 minutes each), which made it possible to transmit the vertical vibrations to the AC powder to eliminate bridges, large voids and other defects. This procedure resulted in a slight drop in the height of the packed bed and was repeated until the internal volume was completely filled by packed AC.
The compression tank was then connected to the experimental setup. It was outgassed by connecting it to a turbomolecular vacuum pump and opening the HP 1 and HP 2 valves. Furthermore, an electric heater was used to maintain the cylinder at 523 K. The outgassing step lasted until a secondary vacuum level (down to 10-5 mbar) was reached, and its duration depended on the amount of AC used. Once the compression tank reached the desired vacuum level, the HP 1 and HP 2 valves were closed and the vacuum system was disconnected and replaced by a full flange. The compression tank was then placed inside the Dewar with liquid nitrogen and held at 77 K during the whole charging step.
The hydrogen entered the compression tank by opening the manual valves HP 1 and HP 3, connecting the hydrogen supply bottle to the experimental setup. The charging pressure was adjusted with a pressure gauge (PI) placed between the hydrogen supply bottle and the flowmeter. The charging process lasted until the steady-state condition was reached throughout the charging circuit, including the compression tank, i.e., the pressure gradient between the inlet manifold and the compression tank was zero. This process lasted on average about 1 h and ended when the FT 1 flowmeter did not record any incoming flow. At this point, the HP 1 and HP 3 valves were closed to isolate the fill circuit from the rest of the experimental setup.
The next compression step began by removing the compression tank from the Dewar, thereby heating it up by forced convection using a ventilation system. Indeed, increasing the temperature of the tank produced hydrogen desorption and, therefore, the density of the hydrogen bulk phase increased and hydrogen at high pressure was obtained. Once produced, the high-pressure hydrogen filled the empty volume of the compression tank as well as the
9 manifold space between the manual valve HP 1 and the backpressure regulator, which represented a dead volume lower than 2 mL. The backpressure regulator allowed the high-pressure hydrogen to flow at the desired high-pressure. The high-high-pressure hydrogen discharge flow was then measured by the FT 2 flowmeter.
The evolution of system temperature and pressure as well as the hydrogen charge and discharge flows were acquired using the LabVIEW® software.
3. Modelling
3.1 Geometry and mesh
Figure 2 shows the two-dimensional axisymmetric geometry used in this study.
Figure 2 – a) Geometric model and finite element mesh used in this work; and b) zoom on the discharge section
The inner and the outer radii of the compression tank are 0.025 and 0.04 m, respectively. The height of the inner tank is equal to 0.256 m, whereas the total height comprising the tank walls is 0.276 m. At the top, the discharge section has a diameter of 4 mm.
10 Five points were chosen to monitor the variations in pressure, temperature, hydrogen bulk phase density and adsorbed hydrogen density. Three points were located along the tank axis, labelled A (0, 0), B (0, 0.128) and TTC (0, 0.239), the latter corresponding to the position of the thermocouple. The other two points, C (0.0125, 0.128) and D (0.025, 0.128), are located midway of the wall and on the wall of the tank, respectively.
3.2 Mass conservation equation
In order to describe the mass balance in our thermally driven compressor, we took into account the contribution of hydrogen both in the bulk phase and in the adsorbed phase. The following assumptions have been made:
i. The mass source term, Kg, indicates the amount of hydrogen undergoing a phase
change, from the adsorbed phase to the bulk phase. This term is obviously the same but opposite when it is related to the mass conservation of the hydrogen bulk phase and that of the adsorbed phase.
ii. The average velocity related to the flow of hydrogen through the porous media, , is described by Darcy’s law.
iii. No volume changes with time.
Eq. (1) allows evaluating the whole volume of the compressor tank:
(1)
where Vtank [m3] is the inner volume of the compression tank, Vs is the volume of the solid
adsorbent (AC), Vg is the volume of hydrogen in the bulk phase, and Va is the volume of
hydrogen in the adsorbed phase. Eq. (1) can be rewritten as follows by considering the volume fraction, εi, of each related component i:
(2)
According to the previous definition, the mass conservation equation for the hydrogen in the bulk phase can be written as:
11 where ρg [kg m-3] is the bulk density of hydrogen, εg [v/v] is the volume fraction of the
hydrogen bulk phase, [m s-1] is the average velocity related to hydrogen flow through the porous medium and Kg [kg m-3 s-1] is the mass source term as defined above. In the same way,
the following mass conservation equation can be written for hydrogen in the adsorbed phase:
(4)
where ρa [kg m-3] is the density of adsorbed hydrogen and εa [v/v] is the corresponding
volume fraction.
The averaged velocity related to hydrogen flow through the porous medium, , is described by Darcy’s law according to assumption (ii):
(5)
where k [m2] is the intrinsic permeability of the AC, µ [Pa s] is the dynamic viscosity of hydrogen and P [MPa] is the hydrogen pressure.
The mass balance related to hydrogen in the adsorbed phase can be written in terms of the absolute amount of hydrogen adsorbed on the total mass of AC contained in the compression tank, xa [mol kg-1]. Thus, we can write:
(6)
where [kg m-3] is the density of the AC bed (ms / Vtank), and M [kg mol-1] is the molecular
mass of hydrogen (0.002 kg mol-1).
According to the aforementioned assumptions, by adding Eq. (3), Eq. (4) and Eq. (5), and by considering Eq. (6), the overall mass conservation equation reads as follows:
12
3.3 Energy conservation equation
The energy balance expresses the balance between the amount of energy accumulated in the tank and the energy changes due mainly to the conductive flux, the heat released during adsorption and that exchanged with the external environment. It can be expressed as [72]:
(8)
where [J kg-1] is the total enthalpy of the system, [W m-2] is the heat flux due to conduction and Q [W m-3] is the energy source term. Eq. (8) was applied to two different domains: (i) the active volume of the tank, Vtank, where both adsorption and desorption of
hydrogen occur, and (ii) the walls of the tank.
By considering the contribution of both hydrogen in the bulk phase and that in the adsorbed one, as well as the contribution of the AC in the amount of energy accumulated inside the tank, Eq. (8) can be rewritten in the following form:
(9)
In Eq. (9), cp,g, cp,a and cp,s [J kg-1 K-1] are the specific heat capacities at constant pressure for
the hydrogen bulk phase, the hydrogen adsorbed phase, and the AC, respectively, λeff [W m-1
K-1] is the effective thermal conductivity of the system, and ΔHads [J mol-1] is the heat of
adsorption, considered as constant in the present numerical model.
cp,s was considered as constant in our model (825 J kg-1 K-1), whereas the temperature
dependence of cp,g [J kg-1 K-1] was calculated from the data of the National Institute of
Standards and Technology (NIST), indicated in Eq. (10).
13 On the other hand, the temperature dependence of cp,a [J kg-1 K-1] was evaluated in our
previous work [7]:
(11)
λeff was calculated by taking into account the contribution of each component to the overall
heat transfer, thus giving:
(12)
where λg, λa and λs [W m-1 K-1] are the thermal conductivities of the hydrogen bulk phase, of
the hydrogen adsorbed phase and of the AC, respectively. The temperature dependence of λg
was calculated from the data of the NIST:
(13)
λa was considered to be equal to the thermal conductivity of hydrogen in the liquid phase.
The corresponding temperature dependence was found in the literature [73]:
(14)
On the other hand, λs was considered as constant in the present work (0.7 W m-1 K-1) [71].
By taking into account Eq. (12), and after solving the partial derivatives in Eq. (9), the energy conservation equation can be rewritten as follows:
(15)
Eq. (8) was then applied to the tank walls:
(16)
where ρw [kg m-3] is the wall density, cp,w [J kg-1 K-1] is the specific heat capacity of the wall,
14 properties of the used stainless steel A286 were equivalent to those of the AISI 304 stainless steel. Hence, the thermal dependence of cp,w has been found in the literature [74] and can be
fitted by the following equation:
(17)
ρw and λw were considered as constant with respect to the temperature.
3.4 Hydrogen equation of state
In order to account for the deviation from the ideal conditions due to the high pressures reached during compression, the Van der Waals equation was chosen out of all other possible equations of state for hydrogen [75]:
(18)
where a and b are the constant parameters of the Van der Waals equation (0.02476 J m3 mol-2 and 2.661 10-5 m3 mol-1, respectively) and R is the universal gas constant, 8.314 m3 Pa K-1 mol-1. To increase computational speed using the software ComsolTM for the simulations, the derived form of Eq. (18) was used:
(19) 3.5 Adsorption model
The modified Dubinin-Astakhov (MDA) equation proposed by Richard et al. [76] proved to be a good analytical tool for representing experimental data on the adsorption of different gases over a wide range of pressures and temperatures under supercritical conditions, particularly in the case of hydrogen adsorption on ACs [77,78]:
15 Eq. (20) gives the evolution of the absolute amount of hydrogen adsorbed as a function of pressure and temperature, with higher amounts of hydrogen being adsorbed at higher pressures and lower temperatures [79]. The model requires 5 parameters: xmax [mol kg-1] is the
amount of adsorbed hydrogen corresponding to the saturation of the entire available porous volume, α [J mol-1] is an enthalpy factor, β [mol J-1 K-1] is an entropy factor [80], and Ps
[MPa] is the pseudo-saturation pressure. Ps can be seen as a hypothetical saturation, or
pseudo-saturation, pressure when adsorption occurs under supercritical conditions, assuming that the pore filling mechanism of supercritical fluids is the same as for subcritical ones [81]. This interpretation was reinforced by Do and Do [82], who assumed that supercritical molecules form clusters within micropores, thus exerting a quasi-saturation vapour pressure in the same way as subcritical fluids exhibit their vapour pressure. The application of the MDA equation to describe hydrogen adsorption at high pressure has been presented and discussed in our previous study [7]. The five parameters of Eq. (20) were estimated and the values used in this study are listed in the following Table 2.
3.6 Initial and boundary conditions
Herein, two different simulations were carried out: (i) hydrogen compression during compressor heating from 77 to 298 K, and (ii) hydrogen compression coupled to the production of a high-pressure hydrogen flow to the outside of the compression tank once the desired pressure of 70 MPa has been reached.
3.6.1 Heating up to 298 K
The simulation of the hydrogen compression during tank heating from 77 to 298 K was first carried out. At the beginning of this step, the temperature was set at 77 K in the entire domain, whereas several inlet pressures were chosen.
In this step, the tank is only subjected to heat convection with the external environment. Thus, the heat flux from the outer walls of the compression tank, [W m-2], is given by the following expression:
16 where hT [W m-2 K-1] is the global heat transfer coefficient, and TF [K] is the temperature of
the external environment and is equal to 298 K during the heating process (but could be higher, depending on the heating system used).
3.6.2 High-pressure hydrogen discharge flow
The hydrogen discharge flow, [kg m-2 s-1], obtained once the desired 70 MPa were reached, was simulated using the following expression:
(22)
where Pmax [MPa] is the maximum pressure set (70 MPa), P [MPa] is the hydrogen pressure
inside the tank, and ψ [kg m-2 s-1 Pa-1] is a constant relating the discharge flow to the pressure difference, and considered as a fitting parameter.
With regard to heat transfers, the boundary condition for convection was set by applying Eq. (21) to the external walls. In addition, heat is also released from the system by . This further contribution was calculated as follows:
(23)
3.7 Implementation of the numerical method
The entire equation system presented in this section has been solved by using the ComsolTM software. Therefore, the three dependent variables were ρg, P and T. The parameters used for
the present numerical simulation are listed in Table 2. Some of them were taken from the literature, while the parameters that could not be estimated reliably and were difficult to measure directly were obtained by fitting the data and taking into account both boundary conditions and experimental results. This is the case of the global heat transfer coefficient hT,
which proved to be well predictive of experimental data when it was set at 40 W m-2 K-1. This value is in good agreement with the hT values normally used in forced convection conditions.
An extremely fine mesh consisting of 4932 triangles and 2604 vertices was used. The mesh was refined at the discharge section to improve the prediction of the high-pressure hydrogen flow to the outside of the compression tank (Figure 2b). The number of degrees of freedom
17 was 15670. Each simulation required a computational time of 72 seconds. Simulations were performed for 100 minutes of the compression process.
Table 2 – Constant parameters used in the present numerical model
Parameter / units Symbol Value Reference
A286 density / kg m-3 ρw 7950 [83]
A286 specific heat / J kg-1 K-1 cp,w 460 [83]
A286 thermal conductivity / W m-1 K-1 λw 12 [83]
Enthalpy factor in MDA equation / J mol-1 α 3300 [7] Entropy factor in MDA equation / J mol-1 K-1 β 15.79 [7] Global heat transfer coefficient / W m-2 K-1 hT 40 this study
Heat of adsorption / J mol-1 ΔHads -6,000 [7]
Hydrogen viscosity / Pa·s μ 9·10-6 [84]
Maximum hydrogen adsorbed / mol kg-1 xm 72.46 [7]
Permeability / m2 k 10-11 this study
Pseudo-saturation pressure / MPa Ps 1013 [7]
Total volume of tank / m3 Vtank 5·10
-4
this study
Volume of adsorbed phase / m3 kg-1 Va 0.0015 [7]
4. Results and discussion
It has been found that three main operating parameters have a direct impact on the hydrogen discharge pressure in an adsorption-desorption compressor: (i) the amount of AC used; (ii) the inlet hydrogen pressure; and (iii) the temperature at which desorption occurs.
4.1 Effect of the AC amount used
Figure 3a shows the time evolution of the hydrogen pressure inside the compressor tank as a function of the amount of AC used. In all cases, hydrogen was introduced at 4 MPa.
18 Figure 3 – Pressure evolution inside the adsorption-desorption compressor when using: a) three different amounts of AC (TF = 298 K, Pin = 4 MPa), and b) different charge pressures
(TF = 298 K, ms = 0.135 kg)
High values of the hydrogen discharge pressure were reached when using relatively high amounts of AC in the adsorption-desorption compressor. Hydrogen was compressed to 42.2 MPa when filling the compressor tank with 0.135 kg of ACs and when the system was heated from 77 to 298 K. This value was 23% higher than that obtained when filling the tank with 0.099 kg of AC (32.5 MPa). In fact, the manual vertical tapping procedure described in Section 2.2 was essential to introduce the highest possible amount of AC into the compressor tank. The AC selected for this study, MSC-30, has a very low bulk density (270 kg m-3) which affects the value of the hydrogen discharge pressure that can be reached. In our previous numerical study on an adsorption-desorption compressor having the same volume as the one used here, namely 0.0005 m3, we calculated that 0.25 kg of AC would be needed to increase the hydrogen pressure from 4 to 70 MPa when the system is heated from 77 to 298 K [67]. Nevertheless, reaching such a value proved to be quite ambitious, since only 0.135 kg of AC can be introduced inside the compressor tank given the measured bulk density b. On the
other hand, the compressor tank was filled with 0.099 kg of AC when no vertical tapping was carried out. Therefore, the amount of AC to be used is not a modifiable operating parameter of an adsorption-desorption compressor, since it is limited by b.
Figure 3a also shows the important contribution of adsorption-desorption phenomena to the compression of hydrogen. The hydrogen was compressed from 4 to 15 MPa only by heating
19 the tank from 77 to 298K without the use of carbon. A discharge pressure of 53 to 65% higher was then reached using 0.099 to 0.135 kg of AC, respectively. Furthermore, Figure 3a shows that the compressor tank was heated from 77 to 298 K in around 80 minutes. This result, as well as the whole time evolution of the hydrogen pressure inside the tank, has been well predicted by the numerical model presented in Section 3.
4.2 Effect of the hydrogen charging pressure
The results presented in the previous section have shown that the highest amount of AC must be used in an adsorption-desorption compressor to achieve the highest possible discharge pressure. Once the 0.0005 m3 compression tank was filled with 0.135 kg of AC, the hydrogen inlet pressure was changed. Figure 3b shows the evolution over time of the hydrogen pressure inside the tank during loading at 5, 6 or 8 MPa.
As expected, the higher was the charge pressure, the higher was the discharge pressure. The hydrogen pressure increased significantly during the first 30 minutes to reach 298 K in a total of 80 minutes in all cases. The evolution of pressure obtained from the experimental data was well predicted by the numerical model only for relatively low values of the hydrogen charge pressure (Pin < 6 MPa). Figure 3b shows that a good fit of data was obtained up to 50 MPa,
whereas a discrepancy between the experimental data and the numerical model began to be evident at higher pressures. This deviation was even more evident in the case where the hydrogen charge pressure was 8 MPa. In the latter case, the numerical model predicts a hydrogen discharge pressure equal to 70 MPa, whereas 65 MPa have been reached experimentally. Such a consistent error (about 7%) may be due both to the large deviation from the ideal conditions achieved at pressures higher than 50 MPa and to the empirical equation used to describe hydrogen adsorption. The MDA equation presented in Section 3.4 has proved to be a good analytical tool for describing hydrogen adsorption up to 15 MPa [7]. The authors obtained a value for each of the 5 parameters of Eq. (20) by simultaneously fitting several experimental adsorption isotherms at different temperatures. In doing so, a slight difference between the fit and the experimental data was observed at 298 K over the whole pressure range. The MDA equation showed good agreement with the experimental results even up to 23 MPa [77], but the same deviation at 298 K and for pressures higher than 10 MPa was also observed. This discrepancy may explain the overestimation of the hydrogen pressure by our numerical model compared to the experimental data at high pressure, the
20 highest pressures being generally reached near the ambient temperature. Obviously, the accumulation of errors increases the deviation at very high pressures.
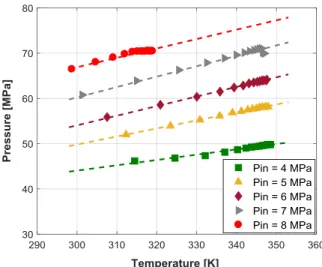
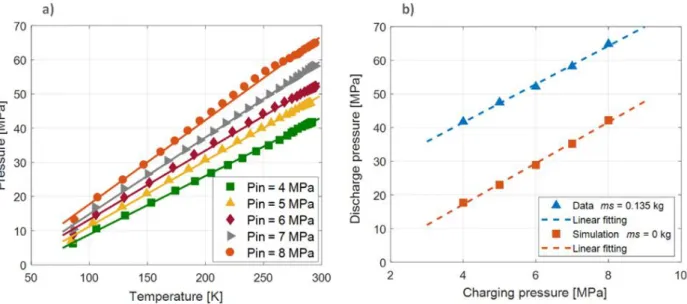
Figure 4a shows the linearity of the increase of the hydrogen pressure with the temperature observed during the heating step for all the charging pressures; as expected, the slope became progressively steeper as the hydrogen charge pressure increased. A second linear correlation was also observed between charge and discharge hydrogen pressures (Figure 4b). Indeed, the discharge pressure increased by about 6 MPa when the charge pressure increased by only 1 MPa: 47.5 MPa was reached during the supply of hydrogen at 5 MPa in the compressor tank, whereas 52.1 MPa was reached for a charging pressure of 6 MPa (Figure 4a). Instead, about 65 MPa was reached when the charge pressure was 8 MPa. In all cases, the compressor tank was heated from 77 K to 298 K in 80 minutes. According to this correlation, 70 MPa could be reached at room temperature when introducing hydrogen into the compression tank at 9 MPa and heating up to 298 K. Figure 4b also shows the linear increase of the hydrogen discharge pressure obtained if the tank does not contain AC. The beneficial effect on the compression of hydrogen when using ACs is clear.
Figure 4 – a) Temperature – pressure correlation during the compression step; b) charge pressure – discharge pressure correlation during the compression step (ms = 0.135 kg, TF =
298 K). The pressure obtained if AC was not used is also included in the figure. The dashed lines highlight the linearity of relationships.
21 The numerical simulation proved that the hydrogen pressure was homogenous throughout the compression tank, without any pressure gradient. However, the temperature was quite inhomogeneous inside the system (Figure 5).
Figure 5 – Temperature [K] profiles inside the compression tank at different time (ms =
0.135 kg, Pin = 8 MPa)
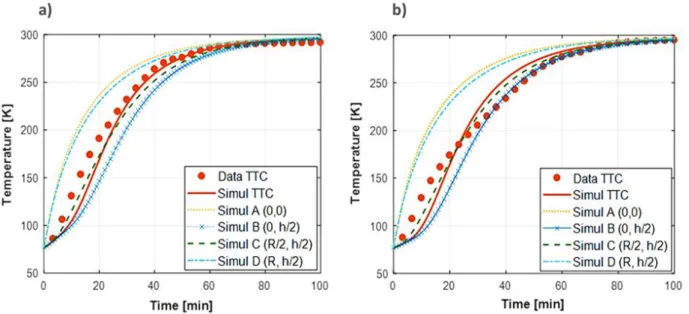
Figure 6a shows the temperature profile at different positions in the compression tank for Pin
= 4 MPa. The temperature of the system increased more rapidly near the tank wall than in the middle of the tank, due to the relatively low value of the thermal conductivity of the AC (λs,
considered to be equal to 0.7 W m-2 K-1 according to [71]). In addition, Figure 6a shows that the radial direction had larger temperature gradients than the axial direction, which is in perfect agreement with the experimental results of the literature [85]. In fact, λs and the global
heat transfer coefficient hT are equally important in an adsorption-desorption compressor, as
confirmed by the Biot number:
(24)
Taking into account the values given in Tables 1 and 2, a Biot number close to 1 revealed that heat conduction inside the tank and convection outside were coupled in this study. Figure
22 6a also shows that experimental data related to the thermocouple (TTC) position (on the axis and h = 239 mm) were not correctly predicted by the numerical model. Indeed, a good fit was obtained once the temperature of the system was 220 K, whereas deviations even higher than 27% were obtained during the heating from 77 to 220 K. This deviation could be explained by the hypothesis made about λs, assumed to be constant over the entire range of temperature
considered. On the other hand, Figure 6b shows the temperature profile at different positions of the compressor when Pin = 8 MPa. As with the pressure profile, a large difference between
the numerical model and the experimental data was obtained, which may be due to the problems encountered when using the MDA equation at high pressure, as discussed in Section 3.1.
Figure 6 – Temperature distribution at different positions in the tank for: a) Pin = 4 MPa; and
b) Pin = 8 MPa (ms = 0.135 kg)
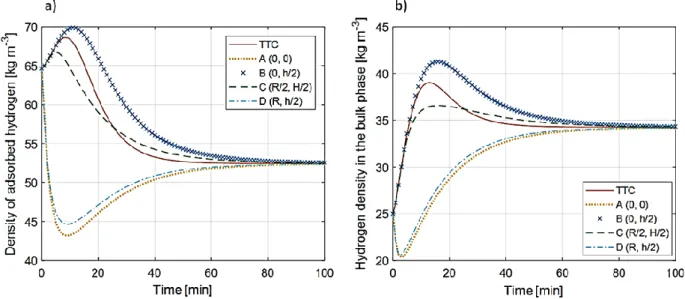
The non-uniform temperature profile gave a different desorption behaviour inside the tank, as shown in Figure 7. Figure 7a shows the distribution of the adsorbed phase density, ρa, at
different positions within the compression tank and calculated by numerical simulation. ρa
was calculated taking into account the volume of the adsorbed phase, Va, reported in Table 2.
ρa first decreased in regions where the temperature was higher, i.e., near the walls of the tank,
during the first 10 minutes of heating. Obviously, hydrogen desorption has occurred there. In addition, the temperature of the tank was still low enough to promote the adsorption of hydrogen in the central part of the tank during the same time (Figure 5), followed by
23 desorption of hydrogen when the temperature also increased there. Thus, ρa became
homogenous once the system was uniformly at 298 K, and ρa reached a lower value than that
determined before heating due to hydrogen desorption. Figure 7b also shows the evolution of
ρg inside the tank. ρg decreased near the tank walls due to the simultaneous increase in
temperature and pressure, whereas it increased in the internal regions of the tank due to the lower temperature there. Once the system was warmed to room temperature, ρg reached a
constant and higher value throughout the tank, as a result of the increase in hydrogen pressure.
Figure 7 – Predicted density of: a) hydrogen in the adsorbed phase; and b) hydrogen in the bulk phase at different positions in the compression tank (ms = 0.135 kg, Pin = 8 MPa)
4.3 Effect of the desorption temperature
The linear correlation between the system temperature and the hydrogen discharge pressure shown in Figure 4a suggests that one can reach 70 MPa by increasing the temperature of the tank even beyond 298 K. This scenario is quite common in decentralised hydrogen refuelling stations, where hydrogen is produced locally by electrolysis of water and compression by mechanical compressors [86]. Electrolysis of water is usually carried out at 353 K [87]. Therefore, the waste heat could be used for the heating / compression step in an adsorption-desorption compressor. Figure 8 shows the increase in hydrogen pressure inside the compression tank when the temperature exceeds 298 K.
24 Figure 8 – Increase of the hydrogen pressure with the desorption temperature for different
charge pressures (ms = 0.135 kg). The dashed highlight the linearity of relationships.
The linear correspondence between the desorption temperature and the hydrogen pressure was also maintained above 298 K. Increasing the desorption temperature to 353 K allowed reaching a discharge pressure almost 10 MPa higher than that obtained at 298 K in all cases. Thus, a discharge pressure of 70 MPa was reached when introducing hydrogen into the tank at 7 MPa and heating up to 343 K, whereas 315 K was sufficient to obtain the desired discharge pressure when introducing hydrogen at 8 MPa.
Once 70 MPa were reached (Figure 9a), the backpressure regulator placed downstream of the compression tank allowed the hydrogen to flow at the desired high pressure (Figure 9b). This made it possible to measure the high-pressure hydrogen flow produced by the adsorption-desorption compressor (Figure 9c).
Figure 9c shows the discharge flow obtained during the heating of the compressor tank from 298 to 353 K. The hydrogen pressure was initially around 67 MPa because of the preceding compression step during the heating of the compression tank from 77 to 298 K. 28 NL h-1 were quickly released by the compressor, and a decreasing flow was then obtained for about 75 min. The flow of high-pressure hydrogen vanished when the pressure inside the tank was less than 70.2 MPa, i.e., the pressure set by the backpressure regulator. Figure 9c shows the experimental discharge flow and the predicted one obtained when using Eq. (22), presented in Section 3.6. The value of ψ was found to be equal to 10-5 kg m-2 s-1 Pa-1 and was calculated by data fitting. Furthermore, hT was fixed to 100 in this case, since an electric heater surrounding
25 the compression tank was used to increase the system temperature to 323 K. Using an electric heater, the effect of thermal resistances is inevitable, gradually increasing the temperature with time after a sharp initial increase during the first 20 minutes of heating. Thus, the predicted behaviour deviated from the experimental one, taking into account the absence of external thermal resistances (Figure 9d). It was found that this approach slightly underestimated the hydrogen discharge flow compared to the experimental data. Indeed, the numerical model predicted a maximum discharge flow equal to 24 NL h-1. This difference could be also due to an error from the backpressure regulator, which may be opened instantly, quickly releasing most of the hydrogen under high pressure.
Figure 9 – a) Manometer of the experimental setup showing 70 MPa. Experimental and predicted: b) increase of the system pressure during the discharge step, c) high-pressure
hydrogen discharge flow, and d) temperature profile inside the tank at different spatial coordinates (ms = 0.135 kg, Pin = 8 MPa)
26
4.4 Effect of textural properties and bulk density
To check the effect of the couple (AC textural properties; bulk density) on the performances of an adsorption-desorption compressor, the material MSP20X was also tested in our compressor. MSP20X has a ABET of 2363 m2 g-1, a micropore volume of 0.88 cm3 g-1 and an
average micropore size of 1.04 nm, compared to 3300 m2 g-1, 0.96 cm3 g-1 and 1.28 nm for MSC-30, respectively. In our previous study [7], we showed that the lower hydrogen uptake on MSP20X, i.e., 4.8 wt.%, was mainly due to the less developed textural properties. Nevertheless, MSP20X has a higher bulk density than MSC-30, i.e., 350 kg m-3 (vs. 270 kg m
-3
), and hence an amount of MSP20X as high as 0.175 kg could be introduced in the tank. Figure 10 shows the increase of the hydrogen pressure inside the tank after desorption when using the maximum amount possible of both MSC-30 and MSP20X.The final pressure was similar with both ACs. However, an amount of MSP20X higher than that of MSC-30 was necessary in order to reach the same performances, because of the less developed textural properties of MSP20X, which resulted in a lower hydrogen adsorption capacity. In this particular case, the higher density balanced the lower surface area and, from an economic point of view, MSC-30 would be a better option, as we introduced a lower amount. It is important to highlight that higher density will not always balance the less developed textural properties. Although lower than those of MSC30, BET area and microporosity of MSP20X are still high. Further studies are needed to get more insight into the balance between pore texture and bulk density concerning hydrogen adsorption and compression in our system.
Figure 10 - Pressure evolution inside the adsorption-desorption compressor when using 0.135 kg of MSC-30 and 0.175 kg of MSP20X (TF = 298 K, Pin = 8 MPa)
27
4.5 Application of the adsorption-desorption compressor
The results presented in Section 4.3 proved that a minimum charge pressure of 8 MPa was required to compress hydrogen up to 70 MPa using a thermally driven adsorption-desorption compressor, filled with the AC MSC-30 and that would be heated up to 315 K. Under these conditions, the compressor could meet the pressure target demanded nowadays for the development of fuel cells vehicles and hydrogen refuelling stations. A preliminary system, supplying the compressor with hydrogen at 8MPa, should be defined and we propose to use a high-pressure water electrolyser, potentially capable of producing hydrogen up to 10 MPa from water [88]. Furthermore, the use of heat recovered from the electrolyser would warm the thermally driven compressor to temperatures above 298 K. Thus, a two-stage system comprising a high-pressure electrolyser and a thermally driven compressor could be used in small, decentralised facilities using hydrogen as fuel, e.g. hydrogen refuelling stations. This solution would make it possible to solve several problems related to hydrogen infrastructures, particularly as regards to its transport and distribution [89].
In order to make such a system a feasible alternative either to hydrogen mechanical compressors or to the other typologies of non-mechanical compressors, several improvements are necessary. The ratio of compressed hydrogen mass to tank volume was equal to 1.35∙10-3 kg / m-3. An increase of the aforementioned ratio should be obtained by increasing the bulk density of the AC bed by means of densification processes, as shown by Celzard et al. [90,91]. In addition to that, bigger tanks would be necessary for a hydrogen refuelling station, which implies larger amounts of liquid nitrogen to cool the system down to 77 K during the charging phase. We used around 14 L of liquid nitrogen for cooling a 0.5 L tank, and this is one of the main drawbacks of an adsorption-desorption compressor, because of cost and safety issues of handling very large volumes of liquid nitrogen. Moreover, larger volumes of compressor tank would require a more efficient thermal management of the whole system. Composite adsorbents consisting in the addition of flexible graphite to the AC bed might be used to increase the thermal conductivity of the porous bed [92]. A better heat exchange inside the tank through heat exchangers in contact with the AC might be a good option to better manage the temperature gradients inside the tank. The thermally driven adsorption-desorption compressor is still a novel technology, thus it is difficult to give precise assessment of its performances and cost. Although costs associated with liquid nitrogen are high [62], installation and maintenance costs should be lower than those of mechanical compressors, because of the absence of moving parts.
28
5 Conclusion
An innovative non-mechanical hydrogen compressor was described and modelled. It is based on a thermally driven, cyclic adsorption-desorption of hydrogen on activated carbon (AC). Once hydrogen has been adsorbed at 77K, desorption is triggered by increasing the temperature of the system, thus increasing the hydrogen pressure to 70 MPa and above, which corresponds to the pressure range required nowadays for fuel cell vehicles.
The three main operating parameters directly affecting the performance of a thermally driven compressor, where hydrogen has been adsorbed at 77K, are:
(i) the amount of AC used: a maximum amount of AC must be used in order to enhance the adsorption of hydrogen, and therefore its compression, which is strictly related both to the density of the AC bed and to the ratio: compression tank volume to empty volume.
(ii) the hydrogen charging pressure: the higher the charging pressure, the higher the discharge pressure. 8 MPa were found sufficient to obtain 70 MPa at 315 K with 0.135 kg of AC. This means that an adsorption-desorption compressor must be coupled to a first stage producing hydrogen at high pressure, e.g. a high-pressure electrolyser, which makes it possible to reach the required charge pressure.
(iii) the desorption temperature: the higher the desorption temperature, the higher the discharge pressure. If a thermally driven compressor is heated to 353 K using the waste heat of a water electrolyser placed upstream of the compression stage, the final pressure will increase.
Numerical simulation has successfully described the experimental data at hydrogen pressures below 50 MPa. Significant deviations, with an absolute error of 7%, were achieved in the simulation of hydrogen compression up to 70 MPa. This inaccuracy is probably related to the adsorption model used, i.e., based on the MDA equation, which has been validated at pressures lower than 15 MPa. Hydrogen adsorption measurements at higher pressures could allow a more accurate estimation of the parameters of the MDA model, thus providing a more consistent tool for describing high-pressure hydrogen applications.
The energy optimisation of the thermally driven compressor studied is in progress. In this way, a thermally driven compressor could become a valid alternative to mechanical compressors from an industrial point of view.
29
Acknowledgements
This study was partly supported by the French PIA project "Lorraine Université d’Excellence", reference ANR-15-IDEX-04-LUE, and TALiSMAN project, funded by FEDER (2019-000214).
30
References
[1] Jain IP. Hydrogen the fuel for 21st century. Int J Hydrog Energy 2009;34:7368–78. https://doi.org/10.1016/j.ijhydene.2009.05.093.
[2] Kadono K, Kajiura H, Shiraishi M. Dense hydrogen adsorption on carbon subnanopores at 77 K. Appl Phys Lett 2003;83:3392–4. https://doi.org/10.1063/1.1621073.
[3] Poirier E, Dailly A. On the Nature of the Adsorbed Hydrogen Phase in Microporous Metal−Organic Frameworks at Supercritical Temperatures. Langmuir 2009;25:12169– 76. https://doi.org/10.1021/la901680p.
[4] Berry GD, Aceves SM. Onboard Storage Alternatives for Hydrogen Vehicles. Energy Fuels 1998;12:49–55. https://doi.org/10.1021/ef9700947.
[5] de la Casa-Lillo MA, Lamari-Darkrim F, Cazorla-Amorós D, Linares-Solano A. Hydrogen Storage in Activated Carbons and Activated Carbon Fibers. J Phys Chem B 2002;106:10930–4. https://doi.org/10.1021/jp014543m.
[6] Fierro V, Bosch G, Siperstein FR. Pore size distribution in microporous carbons obtained from molecular modeling and density functional theory. Stud Surf Sci Catal 2007:519–26. https://doi.org/doi: 10.1016/S0167-2991(07)80067-X.
[7] Sdanghi G, Schaefer S, Maranzana G, Celzard A, Fierro V. Application of the modified Dubinin-Astakhov equation for a better understanding of high-pressure hydrogen
adsorption on activated carbons. Int J Hydrog Energy 2019.
https://doi.org/10.1016/j.ijhydene.2019.09.240.
[8] Sdanghi G, Maranzana G, Celzard A, Fierro V. Hydrogen Adsorption on Nanotextured Carbon Materials. Hydrog. Storage Technol., Wiley-Blackwell; 2018, p. 263–320. https://doi.org/10.1002/9781119460572.ch9.
[9] Pyle DS, Gray EM, Webb CJ. Hydrogen storage in carbon nanostructures via spillover.
Int J Hydrog Energy 2016;41:19098–113.
https://doi.org/10.1016/j.ijhydene.2016.08.061.
[10] Chung T-Y, Tsao C-S, Tseng H-P, Chen C-H, Yu M-S. Effects of oxygen functional groups on the enhancement of the hydrogen spillover of Pd-doped activated carbon. J Colloid Interface Sci 2015;441:98–105. https://doi.org/10.1016/j.jcis.2014.10.062. [11] Schaefer S, Fierro V, Szczurek A, Izquierdo MT, Celzard A. Physisorption,
chemisorption and spill-over contributions to hydrogen storage. Int J Hydrog Energy 2016;41:17442–52. https://doi.org/10.1016/j.ijhydene.2016.07.262.
[12] Zhao W, Fierro V, Zlotea C, Izquierdo MT, Chevalier-César C, Latroche M, et al. Activated carbons doped with Pd nanoparticles for hydrogen storage. Int J Hydrog Energy 2012;37:5072–80. https://doi.org/10.1016/j.ijhydene.2011.12.058.
[13] Zhao W, Fierro V, Fernández-Huerta N, Izquierdo MT, Celzard A. Hydrogen uptake of high surface area-activated carbons doped with nitrogen. Int J Hydrog Energy 2013;38:10453–60. https://doi.org/10.1016/j.ijhydene.2013.06.048.
[14] Bianco S, Giorcelli M, Musso S, Castellino M, Agresti F, Khandelwal A, et al. Hydrogen adsorption in several types of carbon nanotubes. J Nanosci Nanotechnol 2010;10:3860–6. https://doi.org/10.1166/jnn.2010.1972.
31 [15] Barghi SH, Tsotsis TT, Sahimi M. Chemisorption, physisorption and hysteresis during hydrogen storage in carbon nanotubes. Int J Hydrog Energy 2014;39:1390–7. https://doi.org/10.1016/j.ijhydene.2013.10.163.
[16] Kim B-J, Lee Y-S, Park S-J. A study on the hydrogen storage capacity of Ni-plated
porous carbon nanofibers. Int J Hydrog Energy 2008;33:4112–5.
https://doi.org/10.1016/j.ijhydene.2008.05.077.
[17] Jaybhaye S, Sharon M, Sharon M, Sathiyamoorthy D, Dasgupta K. Semiconducting carbon nanofibers and hydrogen storage. Synth React Inorg Met-Org Nano-Met Chem 2007;37:473–6. https://doi.org/10.1080/15533170701471729.
[18] Wu H-C, Li Y-Y, Sakoda A. Synthesis and hydrogen storage capacity of exfoliated
turbostratic carbon nanofibers. Int J Hydrog Energy 2010;35:4123–30.
https://doi.org/10.1016/j.ijhydene.2010.02.043.
[19] Aiyappa HB, Pachfule P, Banerjee R, Kurungot S. Porous Carbons from Nonporous MOFs: Influence of Ligand Characteristics on Intrinsic Properties of End Carbon. Cryst Growth Des 2013;13:4195–9. https://doi.org/10.1021/cg401122u.
[20] Chaikittisilp W, Ariga K, Yamauchi Y. A new family of carbon materials: synthesis of MOF-derived nanoporous carbons and their promising applications. J Mater Chem A 2013;1:14–9. https://doi.org/10.1039/c2ta00278g.
[21] Khan IA, Badshah A, Khan I, Zhao D, Nadeem MA. Soft-template carbonization approach of MOF-5 to mesoporous carbon nanospheres as excellent electrode materials
for supercapacitor. Microporous Mesoporous Mater 2017;253:169–76.
https://doi.org/10.1016/j.micromeso.2017.06.049.
[22] Marco-Lozar JP, Juan-Juan J, Suarez-Garcia F, Cazorla-Amoros D, Linares-Solano A. MOF-5 and activated carbons as adsorbents for gas storage. Int J Hydrog Energy 2012;37:2370–81. https://doi.org/10.1016/j.ijhydene.2011.11.023.
[23] Segakweng T, Musyoka NM, Ren J, Crouse P, Langmi HW. Comparison of MOF-5-and Cr-MOF-derived carbons for hydrogen storage application. Res Chem Intermed 2016;42:4951–61. https://doi.org/10.1007/s11164-015-2338-1.
[24] Zhao W, Luo L, Wang H, Fan M. Synthesis of Bamboo-Based Activated Carbons with Super-High Specific Surface Area for Hydrogen Storage. BioResources 2017;12:1246– 62. https://doi.org/10.15376/biores.12.1.1246-1262.
[25] Bader N, Zacharia R, Abdelmottaleb O, Cossement D. How the activation process modifies the hydrogen storage behavior of biomass-derived activated carbons. J Porous Mater 2017:1–14. https://doi.org/10.1007/s10934-017-0436-8.
[26] Sethia G, Sayari A. Activated carbon with optimum pore size distribution for hydrogen storage. Carbon 2016;99:289–94. https://doi.org/10.1016/j.carbon.2015.12.032.
[27] Fierro V, Zhao W, Izquierdo MT, Aylon E, Celzard A. Adsorption and compression contributions to hydrogen storage in activated anthracites. Int J Hydrog Energy 2010;35:9038–45. https://doi.org/10.1016/j.ijhydene.2010.06.004.
[28] Schaefer S, Muñiz G, Izquierdo MT, Mathieu S, Ballinas-Casarrubias ML, González-Sánchez G, et al. Rice straw-based activated carbons doped with SiC for enhanced
hydrogen adsorption. Int J Hydrog Energy 2017;42:11534–40.
32 [29] Ramesh T, Rajalakshmi N, Dhathathreyan KS. Activated carbons derived from tamarind
seeds for hydrogen storage. J Energy Storage 2015;4:89–95.
https://doi.org/10.1016/j.est.2015.09.005.
[30] Li G, Li J, Tan W, Jin H, Yang H, Peng J, et al. Preparation and characterization of the hydrogen storage activated carbon from coffee shell by microwave irradiation and KOH
activation. Int Biodeterior Biodegrad 2016;113:386–90.
https://doi.org/10.1016/j.ibiod.2016.05.003.
[31] Dillon AC, Jones KM, Bekkedahl TA, Kiang CH, Bethune DS, Heben MJ. Storage of
hydrogen in single-walled carbon nanotubes. Nature 1997;386:377–9.
https://doi.org/10.1038/386377a0.
[32] Chen P, Wu X, Lin J, Tan KL. High H2 uptake by alkali-doped carbon nanotubes under
ambient pressure and moderate temperatures. Science 1999;285:91–3.
https://doi.org/10.1126/science.285.5424.91.
[33] Chambers A, Park C, Baker RTK, Rodriguez NM. Hydrogen Storage in Graphite Nanofibers. J Phys Chem B 1998;102:4253–6. https://doi.org/10.1021/jp980114l.
[34] Yang RT. Hydrogen storage by alkali-doped carbon nanotubes-revisited. Carbon 2000;38:623–6. https://doi.org/10.1016/S0008-6223(99)00273-0.
[35] Rzepka M, Bauer E, Reichenauer G, Schliermann T, Bernhardt B, Bohmhammel K, et al. Hydrogen storage capacity of catalytically grown carbon nanofibers. J Phys Chem B 2005;109:14979–89. https://doi.org/10.1021/jp051371a.
[36] Yang SJ, Kim T, Im JH, Kim YS, Lee K, Jung H, et al. MOF-Derived Hierarchically Porous Carbon with Exceptional Porosity and Hydrogen Storage Capacity. Chem Mater 2012;24:464–70. https://doi.org/10.1021/cm202554j.
[37] Fierro V, Szczurek A, Zlotea C, Marêché JF, Izquierdo MT, Albiniak A, et al. Experimental evidence of an upper limit for hydrogen storage at 77 K on activated carbons. Carbon 2010;48:1902–11. https://doi.org/10.1016/j.carbon.2010.01.052.
[38] Yahya MA, Al-Qodah Z, Ngah CWZ. Agricultural bio-waste materials as potential sustainable precursors used for activated carbon production: A review. Renew Sustain Energy Rev 2015;46:218–35. https://doi.org/10.1016/j.rser.2015.02.051.
[39] Hirscher M. Handbook of Hydrogen Storage: New Materials for Future Energy Storage. John Wiley & Sons; 2010.
[40] Loloie Z, Mozaffarian M, Soleimani M, Asassian N. Carbonization and CO2 activation of scrap tires: Optimization of specific surface area by the Taguchi method. Korean J Chem Eng 2016;2:366–75. https://doi.org/10.1007/s11814-016-0266-4.
[41] Melouki R, Llewellyn PL, Tazibet S, Boucheffa Y. Hydrogen adsorption on activated carbons prepared from olive waste: effect of activation conditions on uptakes and adsorption energies. J Porous Mater 2017;24:1–11. https://doi.org/10.1007/s10934-016-0230-z.
[42] Wang H, Gao Q, Hu J. High Hydrogen Storage Capacity of Porous Carbons Prepared by
Using Activated Carbon. J Am Chem Soc 2009;131:7016–22.
https://doi.org/10.1021/ja8083225.
[43] Hydro-Pac, INC. High pressure gas compressors, pumps and related products 2017. http://www.hydropac.com/hydrogen-compression.html (accessed August 16, 2019).
33 [44] Cornish AJ. Hydrogen Fueling Station Cost Reduction Study. Survey Results and Analysis of the cost and efficiency of various in-operation Hydrogen Fueling Station. Engineering, Procurement & Construction, LLC. Lakewood, Colorado 2011. https://www.osti.gov/servlets/purl/1120569 (accessed August 28, 2019).
[45] Lototskyy MV, Yartys VA, Pollet BG, Bowman RC. Metal hydride hydrogen
compressors: A review. Int J Hydrog Energy 2014;39:5818–51.
https://doi.org/10.1016/j.ijhydene.2014.01.158.
[46] Li H, Wang X, Dong Z, Xu L, Chen C. A study on 70MPa metal hydride hydrogen
compressor. J Alloys Compd 2010;502:503–7.
https://doi.org/10.1016/j.jallcom.2010.04.206.
[47] Wang X, Liu H, Li H. A 70 MPa hydrogen-compression system using metal hydrides. Int J Hydrog Energy 2011;36:9079–85. https://doi.org/10.1016/j.ijhydene.2011.04.193. [48] Kelly NA, Girdwood R. Evaluation of a thermally-driven metal-hydride-based hydrogen
compressor. Int J Hydrog Energy 2012;37:10898–916.
https://doi.org/10.1016/j.ijhydene.2012.04.088.
[49] Laurencelle F, Dehouche Z, Morin F, Goyette J. Experimental study on a metal hydride
based hydrogen compressor. J Alloys Compd 2009;475:810–6.
https://doi.org/10.1016/j.jallcom.2008.08.007.
[50] Laurencelle F, Dehouche Z, Goyette J, Bose T. Integrated electrolyser—metal hydride
compression system. Int J Hydrog Energy 2006;31:762–8.
https://doi.org/10.1016/j.ijhydene.2005.06.019.
[51] Corgnale C, Sulic M. Techno-Economic Analysis of High-Pressure Metal Hydride Compression Systems. Metals 2018;8:469. https://doi.org/10.3390/met8060469.
[52] Lototskyy M, Klochko Ye, Linkov V, Lawrie P, Pollet BG. Thermally Driven Metal Hydride Hydrogen Compressor for Medium-Scale Applications. Energy Procedia 2012;29:347–56. https://doi.org/10.1016/j.egypro.2012.09.041.
[53] Grigoriev SA, Shtatniy IG, Millet P, Porembsky VI, Fateev VN. Description and characterization of an electrochemical hydrogen compressor/concentrator based on solid
polymer electrolyte technology. Int J Hydrog Energy 2011;36:4148–55.
https://doi.org/10.1016/j.ijhydene.2010.07.012.
[54] Grigoriev SA, Djous KA, Millet P, Kalinnikov AA, Porembskiy VI, Fateev VN, et al. Characterization of PEM electrochemical hydrogen compressors. Proc Fundam. Dev. Fuel Cells 2008 Conf., Nancy, France: 2008.
[55] Rohland B, Eberle K, Ströbel R, Scholta J, Garche J. Electrochemical hydrogen compressor. Electrochimica Acta 1998;43:3841–6. https://doi.org/10.1016/S0013-4686(98)00144-3.
[56] Patel P, Lipp L. Electrochemical Hydrogen Compressor. DOE Hydrogen Compression,
Storage and Dispensing Workshop at ANL. Argonne, IL. 2013.
https://www.energy.gov/sites/prod/files/2014/03/f12/csd_workshop_4_patel.pdf (accessed August 15, 2019).
[57] Onda K, Ichihara K, Nagahama M, Minamoto Y, Araki T. Separation and compression characteristics of hydrogen by use of proton exchange membrane. J Power Sources 2007;164:1–8. https://doi.org/10.1016/j.jpowsour.2006.10.018.
34 [58] Casati C, Longhi P, Zanderighi L, Bianchi F. Some fundamental aspects in electrochemical hydrogen purification/compression. J Power Sources 2008;180:103–13. https://doi.org/10.1016/j.jpowsour.2008.01.096.
[59] Ströbel R, Oszcipok M, Fasil M, Rohland B, Jörissen L, Garche J. The compression of hydrogen in an electrochemical cell based on a PE fuel cell design. J Power Sources 2002;105:208–15. https://doi.org/10.1016/S0378-7753(01)00941-7.
[60] Nordio M, Rizzi F, Manzolini G, Mulder M, Raymakers L, Van Sint Annaland M, et al. Experimental and modelling study of an electrochemical hydrogen compressor. Chem Eng J 2019;369:432–42. https://doi.org/10.1016/j.cej.2019.03.106.
[61] Wiebe W, Schmitz S. Using of an electrochemical compressor for hydrogen recirculation in fuel cell vehicles. In: Bargende M, Reuss H-C, Wagner A, Wiedemann J, editors. 19 Int. Stuttg. Symp., Springer Fachmedien Wiesbaden; 2019, p. 955–63. https://doi.org/10.1007/978-3-658-25939-6_75.
[62] Sdanghi G, Maranzana G, Celzard A, Fierro V. Review of the current technologies and performances of hydrogen compression for stationary and automotive applications.
Renew Sustain Energy Rev 2019;102:150–70.
https://doi.org/10.1016/j.rser.2018.11.028.
[63] Suh MP, Park HJ, Prasad TK, Lim D-W. Hydrogen storage in metal-organic frameworks. Chem Rev 2012;112:782–835. https://doi.org/10.1021/cr200274s.
[64] Goldsmith J, Wong-Foy AG, Cafarella MJ, Siegel DJ. Theoretical Limits of Hydrogen Storage in Metal–Organic Frameworks: Opportunities and Trade-Offs. Chem Mater 2013;25:3373–82. https://doi.org/10.1021/cm401978e.
[65] Wade LA. An Overview of the Development of Sorption Refrigeration. In: Fast RW, editor. Adv. Cryog. Eng., Springer US; 1992, p. 1095–106. https://doi.org/10.1007/978-1-4615-3368-9_41.
[66] Swain S, Ghosh I. Conceptual design analysis of a compressor-driven sorption cooling system. Int J Energy Res 2010;34:1016–26. https://doi.org/10.1002/er.1618.
[67] Sdanghi G, Nicolas V, Mozet K, Maranzana G, Celzard A, Fierro V. Modelling of a hydrogen thermally driven compressor based on cyclic adsorption-desorption on
activated carbon. Int J Hydrog Energy 2019;44:16811–23.
https://doi.org/10.1016/j.ijhydene.2019.04.233.
[68] Rand DAJ, Dell RM, Dell R. Hydrogen Energy: Challenges and Prospects. RSC Publishing. Royal Society of Chemistry; 2008.
[69] Hwang HT, Varma A. Hydrogen storage for fuel cell vehicles. Curr Opin Chem Eng 2014;5:42–8. https://doi.org/10.1016/j.coche.2014.04.004.
[70] Xiao J, Peng R, Cossement D, Bénard P, Chahine R. CFD model for charge and discharge cycle of adsorptive hydrogen storage on activated carbon. Int J Hydrog Energy 2013;38:1450–9. https://doi.org/10.1016/j.ijhydene.2012.10.119.
[71] Delahaye A, Aoufi A, Gicquel A, Pentchev I. Improvement of hydrogen storage by adsorption using 2-D modeling of heat effects. AIChE J 2002;48:2061–73. https://doi.org/10.1002/aic.690480919.


![Figure 5 – Temperature [K] profiles inside the compression tank at different time (m s = 0.135 kg, P in = 8 MPa)](https://thumb-eu.123doks.com/thumbv2/123doknet/14530658.533517/22.892.279.637.246.615/figure-temperature-profiles-inside-compression-tank-different-time.webp)