HAL Id: hal-03127104
https://hal.sorbonne-universite.fr/hal-03127104
Submitted on 1 Feb 2021
HAL is a multi-disciplinary open access
archive for the deposit and dissemination of
sci-entific research documents, whether they are
pub-lished or not. The documents may come from
teaching and research institutions in France or
abroad, or from public or private research centers.
L’archive ouverte pluridisciplinaire HAL, est
destinée au dépôt et à la diffusion de documents
scientifiques de niveau recherche, publiés ou non,
émanant des établissements d’enseignement et de
recherche français ou étrangers, des laboratoires
publics ou privés.
Jiao Liu, Xinxin Song, Feimei Kuang, Qiuhong Zhang, Yangchun Xie, Rui
Kang, Guido Kroemer, Daolin Tang
To cite this version:
Jiao Liu, Xinxin Song, Feimei Kuang, Qiuhong Zhang, Yangchun Xie, et al.. NUPR1 is a critical
repressor of ferroptosis. Nature Communications, Nature Publishing Group, 2021, 12 (1), pp.647.
�10.1038/s41467-021-20904-2�. �hal-03127104�
NUPR1 is a critical repressor of ferroptosis
Jiao Liu
1,12
, Xinxin Song
2,12
, Feimei Kuang
1
, Qiuhong Zhang
3
, Yangchun Xie
4
, Rui Kang
2
,
Guido Kroemer
5,6,7,8,9,10,11
✉
& Daolin Tang
1,2
✉
Ferroptosis is a type of iron-dependent regulated cell death, representing an emerging
disease-modulatory mechanism. Transcription factors play multiple roles in ferroptosis,
although the key regulator for ferroptosis in iron metabolism remains elusive. Using
Nano-String technology, we identify NUPR1, a stress-inducible transcription factor, as a driver of
ferroptosis resistance. Mechanistically, NUPR1-mediated LCN2 expression blocks ferroptotic
cell death through diminishing iron accumulation and subsequent oxidative damage.
Con-sequently, LCN2 depletion mimics NUPR1 de
ficiency with respect to ferroptosis induction,
whereas transfection-enforced re-expression of LCN2 restores resistance to ferroptosis in
NUPR1-de
ficient cells. Pharmacological or genetic blockade of the NUPR1-LCN2 pathway
(using NUPR1 shRNA, LCN2 shRNA, pancreas-speci
fic Lcn2 conditional knockout mice, or the
small molecule ZZW-115) increases the activity of the ferroptosis inducer erastin and
wor-sens pancreatitis, in suitable mouse models. These
findings suggest a link between
NUPR1-regulated iron metabolism and ferroptosis susceptibility.
https://doi.org/10.1038/s41467-021-20904-2
OPEN
1The Third Affiliated Hospital, Key Laboratory of Protein Modification and Degradation, Guangzhou Medical University, 510600 Guangdong, China. 2Department of Surgery, UT Southwestern Medical Center, Dallas, TX 75390, USA.3Department of Surgery, University of Pittsburgh, Pittsburgh, PA 15219, USA.4Department of Oncology, The Second Xiangya Hospital, Central South University, Changsha, Hunan, China.5Université Paris Descartes, Sorbonne Paris Cité, 75006 Paris, France.6Equipe 11 labellisée Ligue Nationale contre le Cancer, Centre de Recherche des Cordeliers, 75006 Paris, France.7Institut National de la Santé et de la Recherche Médicale, U1138 Paris, France.8Université Pierre et Marie Curie, 75006 Paris, France.9Metabolomics and Cell Biology Platforms, Gustave Roussy Cancer Campus, 94800 Villejuif, France.10Pôle de Biologie, Hôpital Européen Georges Pompidou, AP-HP, 75015 Paris, France.11Department of Women’s and Children’s Health, Karolinska University Hospital, 17176 Stockholm, Sweden.12These authors contributed equally: Jiao Liu, Xinxin Song. ✉email:[email protected];[email protected]
123456789
C
ell death is a fundamental physiological process to
main-tain homeostasis through the removal of supernumerary,
unnecessary, or dysfunctional cells, while pathological
death can lead to disease. Unlike accidental cell death, regulated
cell death follows multiple subroutines, each of which exhibits
distinct molecular cascades and regulatory pathways
1,2. In recent
years, an increasing level of interest has been manifested with
regard to ferroptosis, a non-apoptotic-regulated cell death
3,4,
which plays a possible pathogenic role in cancer,
neurodegen-eration, and organ dysfunction
5–7. The induction of ferroptosis
has been shown to rely on iron accumulation, which facilitates
oxidative damage through either the production of highly reactive
hydroxyl free radicals in the Fenton reaction or the activation of
iron-containing enzymes, such as lipoxygenase
8. Ferroptotic
cells exhibit a necrosis-like morphology and damage-associated
molecular patterns (DAMPs) released from ferroptotic cells may
function as extracellular inflammatory mediators to contribute to
tissue injury
9.
Ferroptosis is regulated at multiple levels, including at the level
of transcription factors that may modulate the resistance of
malignant cells to anticancer drugs
10. Such transcription factors
do not only participate in rapid responses to ferroptotic stimuli,
but also modulate the long-term outcome of ferroptosis in a
context-dependent manner
11. For example, nuclear factor,
ery-throid 2-like 2 (NFE2L2/NRF2) serves as a master antioxidant
transcription factor for blocking ferroptosis
12–14, whereas the
tumor suppressor TP53 plays a dual role in ferroptosis,
depending on the tumor type
15–17. Although many advances have
recently been achieved in the comprehension of antioxidant
responses and membrane repair mechanisms
18, the key
tran-scription factor responsible for controlling iron-dependent
fer-roptosis has been elusive.
Here, we report that the stress response gene, nuclear protein 1,
transcriptional regulator (NUPR1) transactivates the gene
encoding lipocalin 2 (LCN2) to diminish iron-induced oxidative
damage and to induce ferroptosis resistance. Pharmacological or
genetic blockade of the NUPR1–LCN2 pathway may enhance the
anticancer activity of ferroptosis activator and pathologic
inflammation in vitro and in vivo.
Results
NUPR1 acts as a repressor of ferroptosis. A number of
small-molecule compounds, including erastin and RSL3, are regularly
used to induce ferroptosis and are considered as
‘classical’
inducers of this regulated cell death subroutine
10. To identify
regulators of ferroptosis, we
first evaluated the impact of erastin
on the expression of 770 tumor-associated genes in two human
pancreatic ductal adenocarcinoma (PDAC) cell lines (PANC1
and BxPC3) using NanoString, a digital technology based on
direct multiplexed measurement of nucleic acids through
fluor-escent barcodes
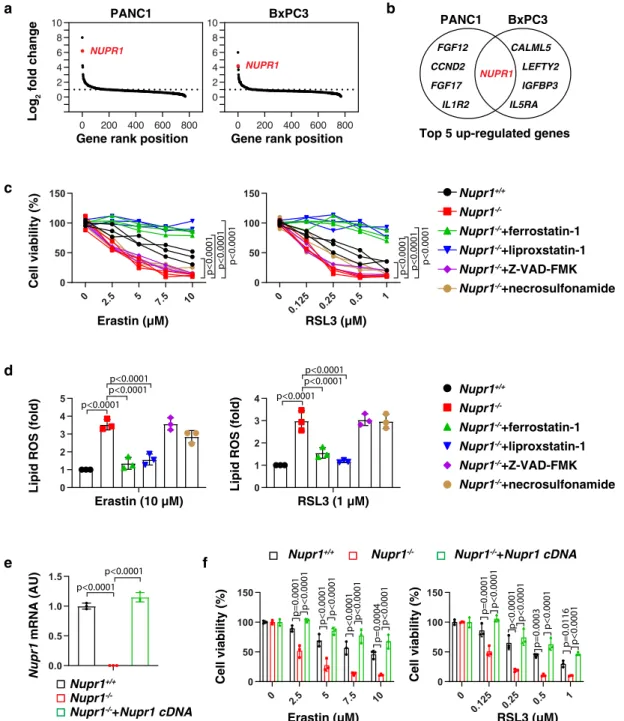
19. NUPR1 was identified as one of the top-five
erastin-induced genes in both PANC1 and BxPC3 cells (Fig.
1
a,
b). Quantitative polymerase chain reaction (qPCR) confirmed
that both erastin and RSL3 induced the upregulation of NUPR1
mRNA in four human PDAC cell lines (PANC1, BxPC3,
Mia-PaCa2, and CFPAC1), primary human PDAC cells (which we will
refer to as
“pHsPDAC”), as well as mouse PDAC cell lines
(mPDAC) from Pdx1-Cre;K-Ras
G12D/+mice (Supplementary
Fig. 1a). Western blot further confirmed the upregulation of
NUPR1 protein expression in PANC1, pHsPDAC, and mPDAC
cells in response to erastin or RSL3 (Supplementary Fig. 1b).
Endoplasmic reticulum (ER) stress is strongly induced in the
context of ferroptosis
20. Notably, the knockdown of activating
transcription factor 4 (ATF4), a key transcription factor involved
in ER stress with anti-ferroptosis activity
21,22, blocked
erastin-induced or RSL3-erastin-induced NUPR1 mRNA expression in
PANC1 cells (Supplementary Fig. 1c, d). These
findings indicate
that ATF4 facilitates the upregulation of NUPR1 in ferroptosis.
To determine whether NUPR1 is a regulator of ferroptosis, we
measured cell viability in wild-type (WT) and Nupr1
−/−mPDAC
cells. Nupr1 deletion increased erastin-induced or RSL3-induced
growth inhibition (Fig.
1
c) and lipid reactive oxygen species
(ROS) formation (Fig.
1
d) in mPDAC cells, and this effect could
be completely reverted by ferroptosis inhibitors (e.g., ferrostatin-1
or liproxstatin-1), but not by inhibitors of apoptosis (e.g.,
Z-VAD-FMK) or necroptosis (e.g., necrosulfonamide). We
con-firmed these observations in human NUPR1-knockdown PDAC
cell lines, including PANC1 and MiaPaCa2 cells (Supplementary
Fig. 2). The increased ferroptosis sensitivity was reversed by
re-expression of Nupr1 cDNA in Nupr1
−/−mPDAC cells (Fig.
1
d,
e). Collectively, these
findings demonstrate that NUPR1 is a
negative regulator of ferroptosis.
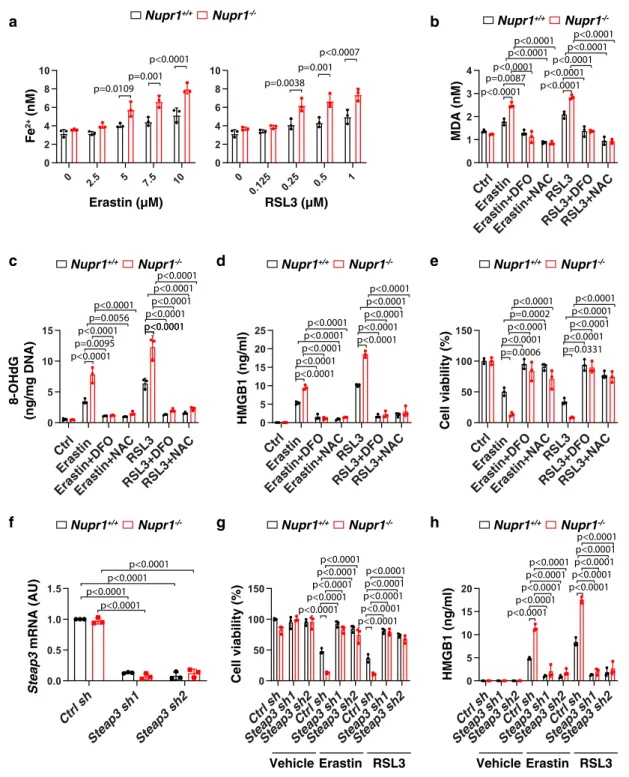
NUPR1 inhibits iron-dependent oxidative damage in
ferrop-tosis. Iron exists in two oxidation states (ferrous [Fe
2] or ferric
[Fe
3+]), while Fe
2+accumulation is an early signal to initiate
ferroptosis
8. Our biochemical analyses revealed that Nupr1
−/−mPDAC cells contained higher intracellular Fe
2+levels compared
to Nupr1
+/+cells in response to erastin or RSL3 (Fig.
2
a). The
increased oxidative stress caused by iron overload may induce
ferroptosis through targeting membrane lipids or DNA
23,24.
Consequently, the depletion of Nupr1 increased erastin-induced
or RSL3-induced lipid peroxidation and oxidative DNA damage
in mPDAC cells as measured by quantifying malondialdehyde
(MDA) or 8-hydroxy-2-deoxy guanosine (8-OHdG), respectively
(Fig.
2
b, c). As expected, the release of high-mobility group box 1
(HMGB1), a typical DAMP involved in oxidative stress and cell
death response
9, was increased in Nupr1
−/−mPDAC cells
fol-lowing treatment with erastin or RSL3 (Fig.
2
d).
Conversely, the iron chelator deferoxamine (DFO) or the
antioxidant N-acetylcysteine (NAC) blocked erastin-induced or
RSL3-induced cell death in Nupr1
−/−mPDAC cells (Fig.
2
e), an
effect that was associated with decreased production or release of
MDA, 8-OHdG, or HMGB1 (Fig.
2
b–d). Similarly to Nupr1
−/−mPDAC cells, NUPR1-knockdown PANC1 cells exhibited
increased MDA, 8-OHdG, and HMGB1 release during ferroptotic
cell death, which could be reversed by the addition of DFO or
NAC (Supplementary Fig. 3). Of note, the shRNA-mediated
knockdown of six-transmembrane epithelial antigen of the
prostate 3 (Steap3), an enzyme responsible for converting Fe
3+to Fe
2+, blocked erastin-induced or RSL3-induced cell death and
HMGB1 release in Nupr1
−/−mPDAC cells (Fig.
2
f–h). Together,
these
findings indicate that NUPR1 blocks ferroptosis through the
inhibition of iron-dependent oxidative damage.
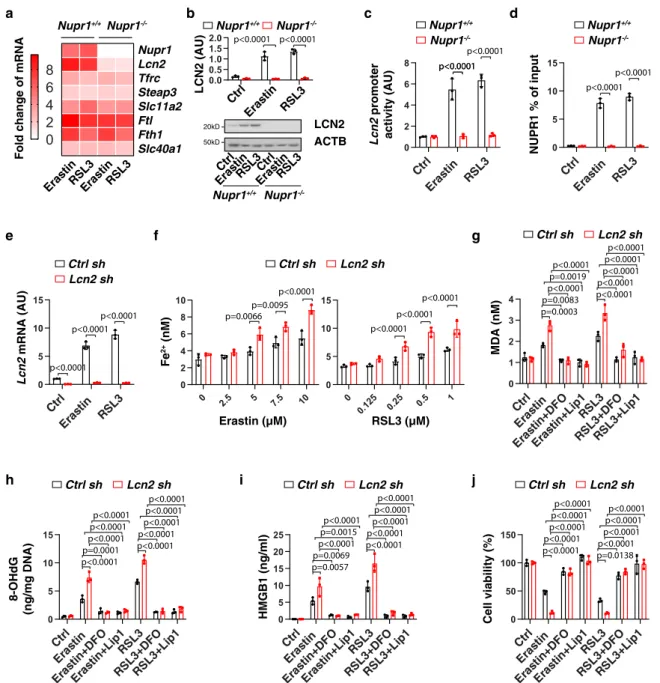
LCN2 acts as an effector gene of NUPR1 in blocking
ferrop-tosis. The levels of intracellular iron are determined by its uptake,
storage, release, and metabolism
25. In brief, after uptake by
transferrin receptor (TFRC, also known as TFR1), Fe
3+is
reduced to Fe
2+by STEAP3 and then released from the
endo-some to the cytoplasm by solute carrier family 11 member 2
(SLC11A2, also known as DMT1). Ferritin, including ferritin light
chain (FTL) and ferritin heavy chain 1 (FTH1), functions as a
major iron storage protein. Finally, the release of Fe
2+into the
extracellular space requires iron transporters, such as solute
carrier family 40 member 1 (SLC40A1, also known as
ferro-portin-1) and yet another ion transporter, LCN2. Among the key
genes for iron metabolism (e.g., Lcn2, Tfrc, Steap3, Slc11a2, Ftl,
Fth1, and Slc40a1), erastin-induced or RSL3-induced the
cells (Fig.
3
a). Consistent with the mRNA assay, erastin-induced
or RSL3-induced protein expression of LCN2 was abolished in
Nupr1
−/−mPDAC cells (Fig.
3
b). Luciferase reporter gene
(Fig.
3
c) and chromatin immunoprecipitation (Fig.
3
d) assays
further revealed that Lcn2 is a direct target gene of NUPR1 in
mPDAC cells during ferroptosis. As expected, the knockdown of
ATF4 by shRNA suppressed LCN2 mRNA expression in
PANC1 cells following erastin or RSL3 treatment (Supplementary
Fig. 1e). However, overexpression of ATF4 failed to induce Lcn2
upregulation in Nupr1
−/−mPDAC cells following erastin or
RSL3 treatment (Supplementary Fig. 1f, g). These
findings
con-firm that ATF4-dependent NUPR1 expression is required for
subsequent LCN2 expression during ferroptosis.
We next examined whether the genetic silence of LCN2 has a
pro-ferroptotic phenotype similar to that of Nupr1-deficient cells.
Indeed, shRNA-based Lcn2/LCN2 suppression increased Fe
2+accumulation, oxidative damage (MDA and 8-OHdG), HMGB1
release and cell death in mPDAC (Fig.
3
e–j) or PANC1
a
c
Gene rank position
Log
2
fold change
PANC1 BxPC3
NUPR1
Gene rank position
NUPR1 Cell viability (%) Erastin (µM) Nupr1+/+ Nupr1 -/-Nupr1-/-+ferrostatin-1 Nupr1-/-+liproxstatin-1 Nupr1-/-+Z-VAD-FMK Nupr1-/-+necrosulfonamide RSL3 (µM)
e
f
Cell viability (%)Nupr1+/+ Nupr1-/- Nupr1-/-+Nupr1 cDNA
Erastin (µM) RSL3 (µM) 0 200 400 600 800 0 2 4 6 8 10 0 200 400 600 800 0 2 4 6 8 10 NUPR1
b
PANC1 BxPC3 FGF12 CCND2 FGF17 IL1R2 CALML5 IL5RA LEFTY2 IGFBP3Top 5 up-regulated genes
d
Lipid ROS (fold)
Erastin (10 µM) RSL3 (1 µM) p<0.0001 p<0.0001 p<0.0001 p<0.0001 p<0.0001 p<0.0001 Nupr1+/+ Nupr1 -/-Nupr1-/-+ferrostatin-1 Nupr1-/-+liproxstatin-1 Nupr1-/-+Z-VAD-FMK Nupr1-/-+necrosulfonamide p<0.0001 p<0.0001p<0.0001 p<0.0001p<0.0001 p<0.0001 Nupr1 mRNA (AU) p<0.0001 p<0.0001 0 1 2 3 4 5 0 1 2 3 4 0 2.5 5 7.5 10 0 50 100 150 p<0.0001 p=0.0001 p<0.0001 p<0.0001 p<0.0001 p<0.0001 p<0.0001 p=0.0004 0 0.125 0.2 5 0.5 1 0 50 100 150
Lipid ROS (fold)
Cell viability (%) p=0.0001 p<0.0001 p<0.0001 p<0.0001 p=0.0003 p<0.0001 p=0.0116 p<0.0001 0 2.5 5 7.5 10 0 50 100 150 0 0.125 0.2 5 0.5 1 0 50 100 150 0.0 0.5 1.0 1.5 Nupr1+/+ Nupr1
-/-Nupr1-/-+Nupr1 cDNA
Fig. 1 NUPR1 acts as a repressor of ferroptosis. a A NanoString technology-based screening of differentially expressed tumor-associated genes in PANC1 and BxPC3 cells following treatment with erastin (10µM) for 24 h. b Top 5 upregulated genes. c, d Nupr1+/+and Nupr1−/−mPDAC cells were treated with erastin or RSL3 in the absence or presence of ferrostatin-1 (1µM), liproxstatin-1 (1 µM), Z-VAD-FMK (10 µM), or necrosulfonamide (1 μM) for 24 h, and then cell viability (c) and lipid ROS (d) was measured (n= 3 well/group, two-way ANOVA with Tukey’s multiple comparisons test on all pairwise combinations).e qPCR analysis of NUPR1 expression in indicated mPDAC cells (n= 3 well/group, one-way ANOVA with Tukey’s multiple comparisons test on all pairwise combinations).f Cell viability of indicated mPDAC cells following treatment with erastin or RSL3 for 24 h (n= 3 well/group, two-way ANOVA with Tukey’s multiple comparisons test on all pairwise combinations). Data in d–f are presented as mean ± SD. The results in c–f are representative of those from 2 to 3 independent experiments with three technical replicates each. The results ina are representative of those from one independent experiment with three technical replicates each.
(Supplementary Fig. 4) cells following treatment with erastin or
RSL3, which was reversed by DFO or the ferroptosis inhibitor
liproxstatin-1. These
findings indicate that LCN2 plays a similar
role as NUPR1 in the inhibition of ferroptosis.
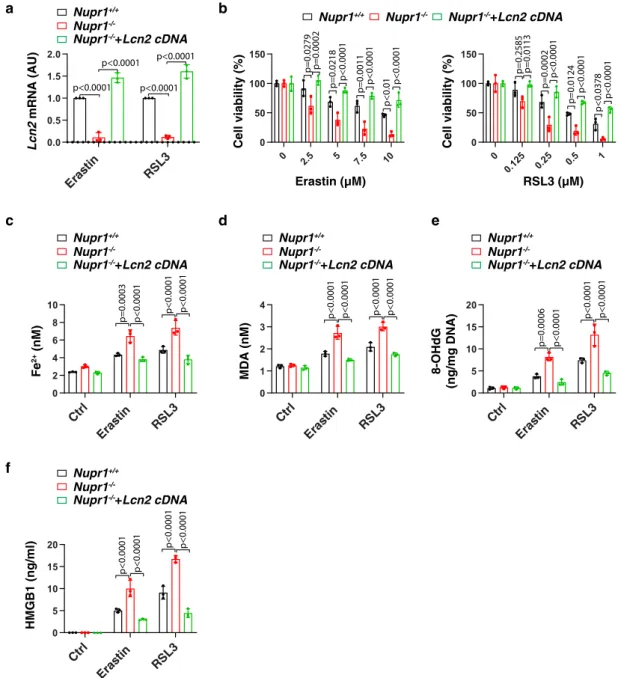
To determine whether the downregulation of LCN2 is essential
for the induction of ferroptosis, we re-expressed Lcn2 in Nupr1
−/−mPDAC cells by transfecting the Lnc2 gene (Fig.
4
a). The
transfection enforced expression of Lcn2 restored ferroptosis
resistance in Nupr1
−/−mPDAC cells, which was associated
with decreased Fe
2+accumulation, oxidative damage (MDA
and 8-OHdG), HMGB1 release, and cell death (Fig.
4
b–f). Thus,
our
findings demonstrated that NUPR1 blocks ferroptotic cell
0 0.125 0.2 5 0.5 1 0 2 4 6 8 10
a
c
Fe 2+ (nM) Erastin (µM) RSL3 (µM)b
Ctrl Erast in Erast in+D FO Erast in+N AC RS L3 RS L3+DFO RS L3+NAC Nupr1+/+ Nupr1 -/-MDA (nM) 8-OHdG (ng/mg DNA) HMGB1 (ng/ml) Cell viability (%)d
e
f
Steap3 mRNA (AU)g
Cell viability (%) Erastin RSL3h
HMGB1 (ng/ml) Ctrl Erast in Erast in+D FO Erast in+N AC RS L3 RSL3+DFORS L3+NAC p<0.0001 0 1 2 3 4 p=0.0087p<0.0001 p<0.0001p<0.0001 p<0.0001 p<0.0001p<0.0001 p<0.0001 p<0.0001 0 5 10 15 p<0.0001 p<0.0001p=0.0056 p<0.0001 p=0.0095 p<0.0001 p<0.0001 p<0.0001p<0.0001 p<0.0001 p<0.0001 Ctrl Eras tin Eras tin+DF O Eras tin+NA C RSL3 RS L3+DFO RSL3+NAC 0 5 10 15 20 25 p=0.0006 p<0.0001p=0.0002 p<0.0001 p<0.0001 p<0.0001 p<0.0001p<0.0001 p<0.0001 p<0.0001 p<0.0001 p<0.0001p<0.0001 p<0.0001 p<0.0001 p=0.0331 p<0.0001p<0.0001 p<0.0001 p<0.0001 Ctrl Eras tin Eras tin+DF O Eras tin+NA C RSL3 RS L3+DFO RSL3+NAC 0 50 100 150 Ctrl sh Stea p3 sh1 Stea p3 sh2 0.0 0.5 1.0 1.5 p<0.0001 p<0.0001p<0.0001 p<0.0001 Ctrl sh Stea p3 sh1 Stea p3 sh2 Ctrl sh Stea p3 sh1 Stea p3 sh2 Ctrl sh Stea p3 sh1 Stea p3 sh2 0 50 100 150 Vehicle Ctrl sh Stea p3 sh1 Ste ap3 sh2 Ctrl sh Stea p3 sh1 Stea p3 sh2 Ctrl sh Stea p3 sh1 Stea p3 sh2 0 5 10 15 20 Erastin RSL3 Vehicle p<0.0001p<0.0001 p<0.0001 p<0.0001 p<0.0001 p<0.0001p<0.0001 p<0.0001 p<0.0001 p<0.0001 p<0.0001p<0.0001 p<0.0001 p<0.0001 p<0.0001 p<0.0001p<0.0001 p<0.0001 p<0.0001 p<0.0001 Nupr1+/+ Nupr1-/-Nupr1+/+ Nupr1-/- Nupr1+/+ Nupr1
-/-Nupr1+/+ Nupr1-/- Nupr1+/+ Nupr1-/- Nupr1+/+ Nupr1
-/-0 2.5 5 7.5 10 0 2 4 6 8 10 Nupr1+/+ Nupr1 -/-p=0.0109p=0.001 p<0.0001 p=0.0038 p=0.001 p<0.0007
Fig. 2 NUPR1 inhibits iron-dependent oxidative damage in ferroptosis. a Fe2+levels in indicated mPDAC cells following treatment with erastin or RSL3 for 24 h (n= 3 well/group, two-way ANOVA with Tukey’s multiple comparisons test on all pairwise combinations). b–e Indicated mPDAC cells were treated with erastin (10µM) or RSL3 (1 µM) in the absence or presence of DFO (100 µM) or NAC (1 mM) for 24 h, and then intracellular MDA (b), intracellular 8-OHdG (c), extracellular HMGB1 (d), and cell viability (e) were assayed (n= 3 well/group, two-way ANOVA with Tukey’s multiple comparisons test on all pairwise combinations).f qPCR analysis of Steap3 mRNA in indicated mPDAC cells (n= 3 well/group, two-way ANOVA with Tukey’s multiple comparisons test on all pairwise combinations). g, h Indicated mPDAC cells were treated with erastin (10 µM) or RSL3 (1 µM) or vehicle (0.01% dimethyl sulfoxide) for 24 h, and then extracellular HMGB1 (g) and cell viability (h) were determined (n= 3 well/group, two-way ANOVA with Tukey’s multiple comparisons test on all pairwise combinations). Data in a–h are presented as mean ± SD. The results in a–h are representative of those from 2 to 3 independent experiments with three technical replicates each.
death through inducing the expression of the iron transporter
LNC2.
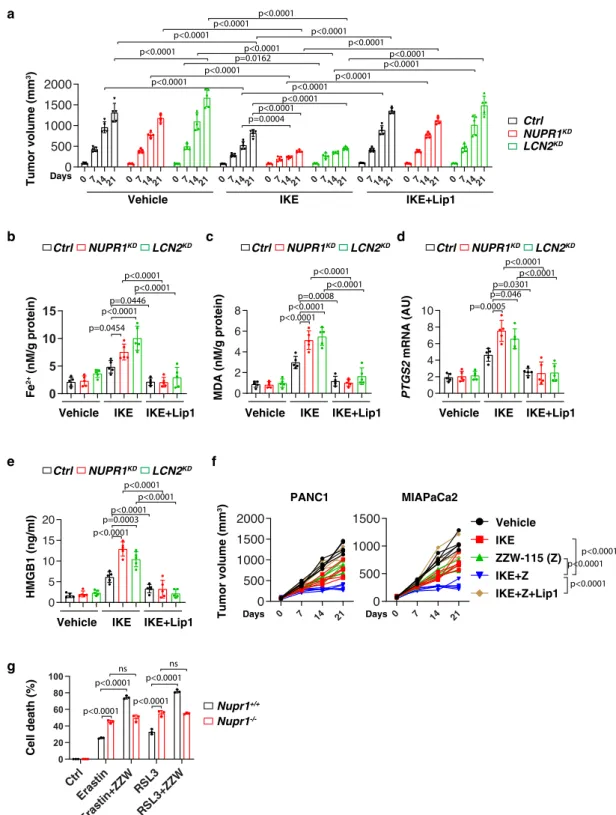
The NUPR1
–LCN2 pathway limits the anticancer activity of
IKE in vivo. We next sought to determine whether the inhibition
of the NUPR1–LCN2 pathway can enhance the in vivo anticancer
activity of imidazole ketone erastin (IKE), a metabolically stable
analog of erastin
26. Consistent with our in vitro observations,
NUPR1-knockdown (NUPR1
KD) or LCN2-knockdown (LCN21
KD)
PANC1 cells were more sensitive to IKE-induced tumor
suppres-sion compared to control groups in vivo, in a model in which
immunodeficient mice were bearing human PDAC cells (Fig.
5
a).
The inhibition of the NUPR1–LCN2 pathway conferred therapy
sensitivity that was associated with increased intratumoral Fe
2+(Fig.
5
b) or MDA levels (Fig.
5
c), mRNA expression of
prostaglandin-endoperoxide synthase 2 (PTGS2, an inducible
enzyme associated with inflammation and cell death events,
including ferroptosis
27) (Fig.
5
d) and circulating HMGB1 protein
p<0.0001
a
Fe 2+ (nM) Erastin (µM) RSL3 (µM)g
Ctrl sh Lcn2 sh MDA (nM) HMGB1 (ng/ml)i
Cell viability (%)j
h
8-OHdG (ng/mg DNA)b
ErastinRSL3Fold change of mRNA
ErastinRSL3 Nupr1+/+ Nupr1 -/-Nupr1 Lcn2 Tfrc Steap3 Slc11a2 Ftl Fth1 Slc40a1
0
2
4
6
8
c
Lcn2 promoter activity (AU)d
Nupr1+/+ Nupr1 -/-NUPR1 % of input Nupr1+/+ Nupr1-/-e
f
Ctrl sh Lcn2 sh Lcn2 mRNA (AU) LCN2 ACTB Erastin Ctrl RSL3Ctrl ErastinRSL3 Nupr1+/+ Nupr1 -/-LCN2 (AU) p<0.0001 p<0.0001 0.0 0.5 1.0 1.5 2.0 Ctrl Erastin RSL3 Ctrl Eras tin RSL3 0 2 4 6 8 p<0.0001p<0.0001 Ctrl Eras tin RSL3 0 5 10 15 p<0.0001 p<0.0001 Ctrl Eras tin RS L3 0 5 10 15 p<0.0001 p<0.0001 p<0.0001 0 2.5 5 7.5 10 0 2 4 6 8 10 p=0.0095p<0.0001 p=0.0066 Ctrl sh Lcn2 sh 0 0.125 0.2 5 0.5 1 0 5 10 15 p<0.0001 p<0.0001 p<0.0001 Ctrl Eras tin Eras tin+DF O Eras tin+Lip1RS L3 RSL3+DFORS L3+Lip 1 0 1 2 3 4 Ctrl sh Lcn2 sh Ctrl sh Lcn2 sh Ctrl sh Lcn2 sh p=0.0003 p<0.0001p=0.0019 p<0.0001 p=0.0083 p<0.0001 p<0.0001p<0.0001 p<0.0001 p<0.0001 Ctrl Eras tin Eras tin+DF O Eras tin+Lip1RS L3 RSL3+DFORS L3+Lip1 0 5 10 15 p<0.0001 p<0.0001p<0.0001 p<0.0001 p=0.0001 p<0.0001 p<0.0001p<0.0001 p<0.0001 p<0.0001 Ctrl Eras tin Eras tin+DF O Eras tin+Lip1RS L3 RSL3+DFORS L3+Lip1 0 5 10 15 20 25 p=0.0057 p<0.0001p=0.0015 p<0.0001 p=0.0069 p<0.0001 p<0.0001p<0.0001 p<0.0001 p<0.0001 Ctrl Eras tin Eras tin+D FO Eras tin+Lip1RS L3 RSL3+DFORS L3+Lip1 0 50 100 150 p<0.0001 p<0.0001p<0.0001 p<0.0001 p<0.0001 p=0.0138 p<0.0001p<0.0001 p<0.0001 p<0.0001 Nupr1+/+ Nupr1 -/-50kD 20kDFig. 3 LCN2 acts as an effector gene of NUPR1 in blocking ferroptosis. a Heatmap of relative mRNA levels of iron metabolism-associated genes in Nupr1+/+and Nupr1−/−mPDAC cells following treatment with erastin (10µM) or RSL3 (1 µM) for 24 h. b, c Analysis of LCN2 protein expression and Lcn2 promoter activity in Nupr1+/+and Nupr1−/−mPDAC cells following treatment with erastin (10µM) or RSL3 (1 µM) for 24 h (n = 3 well/group, one-tailed t test).d Binding of NUPR1 to Lcn2 promoter was analyzed using ChIP-qPCR in indicated mPDAC cells following treatment with erastin (10µM) or RSL3 (1µM) for 24 h (n = 3 well/group, one-tailed t test). e qPCR analysis of Lcn2 mRNA in indicated mPDAC cells following treatment with erastin (10 µM) or RSL3 (1µM) for 24 h (n = 3 well/group, one-tailed t test). f Fe2+levels in indicated mPDAC cells following treatment with erastin or RSL3 for 24 h (n= 3 well/group, two-way ANOVA with Tukey’s multiple comparisons test on all pairwise combinations). g–j Indicated mPDAC cells were treated with erastin (10µM) or RSL3 (1 µM) in the absence or presence of DFO (100 µM) or liproxstatin-1 (1 µM) for 24 h, and then intracellular MDA (g), intracellular 8-OHdG (h), extracellular HMGB1 (i), and cell viability (j) were quantified (n = 3 well/group, two-way ANOVA with Tukey’s multiple comparisons test on all pairwise combinations). Data inb–j are presented as mean ± SD. The results in a–j are representative of those from 2 to 3 independent experiments with three technical replicates each.
(Fig.
5
e), all of which were inhibited by the ferroptosis inhibitor
liproxstatin-1. In contrast, the apoptosis inhibitor Z-VAD-FMK or
the necroptosis inhibitor necrosulfonamide had no effects on the
increased anticancer activity of IKE in NUPR1
KDor LCN21
KDPANC1 cells (Supplementary Fig. 5). ZZW-115, a potent NUPR1
inhibitor
28, also increased the anticancer activity of IKE in PANC1 or
MIAPaCa2 xenograft mouse models (Fig.
5
f). These animal studies
support the contention that the NUPR1–LCN2 pathway limits the
anticancer activity of IKE. The synergistic effect on cell death by
ZZW-115 and erastin or RSL3 was diminished in Nupr1
−/−cells, but
not in Nupr1
+/+cells (Fig.
5
g), indicating that ZZW-115 bound
NUPR1 possesses dominant negative activity or, in other words, the
inhibition of NUPR1 is more effective than the loss of NUPR1.
LCN2 prevents pancreatitis. Excess iron is stored in multiple
organs, including the pancreas, which may cause tissue injury and
inflammation under pathologic conditions
29. We further
exam-ined the effects of Lcn2 depletion-mediated iron accumulation on
L
-arginine-induced acute pancreatitis in mice, a widely used
experimental model that can cause pancreatic oxidative injury,
sterile inflammation, and extensive necrosis
30. We generated
pancreas-specific Lcn2-knockout mice (Pdx1-Cre;Lcn2
flox/flox,
termed Lcn2
Pan−/−mice) by crossing Lcn2
flox/floxand Pdx1-Cre
mice. Western blot confirmed the expression of LCN2 was
diminished in the pancreas (but not in the liver) from Lcn2
Pan−/−mice, but not from control Lcn2
flox/floxmice (Fig.
6
a). Lcn2
Pan−/−mice were more sensitive to
L-arginine-induced acute pancreatitis,
a
b
Cell viability (%) Erastin (µM) RSL3 (µM)d
MDA (nM)e
8-OHdG (ng/mg DNA) HMGB1 (ng/ml)f
c
Fe 2+ (nM) Nupr1+/+ Nupr1 -/-Nupr1-/-+Lcn2 cDNA Lcn2 mRNA (AU) p<0.0001 p<0.0001 p<0.0001 p<0.0001 0 2.5 5 7.5 10 0 50 100 150 p=0.0002 p=0.0279 p=0.0218 p<0.0001 p=0.0011 p<0.0001 p<0.01 p<0.0001 Cell viability (%) p=0.2585 p=0.0113 p=0.0002 p<0.0001 p=0.0124 p<0.0378 p<0.0001 p<0.0001 0 0.125 0.25 0.5 1 0 50 100 150Nupr1+/+ Nupr1-/- Nupr1-/-+Lcn2 cDNA
p=0.0003 p<0.0001 p<0.0001 p<0.0001 p<0.0001 p<0.0001 p<0.0001 p<0.0001 Ctrl Eras tin RS L3 0 5 10 15 20 p=0.0006 p<0.0001 p<0.0001 p<0.0001 Ctrl Eras tin RS L3 0 1 2 3 4 Ctrl Eras tin RS L3 0 2 4 6 8 10 Ctrl Eras tin RS L3 0 5 10 15 20 p<0.0001 p<0.0001 p<0.0001 p<0.0001 Nupr1+/+ Nupr1 -/-Nupr1-/-+Lcn2 cDNA Nupr1+/+ Nupr1 -/-Nupr1-/-+Lcn2 cDNA Nupr1+/+ Nupr1 -/-Nupr1-/-+Lcn2 cDNA Nupr1+/+ Nupr1 -/-Nupr1-/-+Lcn2 cDNA Eras tin RS L3 0.0 0.5 1.0 1.5 2.0
Fig. 4 Re-expression of LCN2 rescues ferroptosis resistance inNupr1-deficient cells. a qPCR analysis of Lcn2 mRNA in indicated mPDAC cells following treatment with erastin (10µM) or RSL3 (1 µM) for 24 h (n = 3 well/group, two-way ANOVA with Tukey’s multiple comparisons test on all pairwise combinations).b Cell viability in indicated mPDAC cells following treatment with erastin or RSL3 for 24 h (n= 3 well/group, two-way ANOVA with Tukey’s multiple comparisons test on all pairwise combinations). c–f Indicated mPDAC cells were treated with erastin (10 µM) or RSL3 (1 µM) for 24 h, and then intracellular Fe2+(c), intracellular MDA (d), intracellular 8-OHdG (e), and extracellular HMGB1 were assayed (n= 3 well/group, two-way ANOVA with Tukey’s multiple comparisons test on all pairwise combinations). Data in a–f are presented as mean ± SD. The results in a–f are representative of those from 2 to 3 independent experiments with three technical replicates each.
0 7 14 21 0 7 14 21 0 7 14 21 0 7 14 21 0 7 14 21 0 7 14 21 0 7 14 21 0 7 14 21 0 7 14 21 0 500 1000 1500 2000
a
Tumor volume (mm 3) Vehicle IKEc
d
e
Ctrl NUPR1KD LCN2KD IKE+Lip1 Days MDA (nM/g protein) PTGS2 mRNA (AU) Fe 2+ (nM/g protein)b
HMGB1 (ng/ml)Vehicle IKE IKE+Lip1 Vehicle IKE IKE+Lip1 Vehicle IKE IKE+Lip1
Vehicle IKE IKE+Lip1 Ctrl NUPR1KD LCN2KD
f
Tumor volume (mm 3) Days Vehicle IKE IKE+Z ZZW-115 (Z) IKE+Z+Lip1 Days PANC1 MIAPaCa2g
p<0.0001 p=0.0004 p=0.0162 p<0.0001 p<0.0001 p<0.0001 p<0.0001 p<0.0001 p<0.0001p<0.0001 p<0.0001 p<0.0001p<0.0001 p<0.0001 p<0.0001 p<0.0001 p<0.0001 Ctrl NUPR1KD LCN2KD Ctrl NUPR1KD LCN2KD Ctrl NUPR1KD LCN2KD 0 5 10 15 p=0.0454 p<0.0001p=0.0446 p<0.0001 p<0.0001 0 2 4 6 8 p<0.0001p<0.0001 p=0.0008p<0.0001 p<0.0001 0 2 4 6 8 10 p=0.0005 p=0.046p=0.0301 p<0.0001 p<0.0001 0 5 10 15 20 p<0.0001 p=0.0003p<0.0001 p<0.0001 p<0.0001 0 7 14 21 0 500 1000 1500 0 7 14 21 0 500 1000 1500 2000 p<0.0001 p<0.0001 p<0.0001 Cell death (%) Nupr1+/+ Nupr1 -/-p<0.0001 p<0.0001 ns Ctrl Eras tin Eras tin+ZZWRS L3 RSL3+ZZW 0 20 40 60 80 100 p<0.0001 p<0.0001 nsFig. 5 The NUPR1–LCN2 pathway limits ferroptotic cancer cell death in vivo. a Athymic nude mice were injected subcutaneously with indicated PDHA1-knockdown (NUPR1KD) or LCN2-knockdown (LCN2KD) PANC1 cells for 7 days and then treated with IKE (40 mg/kg, i.p., once every other day) in the absence or presence of liproxstatin-1 (10 mg/kg, i.p., once every other day) at day 7 for 2 weeks. Tumor volumes were calculated weekly (n= 5 mice/ group; two way ANOVA with Tukey’s multiple comparisons test on all pairwise combinations). b–e In parallel, the levels of Fe2+(b), MDA (c), or PTGS2 mRNA (d) in isolated tumors and serum HMGB1 (e) at day 14 after treatment were assayed (n= 5 mice/group; one-way ANOVA with Tukey’s multiple comparisons test on all pairwise combinations).f Athymic nude mice were injected subcutaneously with PANC1 or MIAPaCa2 cells for 7 days and then treated with IKE (40 mg/kg, i.p., once every other day) in the absence or presence of ZZW-115 (5 mg/kg, i.p., once every other day) or liproxstatin-1 (10 mg/kg, i.p., once every other day) at day 7 for 2 weeks. Tumor volumes were calculated weekly (n= 5 mice/group; two-way ANOVA with Tukey’s multiple comparisons test on all pairwise combinations).g Indicated mPDAC cells were treated with erastin (10µM) or RSL3 (1 µM) in the absence or presence ZZW-115 (2µM) for 24 h and then cell death was assayed (n = 3 well/group, two-way ANOVA with Tukey’s multiple comparisons test on all pairwise combinations). ns: not significant. Data in a–e and g are presented as mean ± SD. The results in a–g are representative of those from 2 to 3 independent experiments.
a
Pancreas Liver LCN2 ACTBb
Pdx1-Cre Cre Flox Lcn2flox/flox Pdx1-Cre;Lcn2flox/flox Lcn2 Pan-/-Lcn2 Pan-/-Survival (%) Lcn2 flox/flox Lcn2 Pan-/-Lcn2 flox/flox Lcn2 Pan-/-Lcn2flox/floxc
d
0 2 4 6 8 0 50 100 0 2 4 6 8 0 2 4 6 8Vehicle DFO Lip1
Days
Lcn2
Pan-/-Lcn2
flox/flox
Vehicle DFO Lip1
Amylase (U/L) Lcn2 Pan-/-Lcn2flox/flox 48 h 72 h
e
48 h 72 h MPO (U/mg)f
HMGB1 (ng/ml) 48 h 72 hg
48 h 72 hh
48 h 72 h MDA (nM/g protein) Ptgs2 mRNA (AU) p=0.0467 Vehicl e DFO Lip1 Vehicl e DFO Lip1 0 5000 10000 15000 20000 Vehicl e DFO Lip1 Vehicl e DFO Lip1 0 2000 4000 6000 8000 10000 Vehicl e DFO Lip1 Vehic le DFO Lip1 0 10 20 30 Vehicl e DFO Lip1 Vehicl e DFO Lip1 0 20 40 60 Vehicl e DFO Lip1 Vehicl e DF O Lip1 0 5 10 15 20 p=0.0013ns p<0.0001 ns p<0.0001 p<0.0001 p<0.0001p<0.0001 p=0.005p<0.0001 p=0.0076ns p=0.0005ns p=0.0021 p<0.0001 p=0.0002p<0.0001 p<0.0001p<0.0001 p<0.0001 p=0.0014p<0.0001 p=0.0005p<0.0001 p<0.0001 p<0.0001p<0.0001 p<0.0001p<0.0001 p<0.0001 p<0.0001 p<0.0001p<0.0001 p<0.0001 p=0.0003 p=0.0001p<0.0001 p=0.0002p<0.0001 p<0.0001 p<0.0001p<0.0001 p<0.0001p<0.0001 p<0.0001ns p<0.0001 ns p<0.0001 Lcn2 Pan-/-Lcn2flox/flox Lcn2 Pan-/-Lcn2flox/flox Lcn2 Pan-/-Lcn2flox/flox Lcn2 Pan-/-Lcn2flox/flox 50kD 20kDFig. 6 LCN2 prevents pancreatitis through the inhibition of ferroptosis. a Western blot analysis of LCN2 expression in the pancreas and liver in Lcn2flox/floxand pancreas-specific conditional Lcn2 knockout mice (Lcn2Pan−/−).b Animal survival in Lcn2flox/floxand Lcn2Pan−/−mice in response to
L-arginine-induced acute severe pancreatitis in the absence or presence of liproxstatin-1 or DFO (n= 10 mice/group; one-sided Log-rank [Mantel–Cox]
test).c–h In parallel, hematoxylin and eosin-stained pancreatic sections (c), serum amylase (d), pancreatic MPO (e), serum HMGB1 (f), pancreatic MDA (g), and mRNA expression of Ptgs2 in the pancreas (h) were assayed at the indicated time points (n= 3 mice/group; two-way ANOVA with Tukey’s multiple comparisons test on all pairwise combinations). Bar= 50 μm. ns: not significant. Data in d–h are presented as mean ± SD. The results in b–h are representative of those from two independent experiments. The results in (a) are from an independent experiment.
hence exhibiting increased mortality (Fig.
6
b), aggravated
pan-creatic histological damage (Fig.
6
c), and elevated serum amylase
(a diagnostic biomarker of acute pancreatitis) (Fig.
6
d), pancreatic
myeloperoxidase (MPO, a marker of neutrophil recruitment)
(Fig.
6
e), serum HMGB1 (Fig.
6
f), pancreatic MDA (Fig.
6
g), and
Ptgs2 mRNA (Fig.
6
h). This phenotype of Lcn2
depletion-mediated acute pancreatitis could be prevented by treatment with
the ferroptosis inhibitor liproxstatin-1 or the iron chelator DFO
(Fig.
6
b–h). Collectively, these studies suggest that LCN2 exerts a
protective effect on acute pancreatitis potentially through the
inhibition of ferroptotic response.
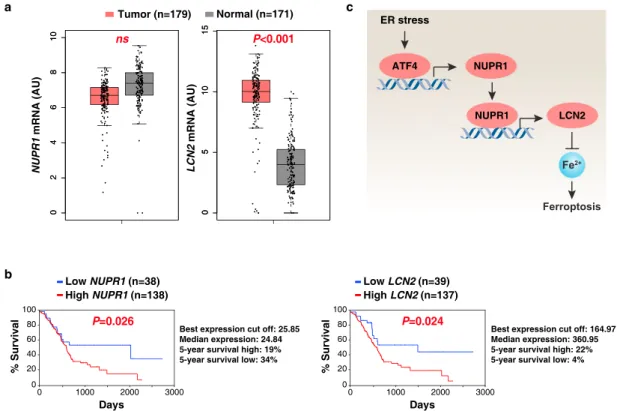
Prognostic significance of the NUPR1–LCN2 pathway in
human PDAC. Previous animal studies indicate that NUPR1 and
LCN2 may play an oncogene-like role in PDAC
31,32. To test this
possibility, we carried out bioinformatics analyses using a publicly
available gene expression dataset: the Cancer Genome Atlas
(TCGA). LCN2 (but not NUPR1) mRNA expression was
upre-gulated in the PDAC tumor group compared to the normal group
(Fig.
7
a). An overall survival assay revealed that a low expression
of NUPR1 or LCN2 was correlated with increased survival of
PDAC patients (Fig.
7
b). These analyses indicate that activation
of the NUPR1–LCN2 pathway may contribute to the
develop-ment of human PDAC.
Discussion
There is a clear role for transcription factors in human health and
disease, highlighting the importance of continued efforts for
understanding gene expression modulation in physiological and
pathological processes, including cell death
33. In this study, we
demonstrated that NUPR1 is critical for activating a
transcrip-tional program that may block ferroptotic cell death or tissue
injury through the upregulation of LCN2 expression (Fig.
7
c),
providing a potential strategy for the treatment of
ferroptosis-related diseases.
NUPR1 is a member of AT hook-containing chromosomal
DNA-binding proteins that was
first identified and cloned in a
study of pancreatitis-induced tissue injury
34. Like other
archi-tectural chromatin-binding proteins, NUPR1 participates in a
wide range of DNA-relevant events, such as gene transcription,
DNA repair, and chromosome recombination
35–39. NUPR1 is
also a multifunctional stress-inducible protein that is produced in
response to diverse environmental stresses, including oxidative
damage and the unfolded protein response
40–45. ATF4, a
repressor of ferroptosis in PDAC cells
22, has been shown to
regulate NUPR1 expression in response to various stresses,
including ER stress
46. We found that ATF4 is required for
NUPR1 expression in response to ferroptosis activators. NUPR1
regulates cellular processes mainly by activating its target
genes
40,47. Our current study establishes an inhibitory role for
NUPR1 in regulating ferroptosis through directly upregulating
LCN2 expression. We found that the depletion of NUPR1 or
LCN2 had a similar pro-ferroptotic phenotype in human or
mouse PDACs, whereas re-expression of LCN2 reversed the
exaggerated ferroptosis observed in Nupr1
−/−cells. Combined
with other studies on models of apoptosis
31,48, necroptosis
28,44and autophagy-dependent cell death
41,49,50, the present study
suggests that the activation of NUPR1 may play a universal
cytoprotective role. Since ATF4 has been shown to promote the
expression of solute carrier family 7 member 11 (SLC7A11, a
component of the antiporter system xc
−that inhibits ferroptosis
by importing the amino acid cystine for glutathione production in
cells)
21, it is necessary to investigate whether NUPR1 is also
involved in ATF4-mediated SLC7A11 expression in the future.
Fig. 7 Prognostic significance of the NUPR1–LCN2 pathway in human PDAC. a Upregulation of LCN2 (but not NUPR1) gene expression within the tumor from PDAC patients compared to normal controls using datasets from the Cancer Genome Atlas (TCGA) (one-tailed t test). The data are presented as box-and-whisker plots. Boxes represent the median and the 25th and 75th percentiles. ns: not significant. n is number of cases. b Kaplan–Meier survival analysis of NUPR1 and LCN2 gene expression in PDAC patients using TCGA datasets (one-sided Log-rank [Mantel–Cox] test). n is number of cases. c Schematic representation of the role of NUPR1 in the regulation of ferroptosis in human PDAC cells.
Our studies reveal a role for NUPR1 in preventing intracellular
iron accumulation in response to ferroptosis activators.
Ferrop-tosis is generally recognized as an iron-dependent oxidative death,
which can be suppressed by iron chelators, the depletion of the
iron uptake receptor TFRC or the overexpression of the iron
storage protein ferritin
8. Given that depletion of NUPR1 increased
iron accumulation induced by classical ferroptosis activators
(erastin or RSL3), the expression levels of core iron
metabolism-associated genes were measured in WT and Nupr1
−/−cells. Such
analyses led to the conclusion that Lcn2, but none of the other iron
metabolism-relevant genes, functions as a direct downstream
target gene regulated by NUPR1. Although the function of LCN2
in iron metabolism is still unclear, it has been suggested to be
involved in the extrusion of iron from the intracellular to the
extracellular compartment
51–53. Blocking NUPR1-dependent
LCN2 expression significantly increased intracellular iron
con-centrations and subsequent oxidative damage, including lipid
peroxidation and DNA damage. These observations established a
NUPR1-dependent LCN2-regulatory pathway for ferroptosis
(Fig.
7
c).
While the function of mitochondria in ferroptosis is
context-dependent
3,54,55, mitochondria are widely recognized as a major
source of iron-induced ROS
56. Mitochondria also utilize iron for
the synthesis of heme and iron sulfur, which can form a feedback
to amplify or diminish ferroptosis
57,58. In view of previously
established links between the downregulation of NUPR1
expression and the increased mitochondria-dependent apoptosis
in some types of cells
31,48, it is possible that NUPR1
downregulation-mediated iron accumulation functions as a
common upstream signal to trigger mitochondrial dysfunction,
thus compromising cellular survival and
fitness by negatively
affecting aerobic glycolysis, oxidative phosphorylation, and fatty
acid synthesis
44,54,59–62.
Our
findings highlight a potential functional role of the
NUPR1–LCN2 pathway in the regulation of ferroptosis-related
tumor therapy. While the deletion of Nupr1 in mice prevents
mutated Kras-induced tumorigenesis
31,63, we found that the
pharmacological or genetic inhibition of the NUPR1–LCN2
pathway enhanced anticancer activity of ferroptosis activators in
PDAC cells in vitro or in preclinical mouse models. Ferroptosis
seems to play a dual role in tumor biology, which is
context-dependent. On the one hand, ferroptosis activators can kill cancer
cells or active antitumor immunity to suppress tumor growth
64–66.
On the other hand, ferroptosis-mediated inflammatory response
may promote tumor growth through the release of DAMPs
67,68.
Further exploration of the cellular and functional relevance of
ferroptosis in the tumor microenvironment would be important to
develop better anticancer therapeutic strategies.
We addressed a potential pathologic link between ferroptosis
and pancreatitis using Lcn2
Pan−/−mice, knowing that excessive
ferroptosis can compromise the function of entire organs
including the kidney, liver, brain, heart, and pancreas
7. Compared
to WT mice, Lcn2
Pan−/−mice exhibited increased sensitivity to
experimental pancreatitis-mediated animal death. In contrast, the
inhibition of ferroptosis by liproxstatin-1 or by using the iron
chelator DFO protected against pancreatic injury, lipid
perox-idation, HMGB1 release, and PTGS2 expression, leading to
pro-longed animal survival in Lcn2
Pan−/−mice. In addition to
PTGS2, transferrin receptor (TFRC) and acyl-CoA synthetase
long chain family member 4 (ACSL4) have also been used to
monitor ferroptotic response under different conditions
59,69.
However, the specific quantitative markers of ferroptotic death
in vivo have not yet been determined. Given that LCN2 plays a
wide role in preventing infection and sterile inflammation in
various animal models
51–53, LCN2-mediated ferroptosis
resis-tance may be a common mechanism driving cell protection and
reducing morbidity and mortality, a possibility that awaits further
investigation in future studies.
In summary, our studies reveal a potential negative role for
NUPR1 in ferroptosis. The crosstalk between gene transcription
and iron metabolism may have broad implications for
modulat-ing ferroptosis in pathologic conditions.
Methods
Reagents. Erastin (S7242), ferrostatin-1 (S7243), liproxstatin-1 (S7699), RSL3 (S8155), IKE (S8877), DFO (S5742), NAC (S5804), Z-VAD-FMK (S7023), and necrosulfonamide (S8251) were purchased from Selleck Chemicals.L-arginine (A5131) was purchased from Sigma-Aldrich. ZZW-115 (PC-36152) was purchased from ProbeChem. The antibody to ACTB (3700; RRID:AB_2242334; 1:1000) was obtained from Cell Signaling Technology. The antibody to LCN2 (ab63929; RRID: AB_1140965; 1:500) was obtained from Abcam. The antibody to NUPR1 (SAB2109172 [RRID:AB_2868575; 1:500] or sc-23283 [RRID:AB_2157971; 1:100]) was obtained from Sigma-Aldrich or Santa Cruz Biotechnology.
Cell culture. The PANC1 (CRL-1469) and MIAPaCa2 (CRL-1420) cell lines were obtained from the American Type Culture Collection. PHsPDAC cells were a gift from Yangchun Xie and they were generated from patient tumor specimens70,71. WT and Nupr1−/−mPDAC cells were generated from Nupr1+/+ ;Pdx1-cre;LSL-KrasG12Dor Nupr1−/−;Pdx1-cre;LSL-KrasG12Dmice, respectively, which was a gift
from Juan Iovanna (Centre de Recherche en Cancérologie de Marseille, INSERM, France). WT and Nupr1−/−mPDAC were used at <10 passages. These cells were cultured in Dulbecco’s modified Eagle’s medium (Thermo Fisher Scientific, 11995073) supplemented with 10% heat-inactivated fetal bovine serum (Thermo Fisher Scientific, A3840001) and 1% penicillin and streptomycin (Thermo Fisher Scientific, 15070-063) at 37 °C, 95% humidity, and 5% CO2. Cell line identity was validated by short tandem repeat profiling, and routine mycoplasma testing was negative for contamination.
Cell viability assay. Cell viability was assayed by a CCK8 kit (Dojindo Labora-tories, CK04). In brief, cells were seeded into 96-well plates and incubated with the indicated treatments. Subsequently, 100μl of fresh medium was added to cells containing 10μl of CCK-8 solutions and incubated for 2 h (37°C, 5% CO2). Absorbance at 450 nm was measured using a microplate reader (Cytation 5 Cell Imaging Multi-Mode Reader). In addition, a Countess II FL Automated Cell Counter (Thermo Fisher Scientific) was used to assay the percentages of dead cells after cell staining with 0.4% trypan blue solution (Thermo Fisher Scientific, T10282).
RNAi and gene transfection. Mouse Nupr1-cDNA (EX-Mm07534-M02) or Lcn2-cDNA (EX-Mm03601-M02) or or Atf4-Lcn2-cDNA (EX-Mm20335-M02) were pur-chased from GeneCopoeia. Human NUPR1-shRNA (sequence: CCGGGGAT-GAATCTGACCTCTATAGCTCGAGCTATAGAGGTCAGATTCATCCTTTT TG), human LCN2-shRNA (sequence: CCGGGCTGGGCAACATTAAGAGTTAC TCGAGTAACTCTTAATGTTGCCCAGCTTTTTG), human ATF4-shRNA-1 (sequence: CCGGGCCTAGGTCTCTTAGATGATTCTCGAGAATCATCTAAGA GACCTAGGCTTTTT), human ATF4-shRNA-2 (sequence: CCGGGTTGGTCA GTCCCTCCAACAACTCGAGTTGTTGGAGGGACTGACCAACTTTTT), mouse Lcn2-shRNA (sequence: CCGGCCAGGACTCAACTCAGAACTTCTCGA GAAGTTCTGAGTTGAGTCCTGGTTTTTG), mouse Steap3-shRNA-1 (sequence: CCGGACAGCGAGGTGATGATATATGCTCGAGCATATATCATC ACCTCGCTGTTTTTTG), and mouse Steap3-shRNA-2 (sequence: CCGGCGC TCCCGTCCATTGCTAATTCTCGAGAATTAGCAATGGACGGGAGCGTTTT TG) were obtained from Sigma-Aldrich. Transfection with shRNA or cDNA was performed with Lipofectamine 3000 (Invitrogen, L3000-015) according to the manufacturer’s instructions.
NanoString nCounter analysis. Total RNA from tumors was extracted using the RNeasy Plus Mini Kit (QIAGEN, 74136) and hybridized with the NanoString nCounter Human PanCancer Pathways Panel Code Set (NanoString) with 770 genes from 13 cancer-associated canonical pathways, including MAPK, STAT, PI3K, RAS, cell cycle, apoptosis, Hedgehog, Wnt, DNA damage control, tran-scriptional regulation, chromatin modification, and TGF-β19. Briefly, 100 ng of scaled RNA was hybridized with biotin-labeled capture probes andfluorescently labeled reporter probes for 18 h at 65 °C. Subsequently, the strip tubes were placed into the nCounter Prep Station for automated sample purification and subsequent reporter capture. Each sample was scanned for 600 FOV on the nCounter Digital Analyzer. NanoString results were produced from RCCfiles using nSolver Analysis Software 3.0.
qPCR analysis. Total RNA was extracted and purified from cultured cells or tissues using the RNeasy Plus Mini Kit (QIAGEN, 74136) according to the manufacturer’s instructions. The RNA was quantified by determining absorbance at 260 nm. One microgram of total RNA from each sample was reverse-transcribed into cDNA
using the iScript cDNA synthesis kit (Bio-Rad, 170-8891) in a volume of 20μl; cDNA from cell samples was amplified. The qPCR was performed using SsoFast EvaGreen Supermix (Bio-Rad, 172-5204) on the C1000 Touch Thermocycler CFX96 Real-Time System (Bio-Rad) according to the manufacturer’s protocol. Analysis was performed using Bio-Rad CFX Manager software 3.1 (Bio-Rad). The specific primers were listed in Supplementary Table 1. The gene expression was calculated via the 2−ΔΔCtmethod and normalized to 18SRNA/18srna72. The rela-tive concentrations of mRNA were expressed in arbitrary units based on the untreated group, which was assigned a value of 1.
Western blot. Cells were lysed in 1× cell lysis buffer (Cell Signaling Technology, 9803) containing protease inhibitor (ROCHE, 11836153001) on ice for 10 min. After centrifugation at 14,000 × g for 15 min at 4 °C, the supernatants were col-lected and quantified using BCA assay (Thermo Fisher Scientific, 23225). The 30 μg of each sample was resolved on 4–12% Criterion XT Bis–Tris gels (Bio-Rad, 3450124) in XT MES running buffer (Bio-Rad, 1610789) and transferred to PVDF membranes (Bio-Rad, 1620233) using the Trans-Blot Turbo Transfer Pack and System (Bio-Rad)73. After blocking by TBST containing 5% skim milk for 1 h, the membrane was incubated overnight at 4 °C with various primary antibodies (1:200–1:1000). After incubation with peroxidase-conjugated secondary antibodies (goat anti-rabbit IgG secondary antibody [Cell Signaling Technology, 7074, RRID: AB_2099233, 1:1000]; horse anti-mouse IgG secondary antibody [Cell Signaling Technology, 7076, RRID:AB_330924, 1:1000]; rabbit anti-goat IgG secondary antibody [Abcam, ab6741, RRID:AB_955424, 1:1000]) for 1 h at room temperature, the signals were visualized using enhanced chemiluminescence (Thermo Fisher Scientific, 34095). We collected protein from each cell line in three biologically independent samples and mixed them together for western blot analysis, and repeated twice. The relative intensities of the bands of western blots from three regions were automatically analyzed and normalized to a loading control using the ChemiDoc Touch Imaging System Version 1.2 (Bio-Rad). Source data of images of western blot bands are provided as a Source Datafile.
Biochemical assay. Commercially available enzyme-linked immunosorbant assay (ELISA) kits were used to measure the concentrations or activity of HMGB1 (Shino Test Corporation, ST51011), amylase (BioVision, K711), MPO (BioVision, K744), iron (Abcam, ab83366), MDA (Abcam, ab118970), and 8-OHdG (Cell Biolabs, STA-320) in indicated samples according to the manufacturer’s instructions. Data were normalized to protein or DNA concentration. In addition, C11-BODIPY probe (Thermo Fisher Scientific, D3861) was used to detect lipid ROS in cells.
Secrete-pair luminescence and ChIP assay. Dual-reporter promoter clones or controls were transfected into two cell lines in duplicates. Indicated WT and Nupr1−/−cells were transfected with pEZX-PG04-Lcn2 promoter Gaussia luci-ferase/secreted alkaline phosphatase (GeneCopoeia, MPRM39850-PG04). After 48 h, these cells were treated with erastin (10 µM) or RSL3 (1 µM) at indicated times. The Lcn2 promoter luciferase activity was measured with a Secrete-Pair Dual Luminescence Assay Kit (GeneCopoeia, SPDA-D010) in accordance with the manufacturer’s guidelines. The chromatin immunoprecipitation (ChIP) assay was performed using the Pierce Magnetic ChIP Kit (Thermo Scientific, 26157). This kit contained reagents to lyse cells and extract and solubilize the crosslinked com-plexes. The complexes were then incubated with anti-NUPR1 antibody (Santa Cruz Biotechnology, sc-23283) and isolated using Pierce Protein A/G Magnetic Beads. After reversing crosslinks and digesting protein, the resulting DNA fragments were purified. One-twentieth of the immunoprecipitated DNA was used in qPCR. The results were shown as a percentage of input.
Animal model. We conducted all animal care and experiments in accordance with the Association for Assessment and Accreditation of Laboratory Animal Care guidelines and with approval from our Institutional Animal Care and Use Com-mittee (Guangzhou Medical University [#2019075] and UT Southwestern Medical Center [#102605]). All mice were housed under a 12-h light–dark diurnal cycle with controlled temperature (20–25 °C) and relative humidity (40–60%). Food and water were available ad libitum. Experiments were carried out under pathogen-free conditions and the health status of mouse lines was routinely checked by veterinary staff. No wild animals were used in the study. Experiments were carried out with randomly chosen littermates of the same sex and matched by age and body weight. Animals were sacrificed at the indicated time by CO2asphyxia, and blood samples and tissue were collected.
To generate murine subcutaneous tumors, 5 × 10⁶PANC1 or MIAPaCa2 cells
in 100μl PBS was injected subcutaneously to the right of the dorsal midline in 6–8-week-old athymic nude female mice. Once the tumors reached around 80 mm3at
day 7, mice were randomly allocated into groups and then treated with IKE (40 mg/kg, i.p., once every other day) in the absence or presence of Z-VAD-FMK (10 mg/kg, i.p., once every other day) or necrosulfonamide (10 mg/kg, i.p., once every other day) or liproxstatin-1 (10 mg/kg, i.p., once every other day) or ZZW-115 or liproxstatin-1 (5 mg/kg, i.p., once every other day) starting at day 7 for 2 weeks. Tumors were measured twice weekly and volumes were calculated using the formula length × width2×π/6.
Pancreatic-specific Lcn2-knockout mice were generated by crossing floxed Lcn2 (Lcn2flox/flox) and Pdx1-Cre transgenic mice. Lcn2flox/floxmice were a gift from Bin Gao (National Institutes of Health, USA). Pdx1-Cre mice (014647) were purchased from the Jackson Laboratory. All mice were C57BL/6 background. ForL -arginine-induced pancreatitis, a sterile solution ofL-arginine monohydrochloride (8%) was prepared in normal saline and the pH was adjusted to 7.0. Mice received two hourly intraperitoneal (i.p.) injections ofL-arginine (4 g/kg), while controls were administered saline i.p.74. In addition, pretreatment with liproxstatin-1 (10 mg/kg) or DFO (100 mg/kg) for 1 h was used in pancreatitis models.
Bioinformatics analysis. GEPIA (http://gepia.cancer-pku.cn/index.html)75, an interactive web server for analyzing the TCGA data, was used to separate the TCGA cohorts into groups with high/low expression of selected genes, which were then used for the prognostic signature validation based on the best cut-off values. The best expression cut-off refers the fragments per kilobase of exon model per million reads mapped (FPKM) value that yields maximal difference with regard to survival between the two groups at the lowest log-rank P-value.
Statistical analysis. Data are presented as mean ± SD except where otherwise indicated. GraphPad Prism 8.4.3 was used to collect and analyze data. Unpaired Student’s t tests were used to compare the means of two groups. A one-way (for one independent variable) or two-way (for two independent variables) analysis of variance (ANOVA) with Tukey’s multiple comparisons test was used for com-parison among the different groups on all pairwise combinations. Log-rank test was used to compare differences in mortality rates between groups. A two-tailed P value of <0.05 was considered statistically significant. The exact value of n within thefigures and replicates is indicated in the figure legends. We did not exclude samples or animals. No statistical methods were used to predetermine sample sizes, but our sample sizes are similar to those generally employed in thefield26,76.
Reporting summary. Further information on research design is available in the Nature Research Reporting Summary linked to this article.
Data availability
All the other data supporting thefindings of this study are available within the article and its supplementary informationfiles and from the corresponding author upon reasonable request. GEPIA (http://gepia.cancer-pku.cn/index.html)75was used to analyze the TCGA data of NURP1 (Ensembl ID: ENSG00000176046 [https://www.ncbi.nlm.nih.gov/gene/26471]) or LCN2 (Ensembl ID: ENSG00000148346 [https://www.ncbi.nlm.nih.gov/gene/3934]) gene. Source data are provided with this paper.
Received: 1 April 2020; Accepted: 24 December 2020;
References
1. Galluzzi, L. et al. Molecular mechanisms of cell death: recommendations of the Nomenclature Committee on Cell Death 2018. Cell Death Differ. 25, 486–541 (2018).
2. Tang, D., Kang, R., Berghe, T. V., Vandenabeele, P. & Kroemer, G. The molecular machinery of regulated cell death. Cell Res. 29, 347–364 (2019). 3. Dixon, S. J. et al. Ferroptosis: an iron-dependent form of nonapoptotic cell
death. Cell 149, 1060–1072 (2012).
4. Tang, D. & Kroemer, G. Ferroptosis. Curr. Biol. 30, R1292–R1297 (2020). 5. Xie, Y. et al. Ferroptosis: process and function. Cell Death Differ. 23, 369–379
(2016).
6. Stockwell, B. R. et al. Ferroptosis: a regulated cell death nexus linking metabolism, redox biology, and disease. Cell 171, 273–285 (2017). 7. Tang, D., Chen, X., Kang, R. & Kroemer, G. Ferroptosis: molecular
mechanisms and health implications. Cell Res. https://doi.org/10.1038/s41422-41020-00441-41421(2020).
8. Chen, X., Yu, C., Kang, R. & Tang, D. Iron metabolism in ferroptosis. Front. Cell Dev. Biol. 8, 590226 (2020).
9. Wen, Q., Liu, J., Kang, R., Zhou, B. & Tang, D. The release and activity of HMGB1 in ferroptosis. Biochem. Biophys. Res. Commun. 510, 278–283 (2019). 10. Chen, X., Li, J., Kang, R., Klionsky, D. J. & Tang, D. Ferroptosis: machinery and
regulation. Autophagy, 1–28https://doi.org/10.1080/15548627.2020.1810918 (2020).
11. Dai, C. et al. Transcription factors in ferroptotic cell death. Cancer Gene Ther. 27, 645–656 (2020).
12. Sun, X. et al. Activation of the p62–Keap1–NRF2 pathway protects against ferroptosis in hepatocellular carcinoma cells. Hepatology 63, 173–184 (2016).
13. Anandhan, A., Dodson, M., Schmidlin, C. J., Liu, P. & Zhang, D. D. Breakdown of an ironclad defense system: the critical role of NRF2 in